The same plot in 14 other libraries — Python: Altair, Bokeh, lets-plot, Matplotlib, Plotly, plotnine, Pygal, Seaborn; R: ggplot2; JavaScript: Chart.js, D3.js, Apache ECharts, Highcharts, MUI X Charts. Compare all 15 side by side: Static Transport Network Diagram in Python, R, Julia and JavaScript.
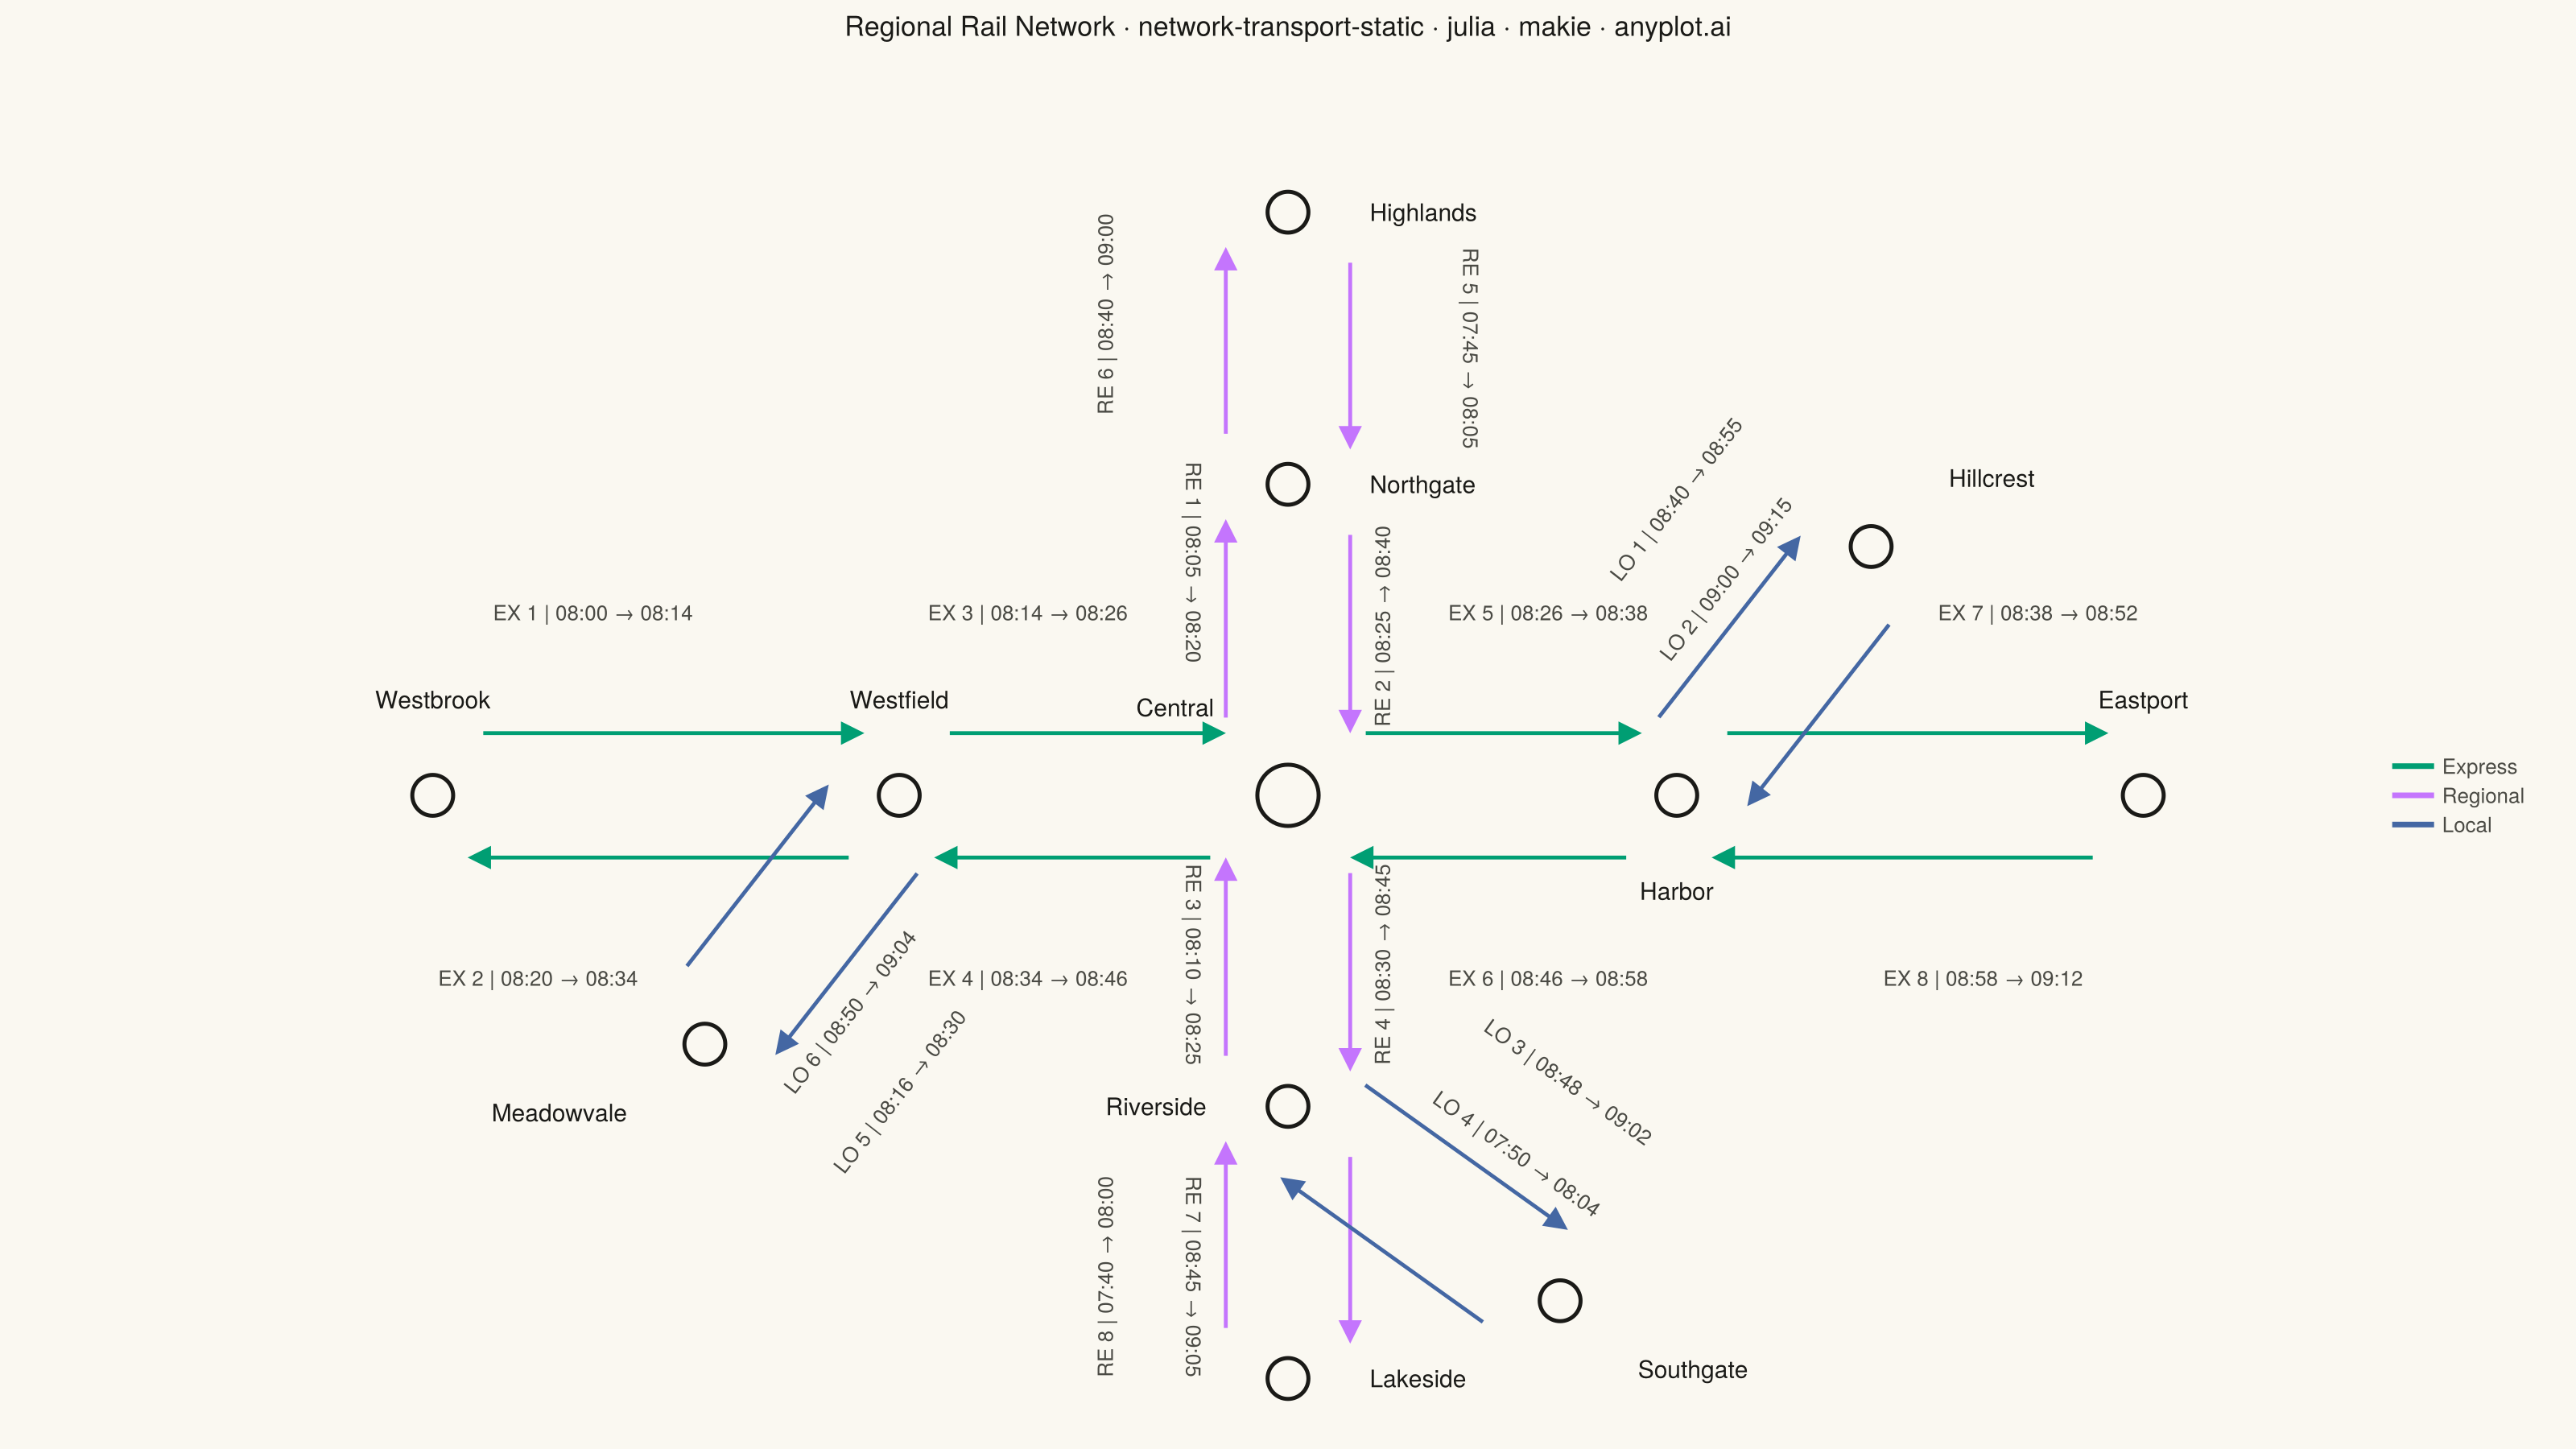
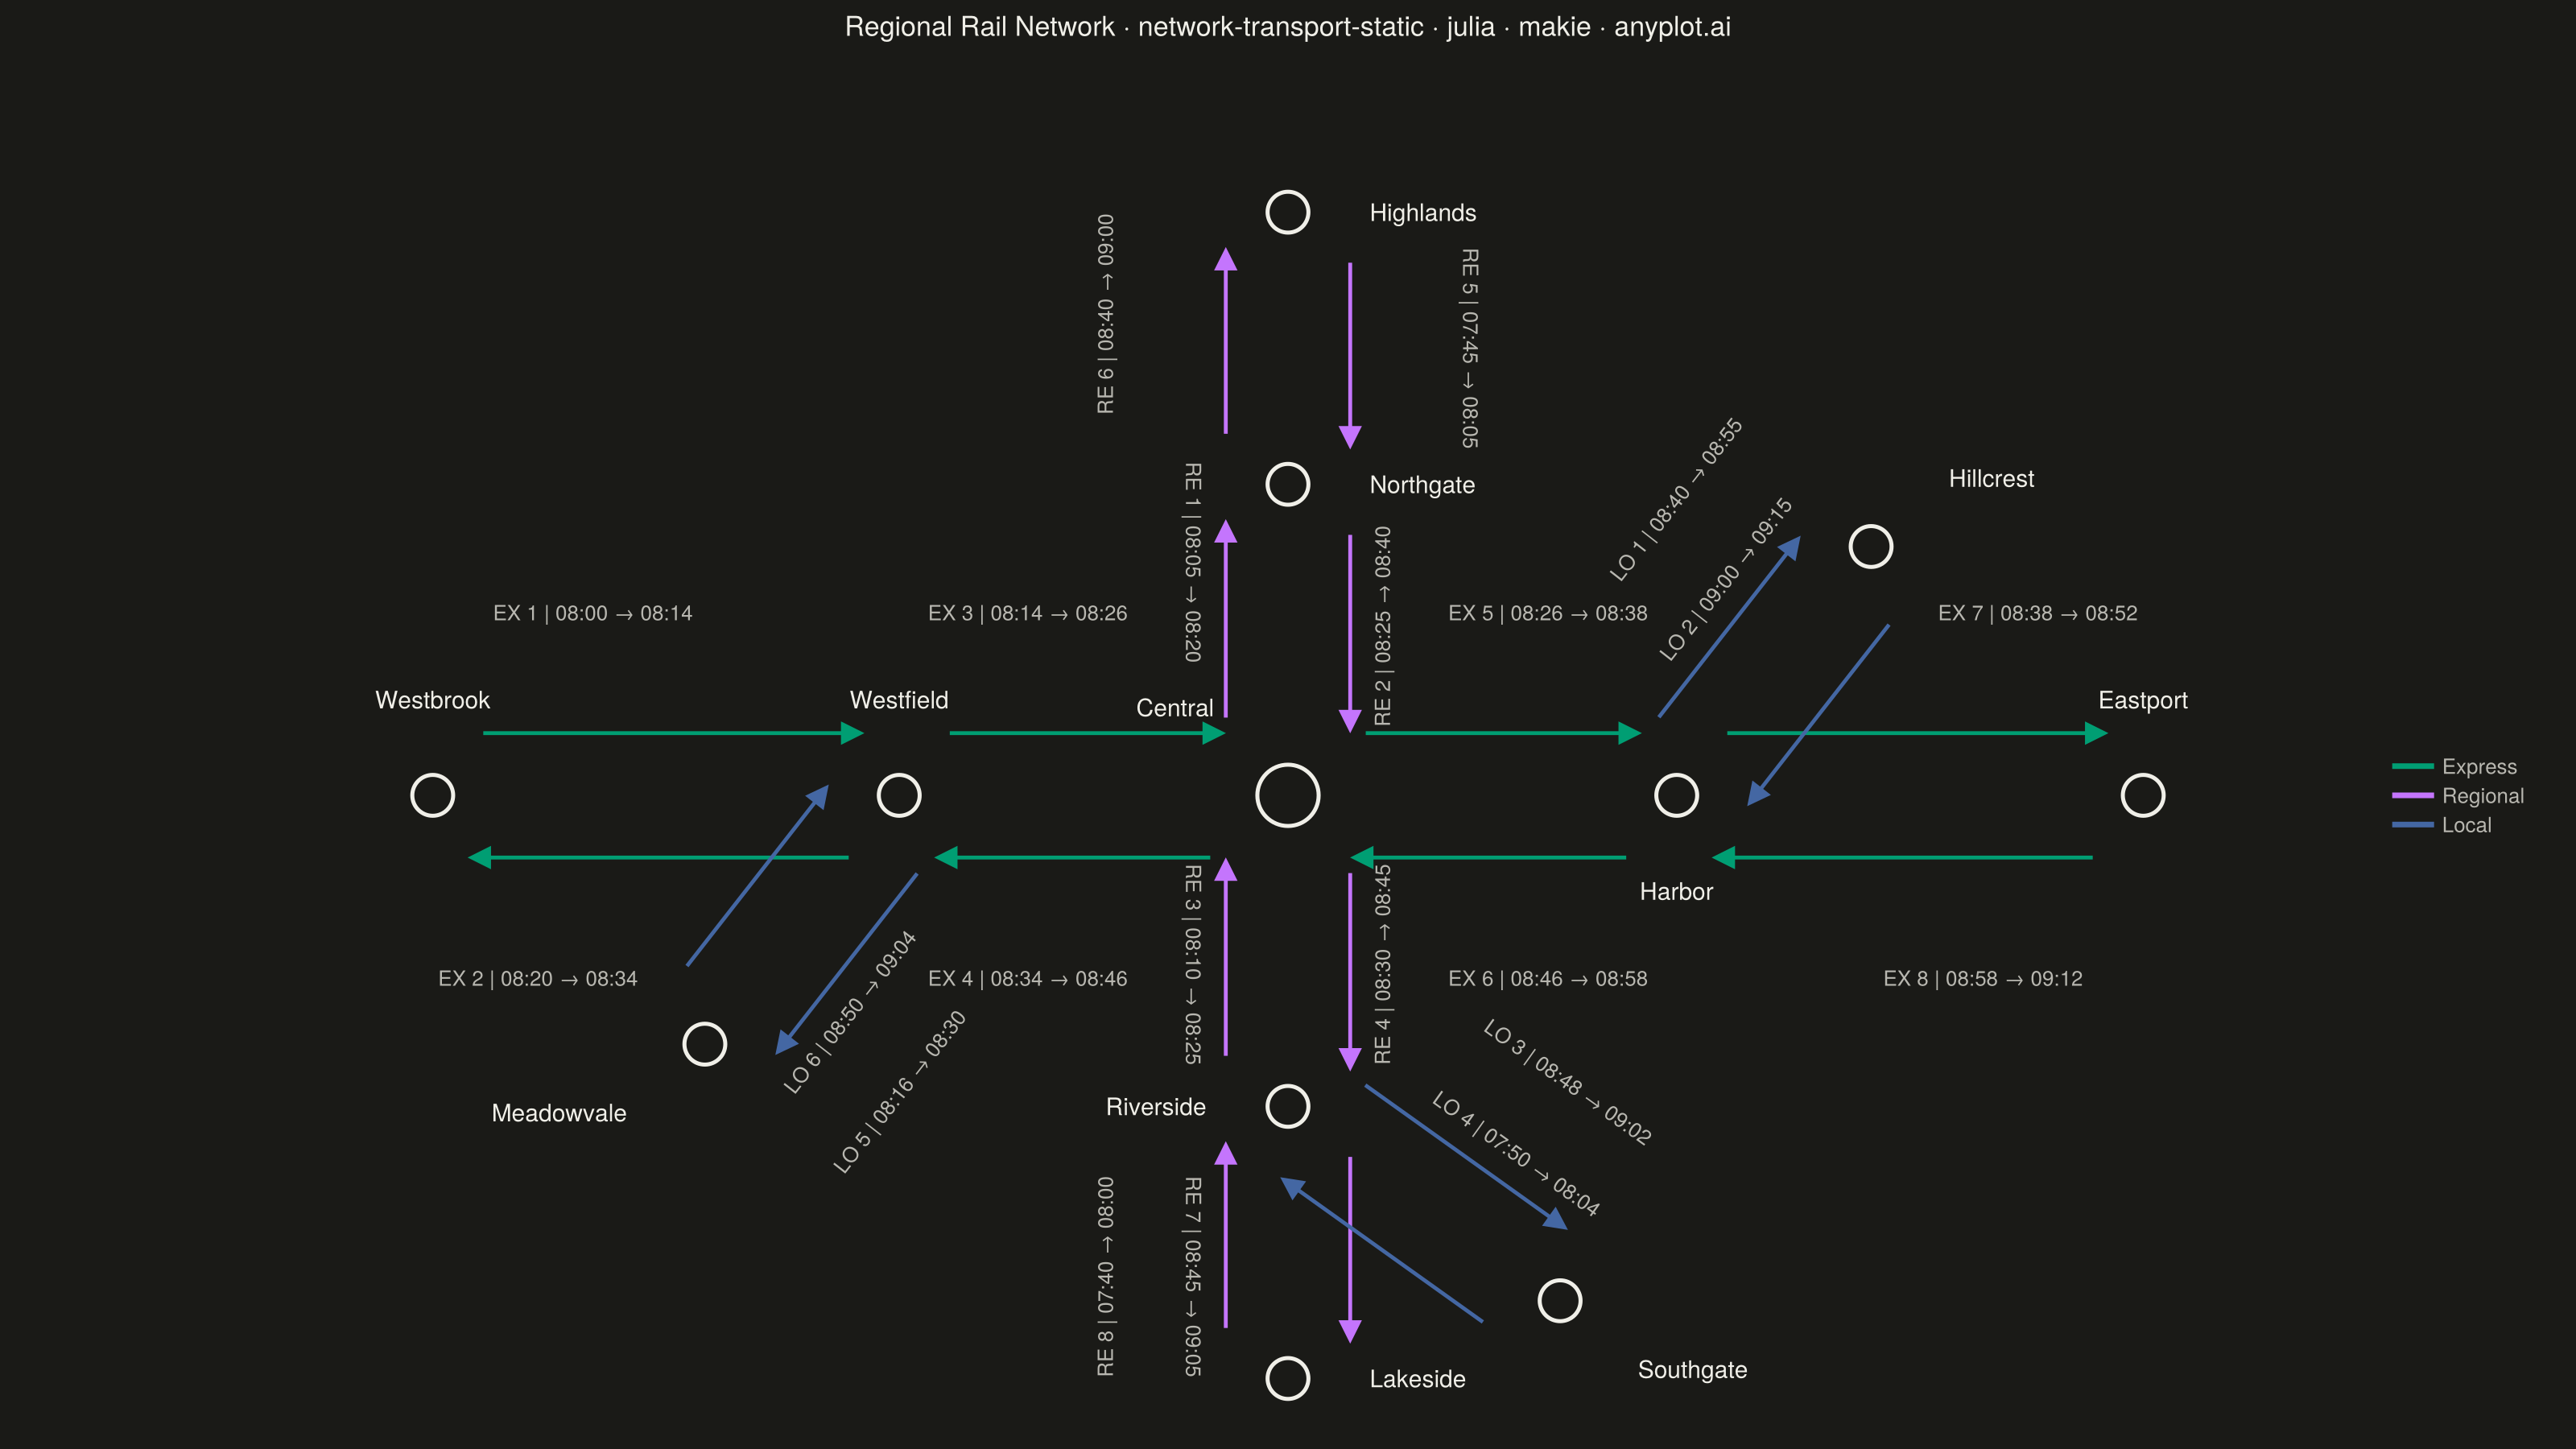
A directed network visualization for transportation systems where stations are displayed as labeled nodes and train/bus routes as directed edges. Edges display departure times, arrival times, and route identifiers. Designed for visualizing timetables, route maps, and connection patterns in rail, bus, or flight networks. This static version focuses on clear, readable presentation without interactive repositioning.
# anyplot.ai
# network-transport-static: Static Transport Network Diagram
# Library: makie 0.21.9 | Julia 1.11.9
# Quality: 81/100 | Created: 2026-09-02

using CairoMakie
using Colors

# Theme tokens — Imprint palette
const THEME    = get(ENV, "ANYPLOT_THEME", "light")
const PAGE_BG  = THEME == "light" ? colorant"#FAF8F1" : colorant"#1A1A17"
const INK      = THEME == "light" ? colorant"#1A1A17" : colorant"#F0EFE8"
const INK_SOFT = THEME == "light" ? colorant"#4A4A44" : colorant"#B8B7B0"

const IMPRINT_PALETTE = [
    colorant"#009E73",  # 1 — brand green
    colorant"#C475FD",  # 2 — lavender
    colorant"#4467A3",  # 3 — blue
]
const KIND_COLOR = Dict(
    :express  => IMPRINT_PALETTE[1],
    :regional => IMPRINT_PALETTE[2],
    :local    => IMPRINT_PALETTE[3],
)

# Data — regional rail network: 12 stations, 22 timetabled services.
# Layout is a hand-placed schematic (x, y are fixed coordinates, not a
# force-directed layout): one express trunk (Westbrook–Eastport), one
# regional line crossing it at Central (Highlands–Lakeside), and three local
# spurs branching off single interchanges — so no station carries more than
# 4 lines and every junction's spokes sit well apart in angle. r is the
# node's inset radius in data units (edges stop at the node boundary, not
# its center) and ms is the marker's on-screen point size.
const stations = [
    (id = :central,    label = "Central",    x = 0.0,   y = 0.0,  r = 1.00, ldx = -0.95, ldy = 0.95,  halign = :right,  valign = :bottom, ms = 54),
    (id = :westfield,  label = "Westfield",  x = -5.0,  y = 0.0,  r = 0.65, ldx = 0.0,   ldy = 1.05,  halign = :center, valign = :bottom, ms = 36),
    (id = :westbrook,  label = "Westbrook",  x = -11.0, y = 0.0,  r = 0.65, ldx = 0.0,   ldy = 1.05,  halign = :center, valign = :bottom, ms = 36),
    (id = :harbor,     label = "Harbor",     x = 5.0,   y = 0.0,  r = 0.65, ldx = 0.0,   ldy = -1.05, halign = :center, valign = :top,    ms = 36),
    (id = :eastport,   label = "Eastport",   x = 11.0,  y = 0.0,  r = 0.65, ldx = 0.0,   ldy = 1.05,  halign = :center, valign = :bottom, ms = 36),
    (id = :northgate,  label = "Northgate",  x = 0.0,   y = 4.0,  r = 0.65, ldx = 1.05,  ldy = 0.0,   halign = :left,   valign = :center, ms = 36),
    (id = :highlands,  label = "Highlands",  x = 0.0,   y = 7.5,  r = 0.65, ldx = 1.05,  ldy = 0.0,   halign = :left,   valign = :center, ms = 36),
    (id = :riverside,  label = "Riverside",  x = 0.0,   y = -4.0, r = 0.65, ldx = -1.05, ldy = 0.0,   halign = :right,  valign = :center, ms = 36),
    (id = :lakeside,   label = "Lakeside",   x = 0.0,   y = -7.5, r = 0.65, ldx = 1.05,  ldy = 0.0,   halign = :left,   valign = :center, ms = 36),
    (id = :hillcrest,  label = "Hillcrest",  x = 7.5,   y = 3.2,  r = 0.65, ldx = 1.00,  ldy = 0.70,  halign = :left,   valign = :bottom, ms = 36),
    (id = :southgate,  label = "Southgate",  x = 3.5,   y = -6.5, r = 0.65, ldx = 1.00,  ldy = -0.70, halign = :left,   valign = :top,    ms = 36),
    (id = :meadowvale, label = "Meadowvale", x = -7.5,  y = -3.2, r = 0.65, ldx = -1.00, ldy = -0.70, halign = :right,  valign = :top,    ms = 36),
]

# Directed services: (source, target, route_id, departure, arrival, kind).
# Every line segment (trunk, regional, and each local spur) runs in both
# directions — the resulting pairs get an offset (parallel) pair of lines
# per the spec's "curved or offset edges" guidance for multi-edges.
const routes = [
    (source = :westbrook,  target = :westfield,  route_id = "EX 1", dep = "08:00", arr = "08:14", kind = :express),
    (source = :westfield,  target = :westbrook,  route_id = "EX 2", dep = "08:20", arr = "08:34", kind = :express),
    (source = :westfield,  target = :central,    route_id = "EX 3", dep = "08:14", arr = "08:26", kind = :express),
    (source = :central,    target = :westfield,  route_id = "EX 4", dep = "08:34", arr = "08:46", kind = :express),
    (source = :central,    target = :harbor,     route_id = "EX 5", dep = "08:26", arr = "08:38", kind = :express),
    (source = :harbor,     target = :central,    route_id = "EX 6", dep = "08:46", arr = "08:58", kind = :express),
    (source = :harbor,     target = :eastport,   route_id = "EX 7", dep = "08:38", arr = "08:52", kind = :express),
    (source = :eastport,   target = :harbor,     route_id = "EX 8", dep = "08:58", arr = "09:12", kind = :express),
    (source = :northgate,  target = :central,    route_id = "RE 1", dep = "08:05", arr = "08:20", kind = :regional),
    (source = :central,    target = :northgate,  route_id = "RE 2", dep = "08:25", arr = "08:40", kind = :regional),
    (source = :central,    target = :riverside,  route_id = "RE 3", dep = "08:10", arr = "08:25", kind = :regional),
    (source = :riverside,  target = :central,    route_id = "RE 4", dep = "08:30", arr = "08:45", kind = :regional),
    (source = :highlands,  target = :northgate,  route_id = "RE 5", dep = "07:45", arr = "08:05", kind = :regional),
    (source = :northgate,  target = :highlands,  route_id = "RE 6", dep = "08:40", arr = "09:00", kind = :regional),
    (source = :riverside,  target = :lakeside,   route_id = "RE 7", dep = "08:45", arr = "09:05", kind = :regional),
    (source = :lakeside,   target = :riverside,  route_id = "RE 8", dep = "07:40", arr = "08:00", kind = :regional),
    (source = :harbor,     target = :hillcrest,  route_id = "LO 1", dep = "08:40", arr = "08:55", kind = :local),
    (source = :hillcrest,  target = :harbor,     route_id = "LO 2", dep = "09:00", arr = "09:15", kind = :local),
    (source = :riverside,  target = :southgate,  route_id = "LO 3", dep = "08:48", arr = "09:02", kind = :local),
    (source = :southgate,  target = :riverside,  route_id = "LO 4", dep = "07:50", arr = "08:04", kind = :local),
    (source = :westfield,  target = :meadowvale, route_id = "LO 5", dep = "08:16", arr = "08:30", kind = :local),
    (source = :meadowvale, target = :westfield,  route_id = "LO 6", dep = "08:50", arr = "09:04", kind = :local),
]

const pos       = Dict(s.id => (s.x, s.y) for s in stations)
const inset     = Dict(s.id => s.r for s in stations)
const pair_seen = Set((r.source, r.target) for r in routes)
const degree    = Dict(s.id => length(Set(r.target for r in routes if r.source == s.id)) for s in stations)

# Title — mandated token plus a short descriptive prefix; fontsize scales
# down when the full string runs past the ~67-char baseline.
title_str  = "Regional Rail Network · network-transport-static · julia · makie · anyplot.ai"
title_size = round(Int, max(14, 20 * min(1.0, 67 / length(title_str))))

# Figure
fig = Figure(
    size            = (1600, 900),
    fontsize        = 14,
    backgroundcolor = PAGE_BG,
)

Label(fig[0, 1], title_str; fontsize = title_size, color = INK, halign = :center)
rowsize!(fig.layout, 0, Fixed(70))

ax = Axis(
    fig[1, 1];
    backgroundcolor    = PAGE_BG,
    aspect             = DataAspect(),
    topspinevisible    = false,
    rightspinevisible  = false,
    leftspinevisible   = false,
    bottomspinevisible = false,
    xgridvisible       = false,
    ygridvisible       = false,
    xticksvisible      = false,
    yticksvisible      = false,
    xticklabelsvisible = false,
    yticklabelsvisible = false,
)
const XMIN, XMAX = -12.3, 12.3
const YMIN, YMAX = -8.8, 8.8
xlims!(ax, XMIN, XMAX)
ylims!(ax, YMIN, YMAX)

# Single-column layout: DataAspect makes the network narrower than the full
# figure width (24.6:17.6 data aspect vs. the wider figure cell), so the
# axis letterboxes with empty margin on both sides automatically. The
# legend is inset into that existing right-hand margin below, right next to
# Eastport, instead of claiming a separate column that stranded it far from
# the diagram.
#
# Explicit Relative(1.0) below is required even for this single column/row —
# Makie's default Auto sizing collapses the cell to a tiny fraction of the
# figure when the Axis has `aspect = DataAspect()`, instead of expanding to
# fill the available space.
colsize!(fig.layout, 1, Relative(1.0))
rowsize!(fig.layout, 1, Relative(1.0))

# --- Label collision avoidance ----------------------------------------------
# Every edge label is rotated to align with its edge, so its footprint is a
# rotated rectangle (an oriented bounding box, OBB); station labels are
# axis-aligned rectangles anchored by (halign, valign) rather than centered.
# `PX_PER_UNIT` and every label's (w, h) come from real Makie glyph
# measurements (`Makie.project` / `Makie.boundingbox`) on this exact axis,
# not an estimated font-metrics guess — an earlier CHAR_W/LINE_H guess ran
# ~30-40% too large, which made the collision search reject valid candidates
# and fall back to extreme offsets instead of a nearby clear slot.
Makie.update_state_before_display!(fig)
let p0 = Makie.project(ax.scene, Point2f(0.0, 0.0)),
    p1 = Makie.project(ax.scene, Point2f(1.0, 0.0)),
    p2 = Makie.project(ax.scene, Point2f(0.0, 1.0))
    global PX_PER_UNIT = (abs(p1[1] - p0[1]) + abs(p0[2] - p2[2])) / 2
end

function measure_wh(txt, fontsize)
    tmp = text!(ax, 0.0, 0.0; text = txt, fontsize = fontsize, align = (:center, :center), rotation = 0.0)
    Makie.update_state_before_display!(fig)
    bb = Makie.boundingbox(tmp)
    delete!(ax, tmp)
    return bb.widths[1] / PX_PER_UNIT, bb.widths[2] / PX_PER_UNIT
end

function anchor_center_offset(halign, valign, w, h)
    cx = halign == :left ? w / 2 : halign == :right ? -w / 2 : 0.0
    cy = valign == :bottom ? h / 2 : valign == :top ? -h / 2 : 0.0
    return cx, cy
end

struct OBB
    cx::Float64
    cy::Float64
    hw::Float64
    hh::Float64
    ang::Float64
end

obb_axes(o::OBB) = ((cos(o.ang), sin(o.ang)), (-sin(o.ang), cos(o.ang)))

function obb_corners(o::OBB)
    (ax1, ay1), (ax2, ay2) = obb_axes(o)
    return [
        (o.cx + ax1 * o.hw + ax2 * o.hh, o.cy + ay1 * o.hw + ay2 * o.hh),
        (o.cx - ax1 * o.hw + ax2 * o.hh, o.cy - ay1 * o.hw + ay2 * o.hh),
        (o.cx - ax1 * o.hw - ax2 * o.hh, o.cy - ay1 * o.hw - ay2 * o.hh),
        (o.cx + ax1 * o.hw - ax2 * o.hh, o.cy + ay1 * o.hw - ay2 * o.hh),
    ]
end

project(corners, axis) = (minimum(c -> c[1] * axis[1] + c[2] * axis[2], corners),
                           maximum(c -> c[1] * axis[1] + c[2] * axis[2], corners))

function obb_overlap(a::OBB, b::OBB; margin = 0.0)
    ca, cb = obb_corners(a), obb_corners(b)
    for axis in (obb_axes(a)..., obb_axes(b)...)
        amin, amax = project(ca, axis)
        bmin, bmax = project(cb, axis)
        (amax + margin < bmin || bmax + margin < amin) && return false
    end
    return true
end

cross2(ax, ay, bx, by) = ax * by - ay * bx

function seg_intersect(p1, p2, p3, p4)
    d1 = cross2(p4[1] - p3[1], p4[2] - p3[2], p1[1] - p3[1], p1[2] - p3[2])
    d2 = cross2(p4[1] - p3[1], p4[2] - p3[2], p2[1] - p3[1], p2[2] - p3[2])
    d3 = cross2(p2[1] - p1[1], p2[2] - p1[2], p3[1] - p1[1], p3[2] - p1[2])
    d4 = cross2(p2[1] - p1[1], p2[2] - p1[2], p4[1] - p1[1], p4[2] - p1[2])
    return ((d1 > 0) != (d2 > 0)) && ((d3 > 0) != (d4 > 0))
end

function point_in_obb(p, o::OBB)
    (ax1, ay1), (ax2, ay2) = obb_axes(o)
    dx, dy = p[1] - o.cx, p[2] - o.cy
    return abs(dx * ax1 + dy * ay1) <= o.hw && abs(dx * ax2 + dy * ay2) <= o.hh
end

function seg_obb_overlap(p1, p2, o::OBB; margin = 0.0)
    oi = OBB(o.cx, o.cy, o.hw + margin, o.hh + margin, o.ang)
    (point_in_obb(p1, oi) || point_in_obb(p2, oi)) && return true
    corners = obb_corners(oi)
    for i in 1:4
        j = i == 4 ? 1 : i + 1
        seg_intersect(p1, p2, corners[i], corners[j]) && return true
    end
    return false
end

function circle_obb_overlap(cx, cy, r, o::OBB; margin = 0.0)
    (ax1, ay1), (ax2, ay2) = obb_axes(o)
    dx, dy = cx - o.cx, cy - o.cy
    u = clamp(dx * ax1 + dy * ay1, -o.hw, o.hw)
    v = clamp(dx * ax2 + dy * ay2, -o.hh, o.hh)
    closest_x, closest_y = o.cx + u * ax1 + v * ax2, o.cy + u * ay1 + v * ay2
    return (closest_x - cx)^2 + (closest_y - cy)^2 <= (r + margin)^2
end

function obb_in_bounds(o::OBB, xmin, xmax, ymin, ymax)
    return all(c -> xmin <= c[1] <= xmax && ymin <= c[2] <= ymax, obb_corners(o))
end

# Candidate (lt, offset-multiplier, side) triples for one edge label, tried
# distance-tier by distance-tier: every (endpoint, side) combination at the
# current offset is tried before the offset grows, so a label prefers a
# nearby clear slot (a flipped side, or the other endpoint) over a distant
# one on its preferred side — the search used to exhaust one side's offsets
# first, which cleared collisions but could fling a label several units from
# its own edge with nothing else in that empty space to relate it back.
candidate_list(lt_base, dirsign) = [
    (lt, m, side)
    for m in (1.0, 1.3, 1.6, 1.9, 2.2, 2.5, 2.8, 3.1, 3.4, 3.7, 4.0, 4.5, 5.0)
    for lt in (lt_base, 1 - lt_base, 0.5, 0.15, 0.85, 0.05, 0.95)
    for side in (dirsign, -dirsign)
]

# Station-label boxes are placed first — they're fixed, so every edge label
# must steer around them rather than the other way round. Node markers
# (`scatter!` circles, sized in screen px like the labels) are a second
# fixed obstacle class — an edge label landing on top of a station ring is
# just as unreadable as landing on the station's text.
placed_boxes = OBB[]
for s in stations
    w, h = measure_wh(s.label, 15)
    cxoff, cyoff = anchor_center_offset(s.halign, s.valign, w, h)
    ax_, ay_ = s.x + s.ldx, s.y + s.ldy
    push!(placed_boxes, OBB(ax_ + cxoff, ay_ + cyoff, w / 2, h / 2, 0.0))
end

node_circles = [(s.x, s.y, (s.ms / 2) / PX_PER_UNIT) for s in stations]

# Edges — offset parallel lines distinguish each bidirectional pair; every
# edge ends with a direction arrowhead. Line/arrow geometry is drawn
# immediately; labels are placed in a second pass once every line segment is
# known, so a label can be checked against *all* edges, not just earlier ones.
route_geom = NamedTuple[]
for r in routes
    sx, sy = pos[r.source]
    tx, ty = pos[r.target]
    dx, dy = tx - sx, ty - sy
    dist   = sqrt(dx^2 + dy^2)
    ux, uy = dx / dist, dy / dist

    # The offset side must be anchored to the *pair* (station A, station B),
    # not to this route's own direction — a reverse route's (ux, uy) already
    # points the opposite way, so using its own perpendicular here would flip
    # sign together with dirsign and cancel out, landing both directions on
    # the same line. Anchor px/py to the alphabetically-smaller-first vector
    # instead, which is identical for both directions of a pair.
    forward       = string(r.source) < string(r.target)
    dirsign       = forward ? 1.0 : -1.0
    canon_ux, canon_uy = forward ? (ux, uy) : (-ux, -uy)
    canon_px, canon_py = -canon_uy, canon_ux
    has_pair = (r.target, r.source) in pair_seen
    line_off = has_pair ? 0.80 * dirsign : 0.0
    ox, oy   = canon_px * line_off, canon_py * line_off

    r_src, r_tgt = inset[r.source], inset[r.target]
    x0, y0 = sx + ox + ux * r_src, sy + oy + uy * r_src
    x1, y1 = tx + ox - ux * r_tgt, ty + oy - uy * r_tgt

    col = KIND_COLOR[r.kind]
    lines!(ax, [x0, x1], [y0, y1]; color = col, linewidth = 2.4)
    arrows!(ax, [x1], [y1], [ux * 0.001], [uy * 0.001];
            arrowsize = 20, color = col, linewidth = 0)

    ang = atan(dy, dx)
    if ang > pi / 2
        ang -= pi
    elseif ang < -pi / 2
        ang += pi
    end

    txt  = "$(r.route_id) | $(r.dep) → $(r.arr)"
    w, h = measure_wh(txt, 13)

    push!(route_geom, (r = r, x0 = x0, y0 = y0, x1 = x1, y1 = y1,
                        canon_px = canon_px, canon_py = canon_py,
                        dirsign = dirsign, line_off = line_off, ang = ang,
                        txt = txt, w = w, h = h))
end

line_segments = [((g.x0, g.y0), (g.x1, g.y1)) for g in route_geom]

# Label sits near whichever endpoint has fewer other lines converging on it,
# not at the midpoint — a busy interchange has every spoke close together,
# but a quiet terminus has open space for the route/time text. From that
# starting point, walk `candidate_list` until a position clears every
# station label, every previously-placed edge label, and every edge line.
for g in route_geom
    r = g.r
    lt_base = degree[r.target] <= degree[r.source] ? 0.70 : 0.30

    # Track the LEAST-colliding candidate seen so far, not just the last one
    # tried — if every candidate collides with something, falling back to
    # the final (most extreme) candidate regardless of its own score can
    # fling a label onto an unrelated station far down the list, which is
    # worse than a mild overlap near the original slot. Out-of-bounds
    # candidates are penalized rather than excluded outright, so a position
    # is always chosen even in a pathological case.
    best       = nothing
    best_score = typemax(Int)
    for (lt, mult, side) in candidate_list(lt_base, g.dirsign)
        label_off = (abs(g.line_off) + 0.75) * mult
        mx = g.x0 * (1 - lt) + g.x1 * lt + g.canon_px * label_off * side
        my = g.y0 * (1 - lt) + g.y1 * lt + g.canon_py * label_off * side
        cand = OBB(mx, my, g.w / 2, g.h / 2, g.ang)
        score = count(b -> obb_overlap(cand, b; margin = 0.08), placed_boxes) +
                count(seg -> seg_obb_overlap(seg[1], seg[2], cand; margin = 0.08), line_segments) +
                count(c -> circle_obb_overlap(c[1], c[2], c[3], cand; margin = 0.08), node_circles) +
                (obb_in_bounds(cand, XMIN, XMAX, YMIN, YMAX) ? 0 : 1000)
        if score < best_score
            best, best_score = cand, score
        end
        best_score == 0 && break
    end
    push!(placed_boxes, best)

    text!(ax, best.cx, best.cy;
          text = g.txt, fontsize = 13, color = INK_SOFT,
          align = (:center, :center), rotation = g.ang)
end

# Nodes — hollow rings so crossing edges stay visible through the station
# marker; Central is enlarged as the interchange hub (size, not text, carries
# the emphasis).
for s in stations
    scatter!(ax, [s.x], [s.y];
             markersize = s.ms, color = PAGE_BG, strokecolor = INK, strokewidth = 2.5)
    text!(ax, s.x + s.ldx, s.y + s.ldy;
          text = s.label, fontsize = 15, color = INK, align = (s.halign, s.valign))
end

# Legend — route type color key, inset into the axis's own letterboxed
# right margin (next to Eastport) rather than a separate stranded column.
leg_elements = [LineElement(color = KIND_COLOR[k], linewidth = 3.5) for k in (:express, :regional, :local)]
Legend(
    fig[1, 1],
    leg_elements,
    ["Express", "Regional", "Local"];
    title           = "Route type",
    titlesize       = 14,
    labelsize       = 13,
    titlecolor      = INK,
    labelcolor      = INK_SOFT,
    framevisible    = false,
    backgroundcolor = :transparent,
    tellwidth       = false,
    tellheight      = false,
    halign          = :right,
    valign          = :center,
    patchsize       = (26, 10),
    margin          = (10, 10, 10, 10),
)

save("plot-$(THEME).png", fig; px_per_unit = 2)
Runnable source as JSON, for any HTTP client: https://api.anyplot.ai/specs/network-transport-static/makie/code. Any spec id and library id listed in llms-full.txt fit the same URL shape; every URL below is complete and callable.
{
  "spec_id": "network-transport-static",
  "language": "julia",
  "library": "makie",
  "page": "https://anyplot.ai/network-transport-static/julia/makie",
  "hub": "https://anyplot.ai/network-transport-static",
  "code_json": "https://api.anyplot.ai/specs/network-transport-static/makie/code",
  "spec_json": "https://api.anyplot.ai/specs/network-transport-static",
  "render_light_png": "https://storage.googleapis.com/anyplot-images/plots/network-transport-static/julia/makie/plot-light.png",
  "render_dark_png": "https://storage.googleapis.com/anyplot-images/plots/network-transport-static/julia/makie/plot-dark.png",
  "quality_score": 81.0,
  "license": "MIT",
  "guide": "https://anyplot.ai/llms.txt"
}
Part of Static Transport Network Diagram on anyplot.ai.