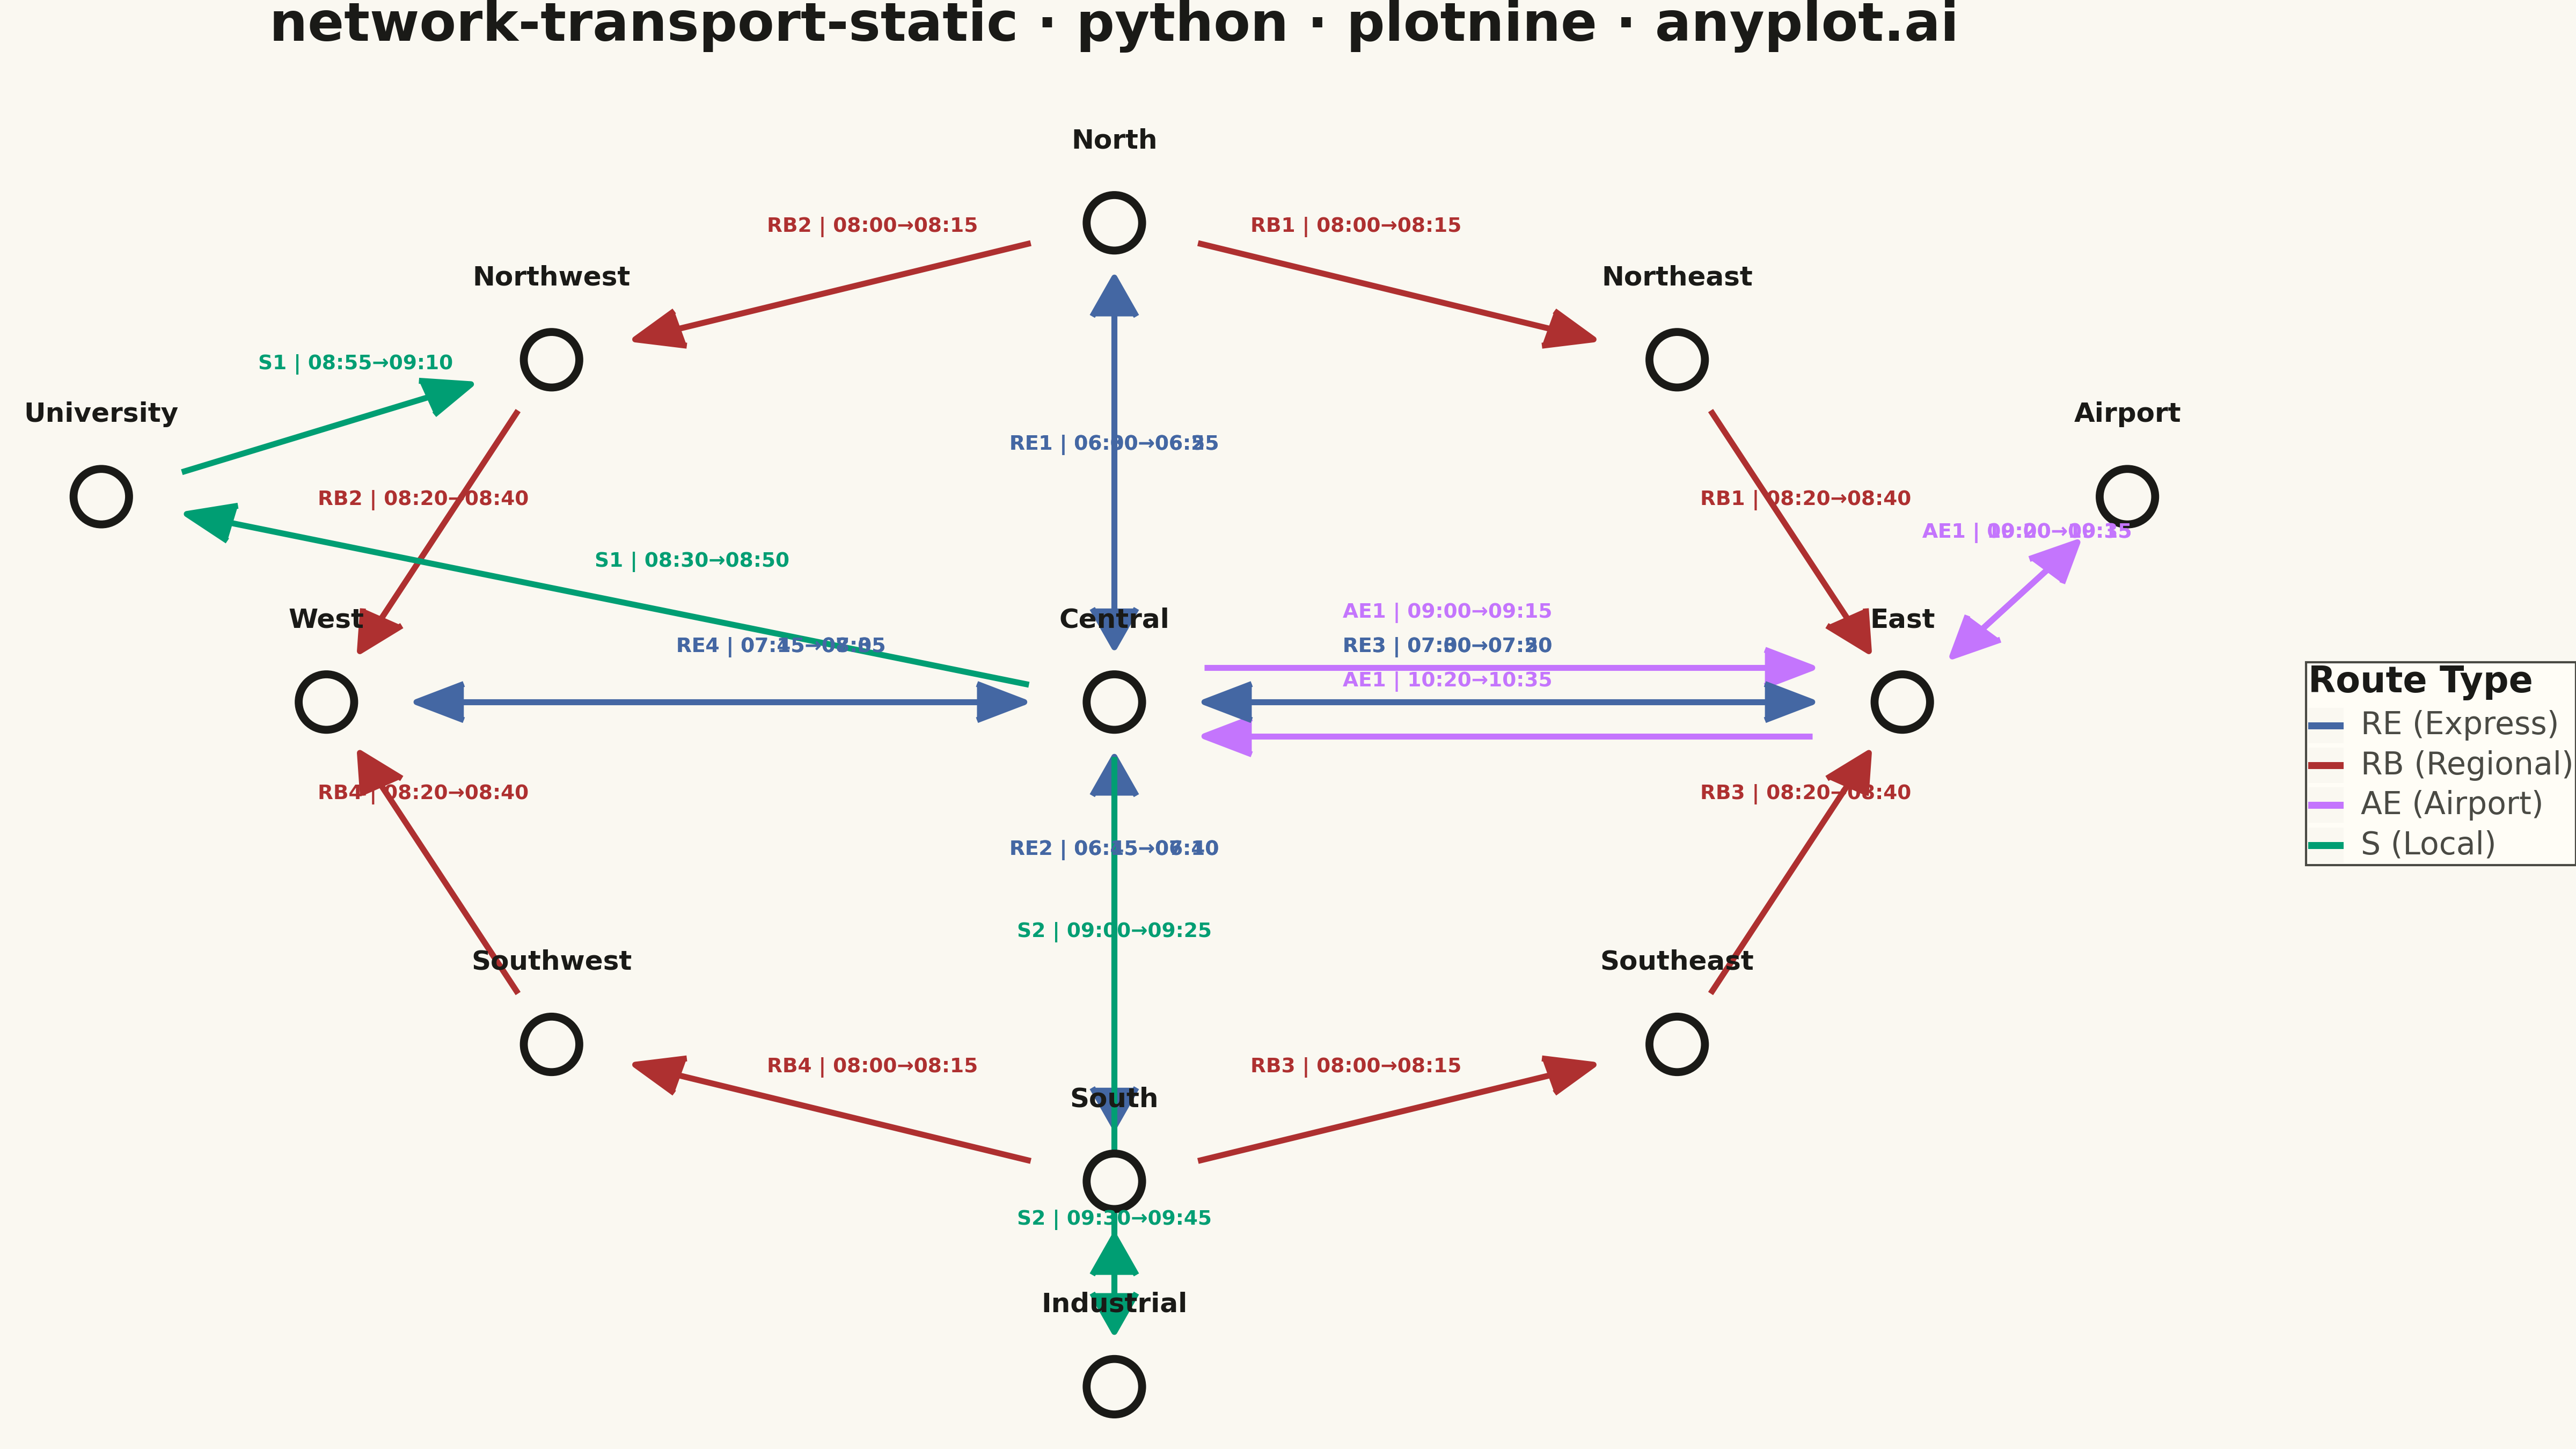
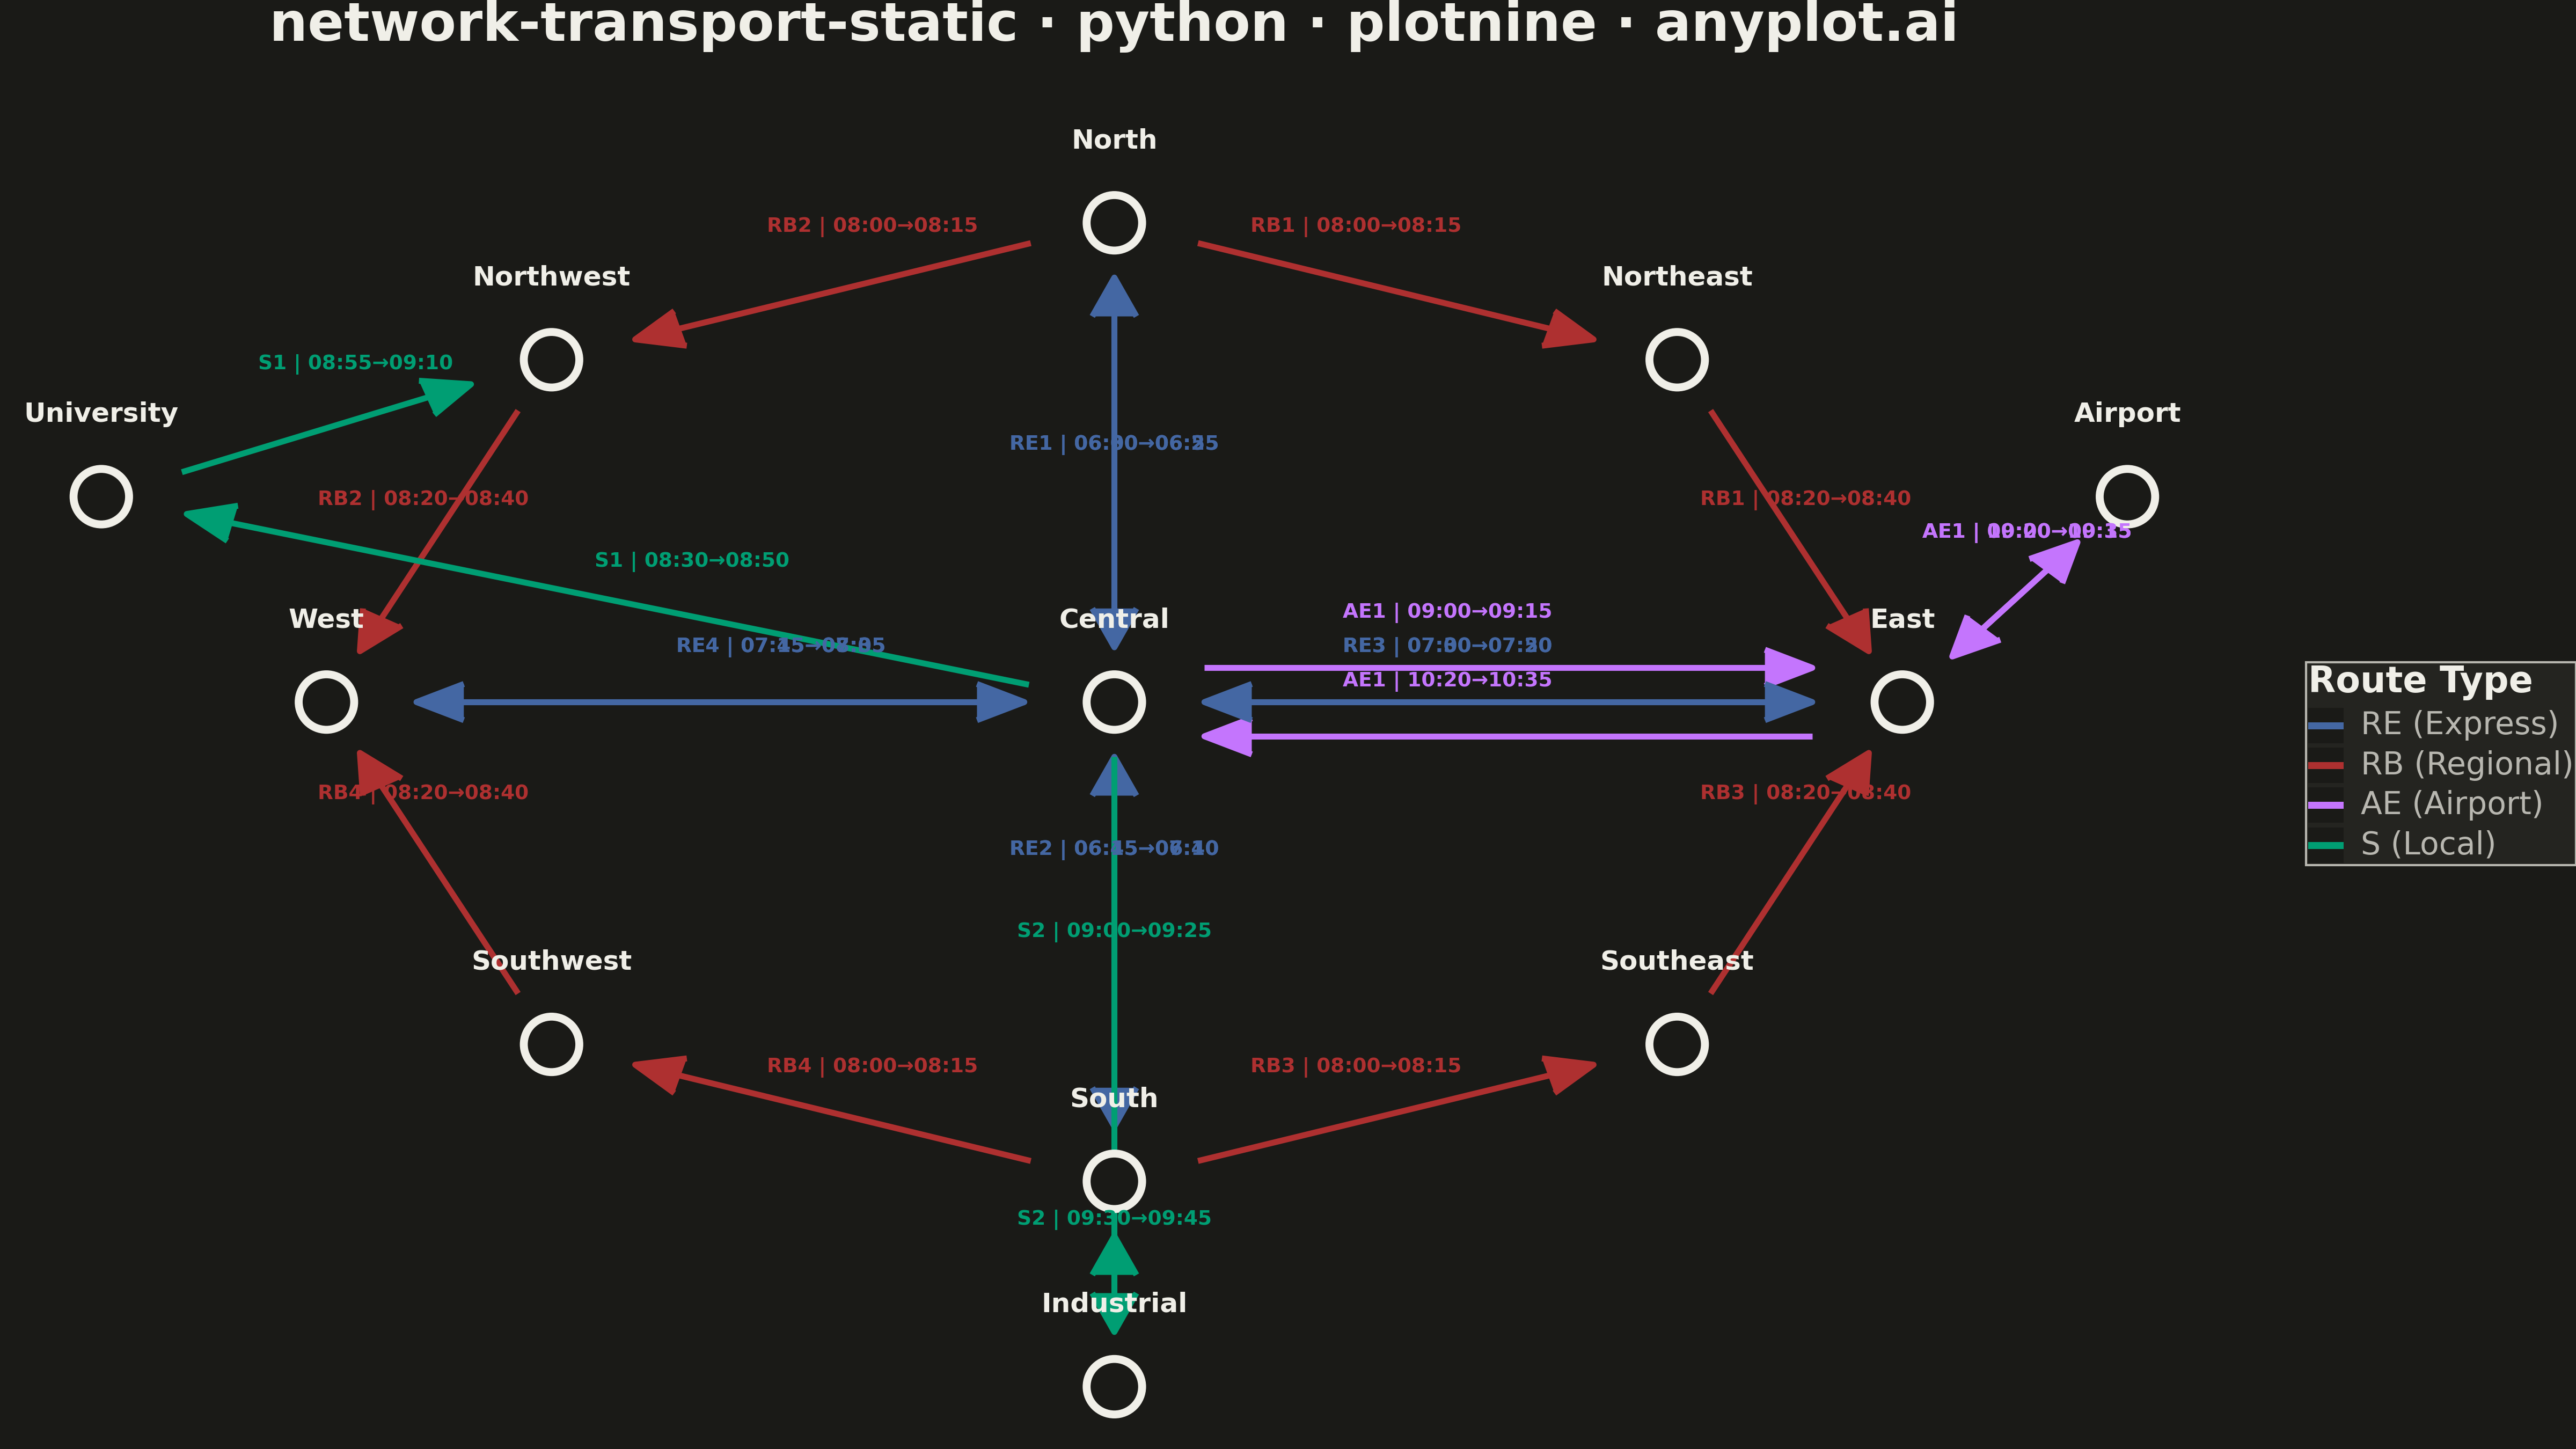
A directed network visualization for transportation systems where stations are displayed as labeled nodes and train/bus routes as directed edges. Edges display departure times, arrival times, and route identifiers. Designed for visualizing timetables, route maps, and connection patterns in rail, bus, or flight networks. This static version focuses on clear, readable presentation without interactive repositioning.
""" anyplot.ai
network-transport-static: Static Transport Network Diagram
Library: plotnine 0.15.4 | Python 3.13.13
Quality: 93/100 | Updated: 2026-05-18
"""

import os

import numpy as np
import pandas as pd
from plotnine import (
    aes,
    arrow,
    element_rect,
    element_text,
    geom_point,
    geom_segment,
    geom_text,
    ggplot,
    labs,
    scale_color_manual,
    theme,
    theme_void,
)


np.random.seed(42)

THEME = os.getenv("ANYPLOT_THEME", "light")
PAGE_BG = "#FAF8F1" if THEME == "light" else "#1A1A17"
ELEVATED_BG = "#FFFDF6" if THEME == "light" else "#242420"
INK = "#1A1A17" if THEME == "light" else "#F0EFE8"
INK_SOFT = "#4A4A44" if THEME == "light" else "#B8B7B0"

# Station data - regional rail network
stations = pd.DataFrame(
    {
        "id": ["CTR", "NTH", "STH", "EST", "WST", "NE", "NW", "SE", "SW", "AIR", "UNI", "IND"],
        "label": [
            "Central",
            "North",
            "South",
            "East",
            "West",
            "Northeast",
            "Northwest",
            "Southeast",
            "Southwest",
            "Airport",
            "University",
            "Industrial",
        ],
        "x": [0.5, 0.5, 0.5, 0.85, 0.15, 0.75, 0.25, 0.75, 0.25, 0.95, 0.05, 0.5],
        "y": [0.5, 0.85, 0.15, 0.5, 0.5, 0.75, 0.75, 0.25, 0.25, 0.65, 0.65, 0.0],
    }
)

# Route data - train services with times
routes_data = [
    # Express routes (RE)
    ("CTR", "NTH", "RE1", "06:00", "06:25"),
    ("NTH", "CTR", "RE1", "06:30", "06:55"),
    ("CTR", "STH", "RE2", "06:15", "06:40"),
    ("STH", "CTR", "RE2", "06:45", "07:10"),
    ("CTR", "EST", "RE3", "07:00", "07:20"),
    ("EST", "CTR", "RE3", "07:30", "07:50"),
    ("CTR", "WST", "RE4", "07:15", "07:35"),
    ("WST", "CTR", "RE4", "07:45", "08:05"),
    # Regional routes (RB)
    ("NTH", "NE", "RB1", "08:00", "08:15"),
    ("NE", "EST", "RB1", "08:20", "08:40"),
    ("NTH", "NW", "RB2", "08:00", "08:15"),
    ("NW", "WST", "RB2", "08:20", "08:40"),
    ("STH", "SE", "RB3", "08:00", "08:15"),
    ("SE", "EST", "RB3", "08:20", "08:40"),
    ("STH", "SW", "RB4", "08:00", "08:15"),
    ("SW", "WST", "RB4", "08:20", "08:40"),
    # Airport Express (AE)
    ("CTR", "EST", "AE1", "09:00", "09:15"),
    ("EST", "AIR", "AE1", "09:20", "09:35"),
    ("AIR", "EST", "AE1", "10:00", "10:15"),
    ("EST", "CTR", "AE1", "10:20", "10:35"),
    # Local routes (S)
    ("CTR", "UNI", "S1", "08:30", "08:50"),
    ("UNI", "NW", "S1", "08:55", "09:10"),
    ("CTR", "IND", "S2", "09:00", "09:25"),
    ("IND", "STH", "S2", "09:30", "09:45"),
]

routes = pd.DataFrame(routes_data, columns=["source", "target", "route_id", "dep", "arr"])

# Create station lookup
station_coords = stations.set_index("id")[["x", "y"]]

# Add coordinates to routes
routes["x"] = routes["source"].map(station_coords["x"])
routes["y"] = routes["source"].map(station_coords["y"])
routes["xend"] = routes["target"].map(station_coords["x"])
routes["yend"] = routes["target"].map(station_coords["y"])

# Route type for coloring
routes["route_type"] = routes["route_id"].str.extract(r"([A-Z]+)")[0]

# Offset overlapping routes
route_pairs = routes.groupby(["source", "target"]).cumcount()
offset_amount = 0.025

# Calculate perpendicular offset for multiple routes
dx = routes["xend"] - routes["x"]
dy = routes["yend"] - routes["y"]
length = np.sqrt(dx**2 + dy**2)
perpx = -dy / length * offset_amount * route_pairs
perpy = dx / length * offset_amount * route_pairs

routes["x"] = routes["x"] + perpx
routes["y"] = routes["y"] + perpy
routes["xend"] = routes["xend"] + perpx
routes["yend"] = routes["yend"] + perpy

# Shorten edges so arrows don't overlap with nodes
shorten = 0.04
dx = routes["xend"] - routes["x"]
dy = routes["yend"] - routes["y"]
length = np.sqrt(dx**2 + dy**2)
routes["x"] = routes["x"] + dx / length * shorten
routes["y"] = routes["y"] + dy / length * shorten
routes["xend"] = routes["xend"] - dx / length * shorten
routes["yend"] = routes["yend"] - dy / length * shorten

# Calculate edge label positions - stagger along edge to reduce overlaps
label_offset = np.where(routes.index % 2 == 0, 0.4, 0.6)
routes["label_x"] = routes["x"] + (routes["xend"] - routes["x"]) * label_offset
routes["label_y"] = routes["y"] + (routes["yend"] - routes["y"]) * label_offset
routes["edge_label"] = routes["route_id"] + " | " + routes["dep"] + "→" + routes["arr"]

# Color palette for route types
route_colors = {
    "RE": "#4467A3",  # Blue - Express
    "RB": "#AE3030",  # Orange - Regional
    "AE": "#C475FD",  # Vermillion - Airport
    "S": "#009E73",  # Green - Local (first series brand color)
}

# Create the plot
plot = (
    ggplot()
    # Draw route edges with arrows
    + geom_segment(
        data=routes,
        mapping=aes(x="x", y="y", xend="xend", yend="yend", color="route_type"),
        size=1.5,
        arrow=arrow(length=0.15, type="closed", angle=25),
    )
    # Draw station nodes
    + geom_point(data=stations, mapping=aes(x="x", y="y"), size=12, fill=PAGE_BG, color=INK, stroke=2)
    # Station labels
    + geom_text(
        data=stations, mapping=aes(x="x", y="y", label="label"), size=12, fontweight="bold", color=INK, nudge_y=0.06
    )
    # Edge labels (route and times) - improved size and positioning
    + geom_text(
        data=routes,
        mapping=aes(x="label_x", y="label_y", label="edge_label", color="route_type"),
        size=9,
        nudge_y=0.04,
        fontweight="bold",
        show_legend=False,
    )
    # Color scale
    + scale_color_manual(
        values=route_colors,
        name="Route Type",
        labels={"RE": "RE (Express)", "RB": "RB (Regional)", "AE": "AE (Airport)", "S": "S (Local)"},
        limits=["RE", "RB", "AE", "S"],
    )
    # Labels and theme
    + labs(title="network-transport-static · python · plotnine · anyplot.ai")
    + theme_void()
    + theme(
        figure_size=(16, 9),
        plot_background=element_rect(fill=PAGE_BG, color=PAGE_BG),
        panel_background=element_rect(fill=PAGE_BG),
        plot_title=element_text(size=24, ha="center", weight="bold", color=INK),
        legend_position="right",
        legend_background=element_rect(fill=ELEVATED_BG, color=INK_SOFT),
        legend_title=element_text(size=16, weight="bold", color=INK),
        legend_text=element_text(size=14, color=INK_SOFT),
    )
)

# Save
plot.save(f"plot-{THEME}.png", dpi=300, verbose=False)
Runnable source as JSON, for any HTTP client: https://api.anyplot.ai/specs/network-transport-static/plotnine/code. Any spec id and library id listed in llms-full.txt fit the same URL shape; every URL below is complete and callable.
{
  "spec_id": "network-transport-static",
  "language": "python",
  "library": "plotnine",
  "page": "https://anyplot.ai/network-transport-static/python/plotnine",
  "hub": "https://anyplot.ai/network-transport-static",
  "code_json": "https://api.anyplot.ai/specs/network-transport-static/plotnine/code",
  "spec_json": "https://api.anyplot.ai/specs/network-transport-static",
  "render_light_png": "https://storage.googleapis.com/anyplot-images/plots/network-transport-static/python/plotnine/plot-light.png",
  "render_dark_png": "https://storage.googleapis.com/anyplot-images/plots/network-transport-static/python/plotnine/plot-dark.png",
  "quality_score": 93.0,
  "license": "MIT",
  "guide": "https://anyplot.ai/llms.txt"
}
Part of Static Transport Network Diagram on anyplot.ai.