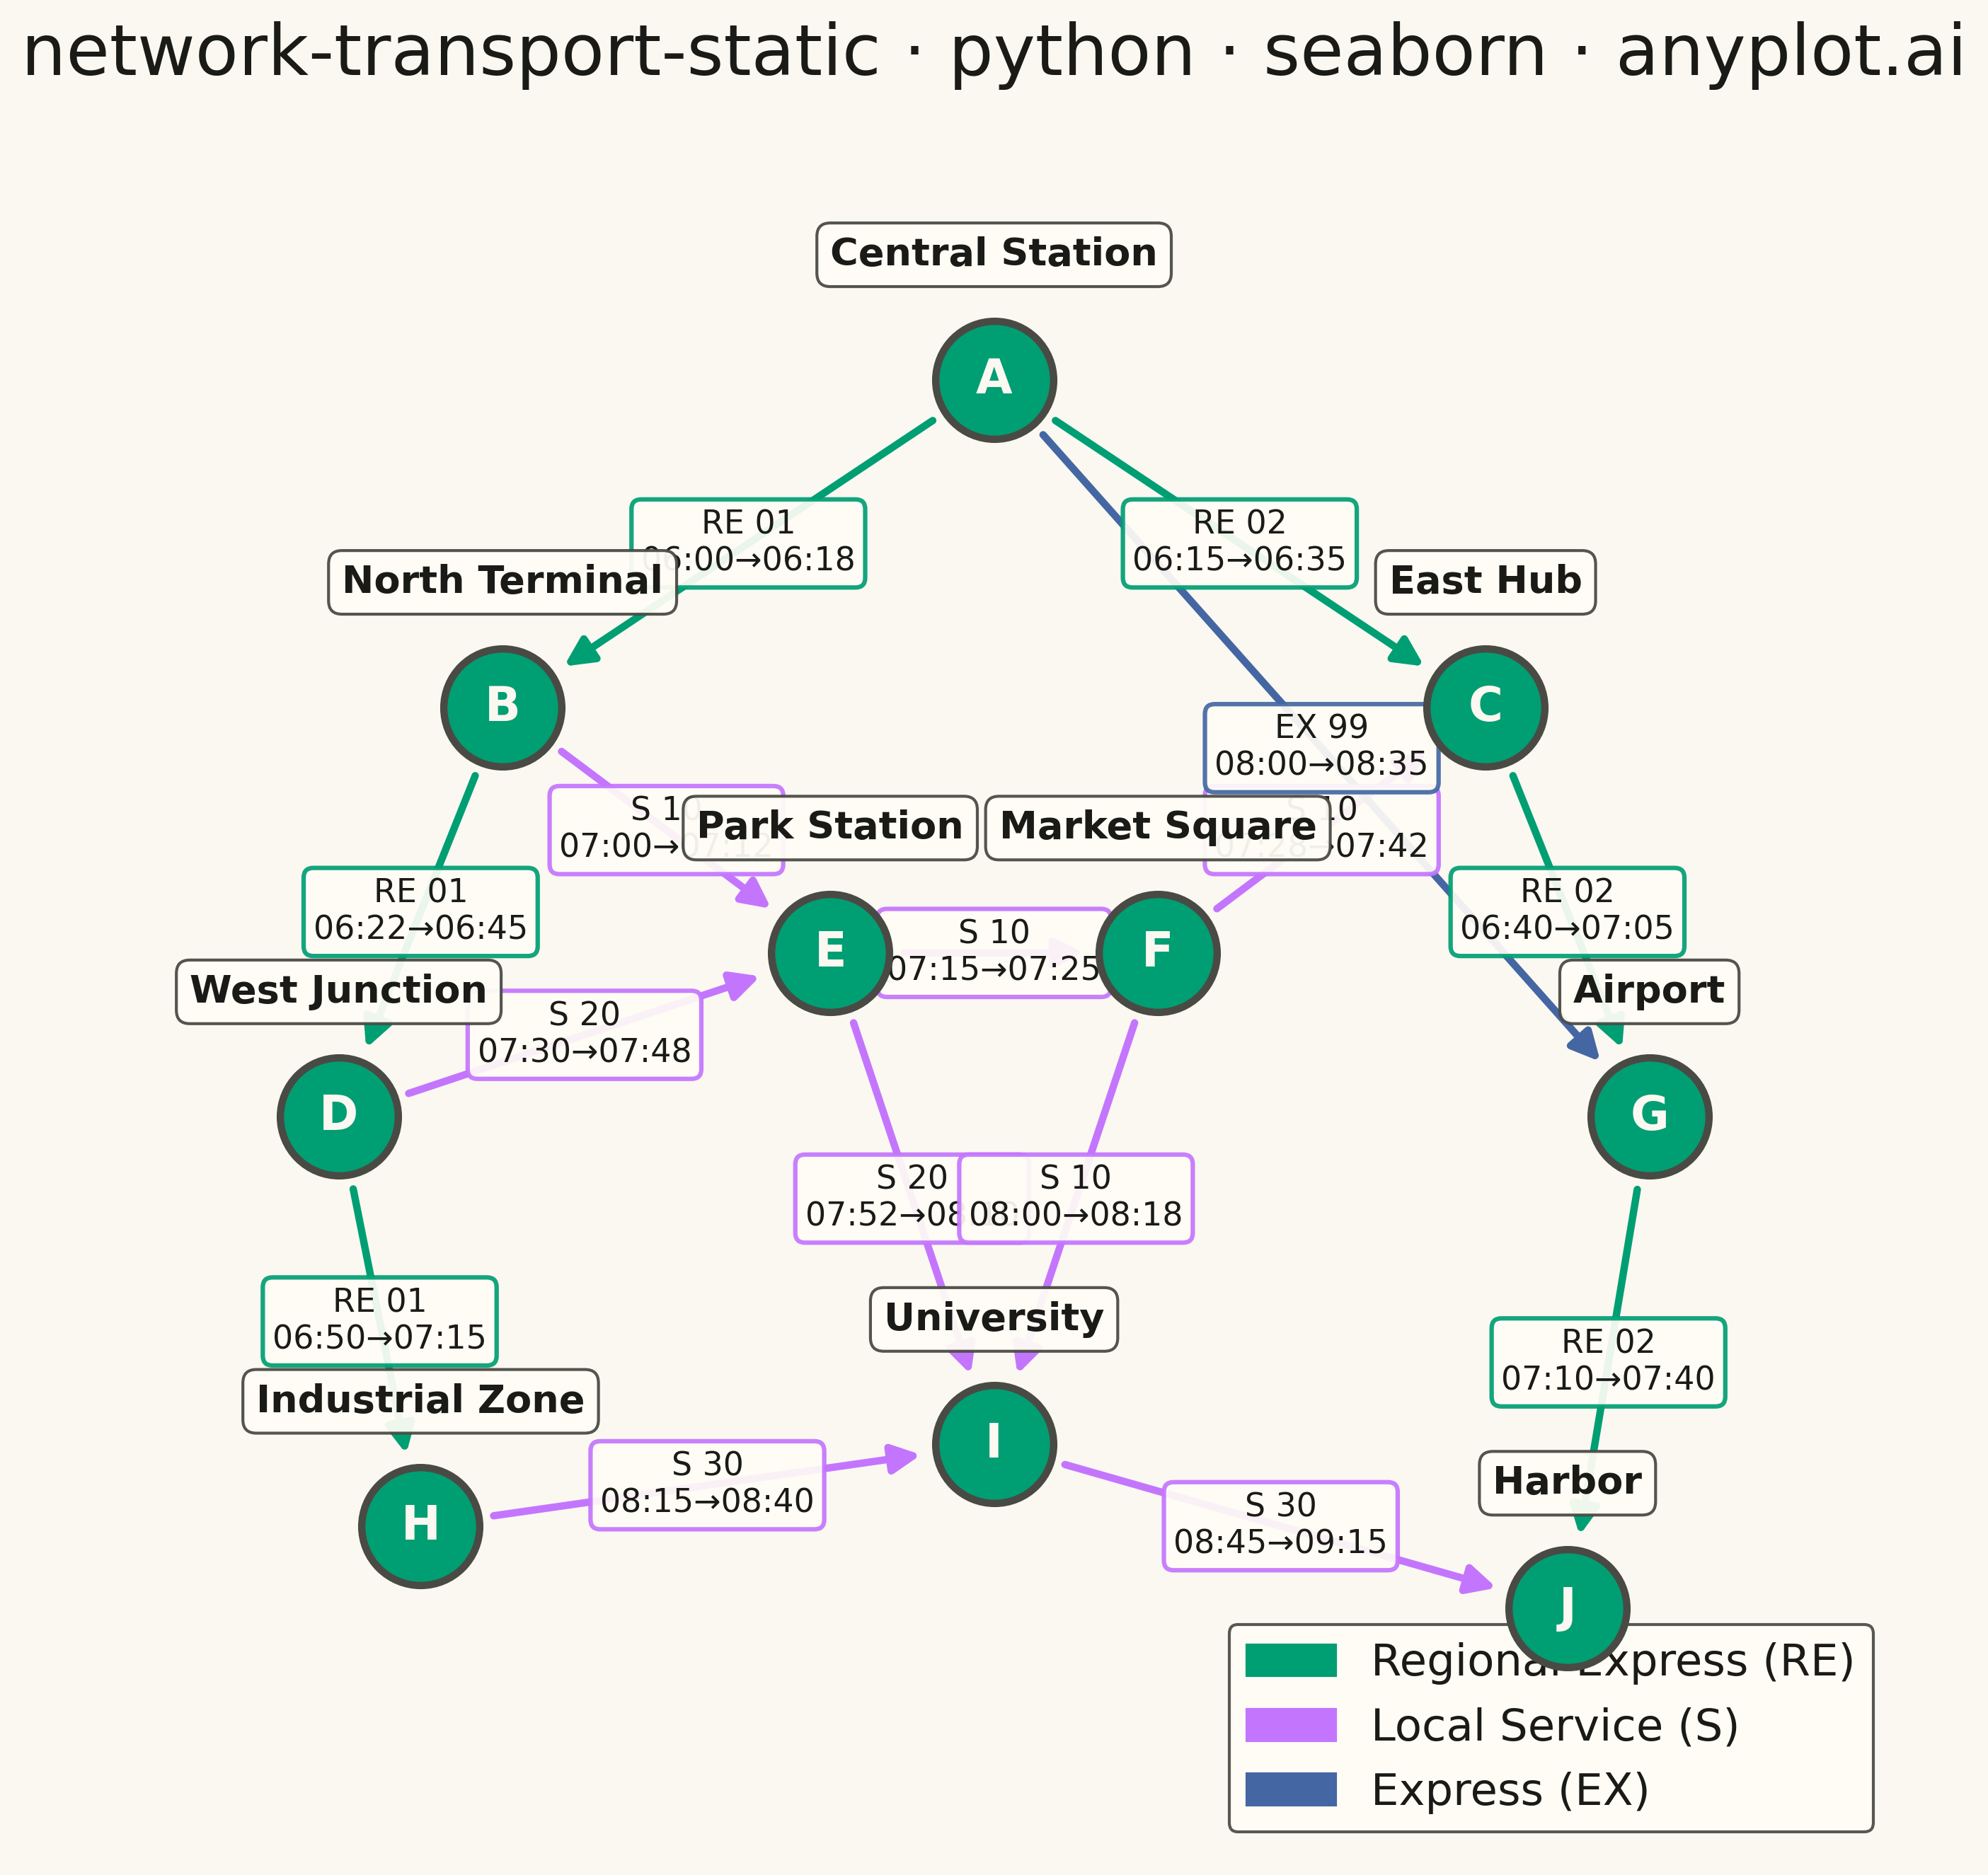
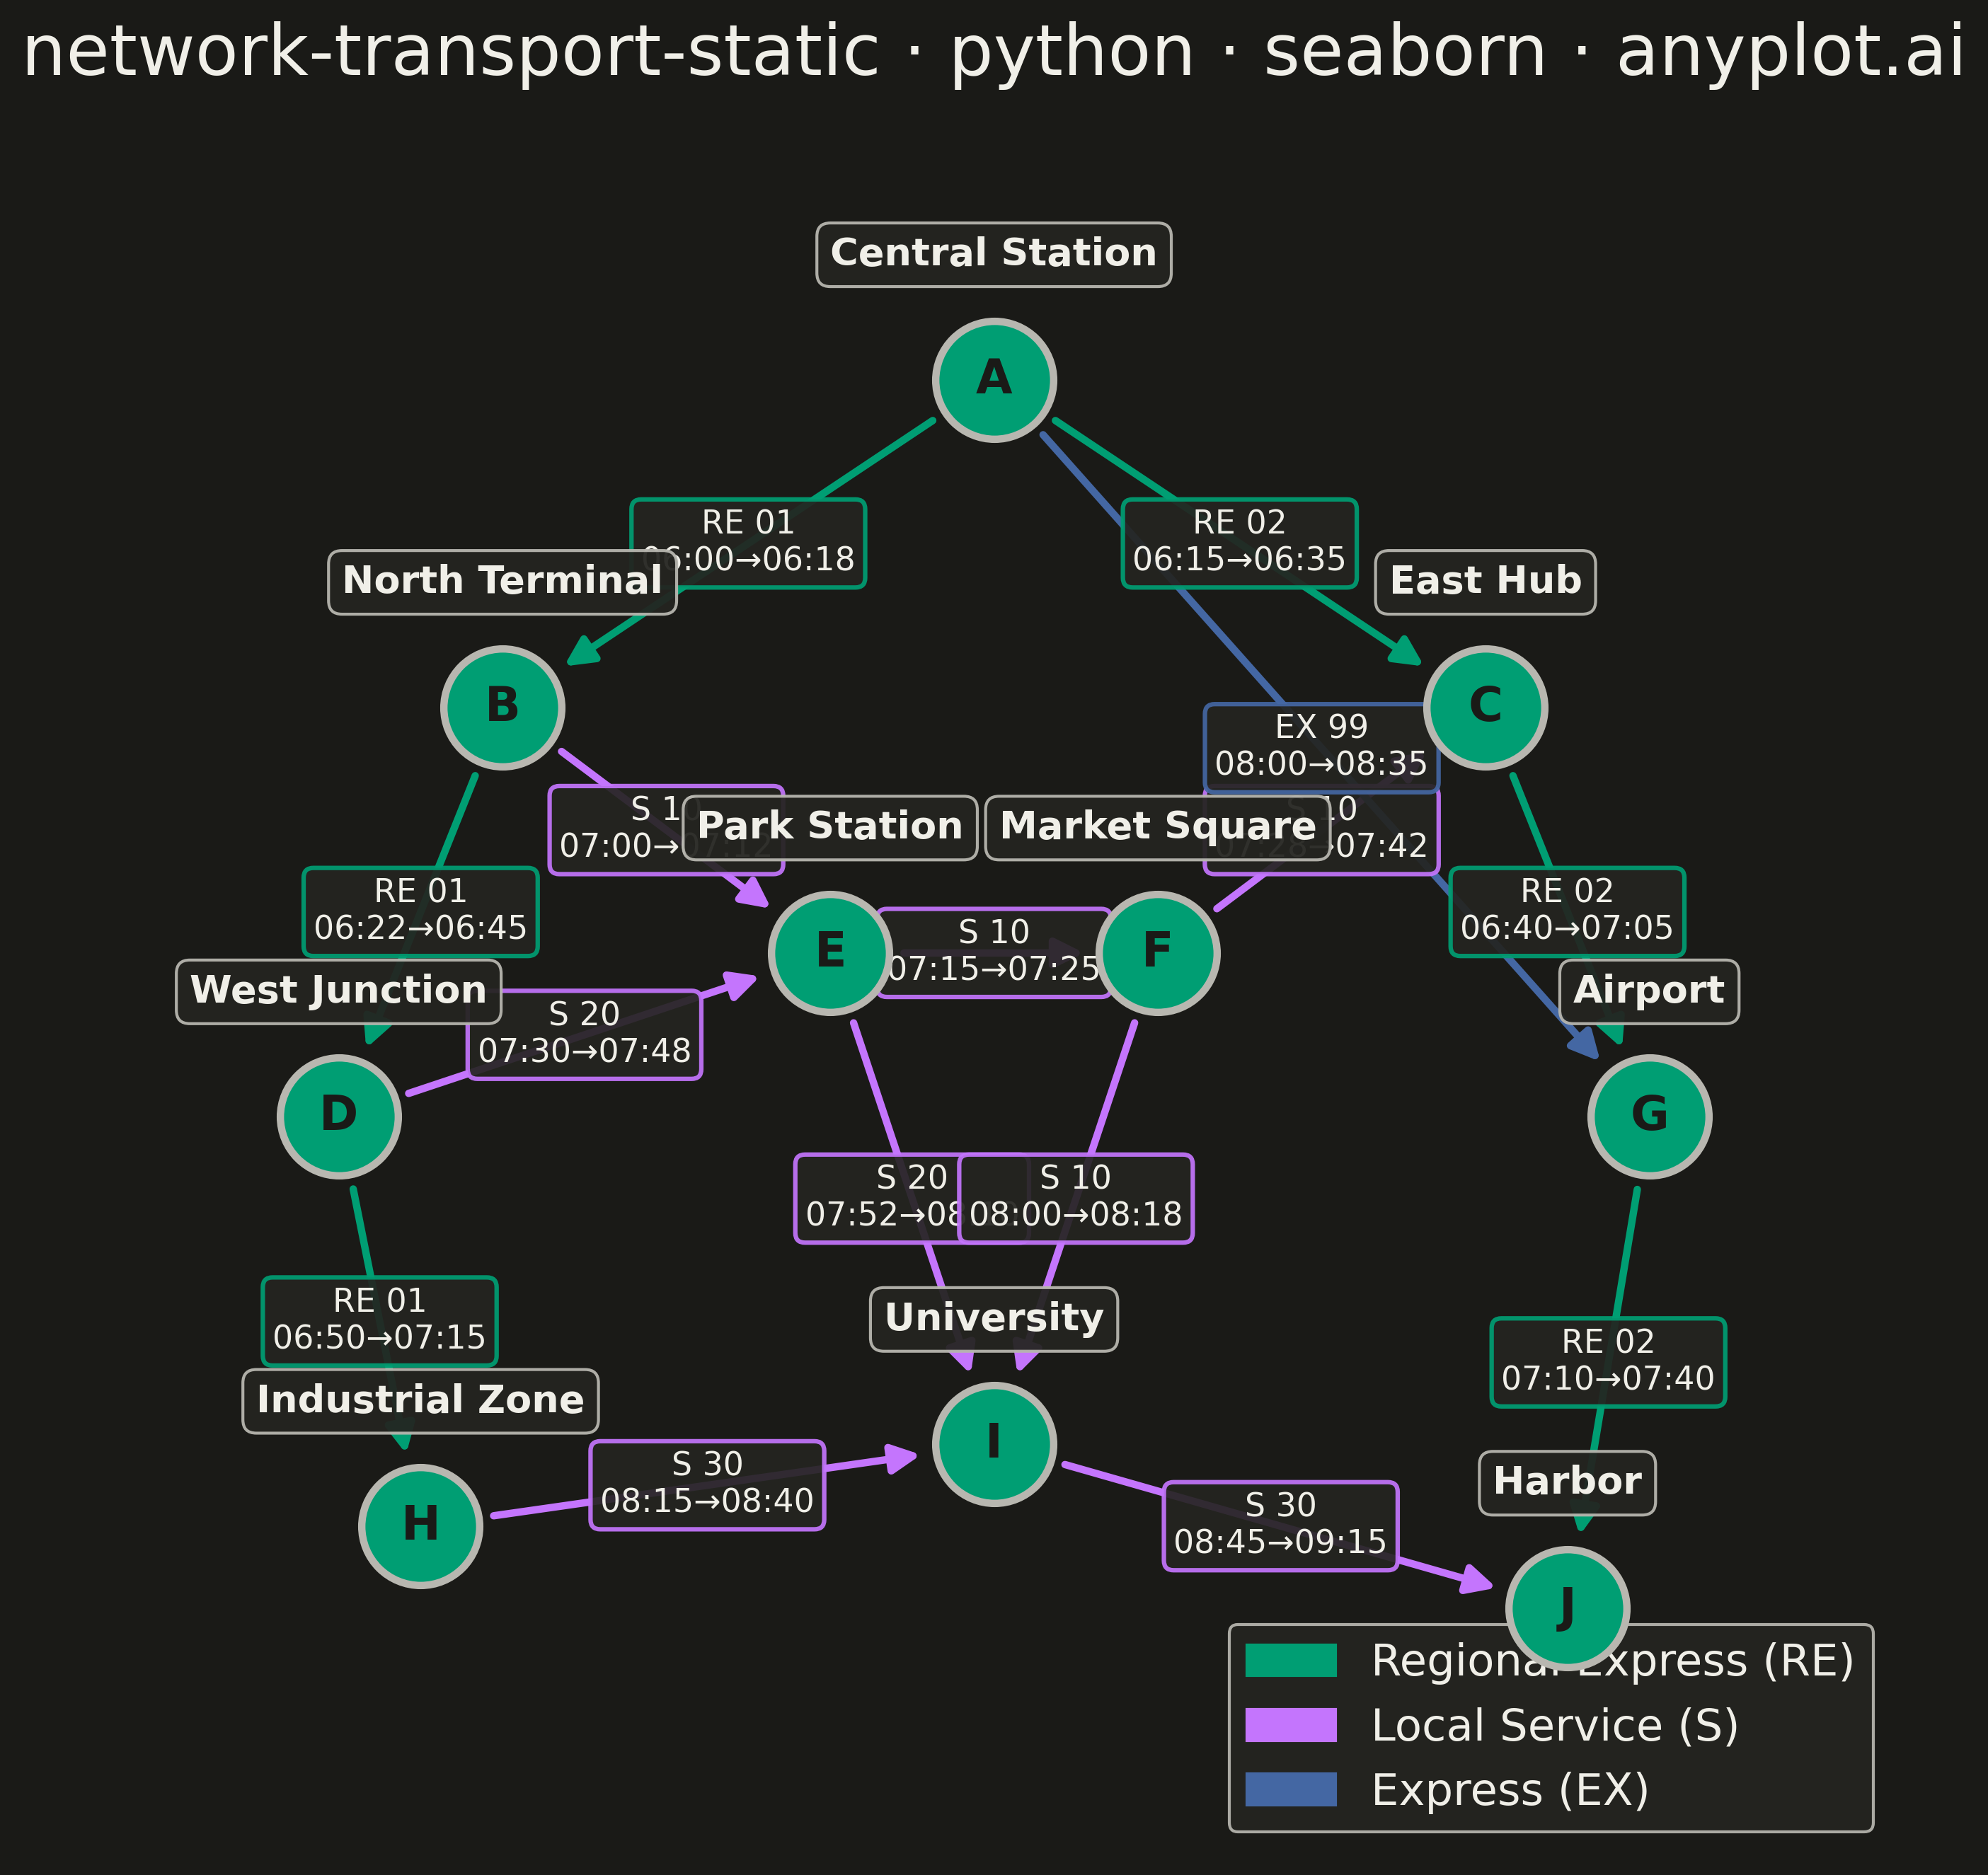
A directed network visualization for transportation systems where stations are displayed as labeled nodes and train/bus routes as directed edges. Edges display departure times, arrival times, and route identifiers. Designed for visualizing timetables, route maps, and connection patterns in rail, bus, or flight networks. This static version focuses on clear, readable presentation without interactive repositioning.
""" anyplot.ai
network-transport-static: Static Transport Network Diagram
Library: seaborn 0.13.2 | Python 3.13.13
Quality: 92/100 | Updated: 2026-05-18
"""

import os

import matplotlib.patches as mpatches
import matplotlib.pyplot as plt
import numpy as np
import seaborn as sns


THEME = os.getenv("ANYPLOT_THEME", "light")
PAGE_BG = "#FAF8F1" if THEME == "light" else "#1A1A17"
ELEVATED_BG = "#FFFDF6" if THEME == "light" else "#242420"
INK = "#1A1A17" if THEME == "light" else "#F0EFE8"
INK_SOFT = "#4A4A44" if THEME == "light" else "#B8B7B0"

# Okabe-Ito palette (positions 1-3 for route types)
IMPRINT = ["#009E73", "#C475FD", "#4467A3"]

# Set seaborn style with theme-adaptive colors
sns.set_theme(
    style="white",
    rc={
        "figure.facecolor": PAGE_BG,
        "axes.facecolor": PAGE_BG,
        "axes.edgecolor": INK_SOFT,
        "text.color": INK,
        "xtick.color": INK_SOFT,
        "ytick.color": INK_SOFT,
        "grid.color": INK_SOFT,
        "grid.alpha": 0.10,
        "legend.facecolor": ELEVATED_BG,
        "legend.edgecolor": INK_SOFT,
    },
)

# Station data with coordinates
stations = [
    {"id": "A", "label": "Central Station", "x": 0.5, "y": 0.9},
    {"id": "B", "label": "North Terminal", "x": 0.2, "y": 0.7},
    {"id": "C", "label": "East Hub", "x": 0.8, "y": 0.7},
    {"id": "D", "label": "West Junction", "x": 0.1, "y": 0.45},
    {"id": "E", "label": "Park Station", "x": 0.4, "y": 0.55},
    {"id": "F", "label": "Market Square", "x": 0.6, "y": 0.55},
    {"id": "G", "label": "Airport", "x": 0.9, "y": 0.45},
    {"id": "H", "label": "Industrial Zone", "x": 0.15, "y": 0.2},
    {"id": "I", "label": "University", "x": 0.5, "y": 0.25},
    {"id": "J", "label": "Harbor", "x": 0.85, "y": 0.15},
]

# Route data - directed edges with times and route IDs
routes = [
    {"source": "A", "target": "B", "route_id": "RE 01", "dep": "06:00", "arr": "06:18", "type": "regional"},
    {"source": "A", "target": "C", "route_id": "RE 02", "dep": "06:15", "arr": "06:35", "type": "regional"},
    {"source": "B", "target": "D", "route_id": "RE 01", "dep": "06:22", "arr": "06:45", "type": "regional"},
    {"source": "C", "target": "G", "route_id": "RE 02", "dep": "06:40", "arr": "07:05", "type": "regional"},
    {"source": "D", "target": "H", "route_id": "RE 01", "dep": "06:50", "arr": "07:15", "type": "regional"},
    {"source": "G", "target": "J", "route_id": "RE 02", "dep": "07:10", "arr": "07:40", "type": "regional"},
    {"source": "B", "target": "E", "route_id": "S 10", "dep": "07:00", "arr": "07:12", "type": "local"},
    {"source": "E", "target": "F", "route_id": "S 10", "dep": "07:15", "arr": "07:25", "type": "local"},
    {"source": "F", "target": "C", "route_id": "S 10", "dep": "07:28", "arr": "07:42", "type": "local"},
    {"source": "D", "target": "E", "route_id": "S 20", "dep": "07:30", "arr": "07:48", "type": "local"},
    {"source": "E", "target": "I", "route_id": "S 20", "dep": "07:52", "arr": "08:10", "type": "local"},
    {"source": "F", "target": "I", "route_id": "S 10", "dep": "08:00", "arr": "08:18", "type": "local"},
    {"source": "A", "target": "G", "route_id": "EX 99", "dep": "08:00", "arr": "08:35", "type": "express"},
    {"source": "H", "target": "I", "route_id": "S 30", "dep": "08:15", "arr": "08:40", "type": "local"},
    {"source": "I", "target": "J", "route_id": "S 30", "dep": "08:45", "arr": "09:15", "type": "local"},
]

# Create lookup for station positions
station_pos = {s["id"]: (s["x"], s["y"]) for s in stations}

# Color mapping for route types using Okabe-Ito palette
route_colors = {
    "regional": IMPRINT[0],  # #009E73 - brand green
    "local": IMPRINT[1],  # #C475FD - vermillion
    "express": IMPRINT[2],  # #4467A3 - blue
}

# Create figure
fig, ax = plt.subplots(figsize=(16, 9), facecolor=PAGE_BG)
ax.set_facecolor(PAGE_BG)

# Draw edges (routes) first so nodes appear on top
edge_counter = {}  # Track edges between same station pairs for offset

for route in routes:
    src = route["source"]
    tgt = route["target"]
    x1, y1 = station_pos[src]
    x2, y2 = station_pos[tgt]

    # Track edge count for parallel routes
    edge_key = tuple(sorted([src, tgt]))
    edge_counter[edge_key] = edge_counter.get(edge_key, 0) + 1
    offset = (edge_counter[edge_key] - 1) * 0.025

    # Calculate perpendicular offset for parallel routes
    dx = x2 - x1
    dy = y2 - y1
    length = np.sqrt(dx**2 + dy**2)
    if length > 0:
        perp_x = -dy / length * offset
        perp_y = dx / length * offset
    else:
        perp_x, perp_y = 0, 0

    # Apply offset
    x1_off, y1_off = x1 + perp_x, y1 + perp_y
    x2_off, y2_off = x2 + perp_x, y2 + perp_y

    color = route_colors[route["type"]]

    # Draw arrow
    ax.annotate(
        "",
        xy=(x2_off, y2_off),
        xytext=(x1_off, y1_off),
        arrowprops={"arrowstyle": "-|>", "color": color, "lw": 2.5, "shrinkA": 25, "shrinkB": 25, "mutation_scale": 20},
    )

    # Edge label position (middle of edge)
    mid_x = (x1_off + x2_off) / 2
    mid_y = (y1_off + y2_off) / 2

    # Create edge label
    label_text = f"{route['route_id']}\n{route['dep']}→{route['arr']}"

    # Add label with background
    ax.text(
        mid_x,
        mid_y,
        label_text,
        fontsize=11,
        ha="center",
        va="center",
        bbox={
            "boxstyle": "round,pad=0.3",
            "facecolor": ELEVATED_BG,
            "edgecolor": color,
            "alpha": 0.92,
            "linewidth": 1.5,
        },
        color=INK,
        zorder=5,
    )

# Draw station nodes
station_x = [s["x"] for s in stations]
station_y = [s["y"] for s in stations]

# Use seaborn scatterplot for nodes with Okabe-Ito brand green
sns.scatterplot(
    x=station_x,
    y=station_y,
    s=1600,
    color=IMPRINT[0],
    edgecolor=INK_SOFT,
    linewidth=2.5,
    ax=ax,
    zorder=10,
    legend=False,
)

# Add station labels and IDs
for s in stations:
    # Station label above node
    ax.text(
        s["x"],
        s["y"] + 0.065,
        s["label"],
        fontsize=13,
        fontweight="bold",
        ha="center",
        va="bottom",
        color=INK,
        bbox={
            "boxstyle": "round,pad=0.35",
            "facecolor": ELEVATED_BG,
            "edgecolor": INK_SOFT,
            "alpha": 0.94,
            "linewidth": 1,
        },
        zorder=11,
    )
    # Station ID inside node
    ax.text(s["x"], s["y"], s["id"], fontsize=16, fontweight="bold", color=PAGE_BG, ha="center", va="center", zorder=11)

# Create legend
legend_handles = [
    mpatches.Patch(color=IMPRINT[0], label="Regional Express (RE)"),
    mpatches.Patch(color=IMPRINT[1], label="Local Service (S)"),
    mpatches.Patch(color=IMPRINT[2], label="Express (EX)"),
]
ax.legend(handles=legend_handles, loc="lower right", fontsize=15, framealpha=0.92, edgecolor=INK_SOFT)

# Styling
ax.set_xlim(-0.05, 1.05)
ax.set_ylim(0.0, 1.05)
ax.set_aspect("equal")
ax.axis("off")

# Title
ax.set_title(
    "network-transport-static · python · seaborn · anyplot.ai", fontsize=24, fontweight="medium", color=INK, pad=20
)

plt.tight_layout()
plt.savefig(f"plot-{THEME}.png", dpi=300, bbox_inches="tight", facecolor=PAGE_BG)
Runnable source as JSON, for any HTTP client: https://api.anyplot.ai/specs/network-transport-static/seaborn/code. Any spec id and library id listed in llms-full.txt fit the same URL shape; every URL below is complete and callable.
{
  "spec_id": "network-transport-static",
  "language": "python",
  "library": "seaborn",
  "page": "https://anyplot.ai/network-transport-static/python/seaborn",
  "hub": "https://anyplot.ai/network-transport-static",
  "code_json": "https://api.anyplot.ai/specs/network-transport-static/seaborn/code",
  "spec_json": "https://api.anyplot.ai/specs/network-transport-static",
  "render_light_png": "https://storage.googleapis.com/anyplot-images/plots/network-transport-static/python/seaborn/plot-light.png",
  "render_dark_png": "https://storage.googleapis.com/anyplot-images/plots/network-transport-static/python/seaborn/plot-dark.png",
  "quality_score": 92.0,
  "license": "MIT",
  "guide": "https://anyplot.ai/llms.txt"
}
Part of Static Transport Network Diagram on anyplot.ai.