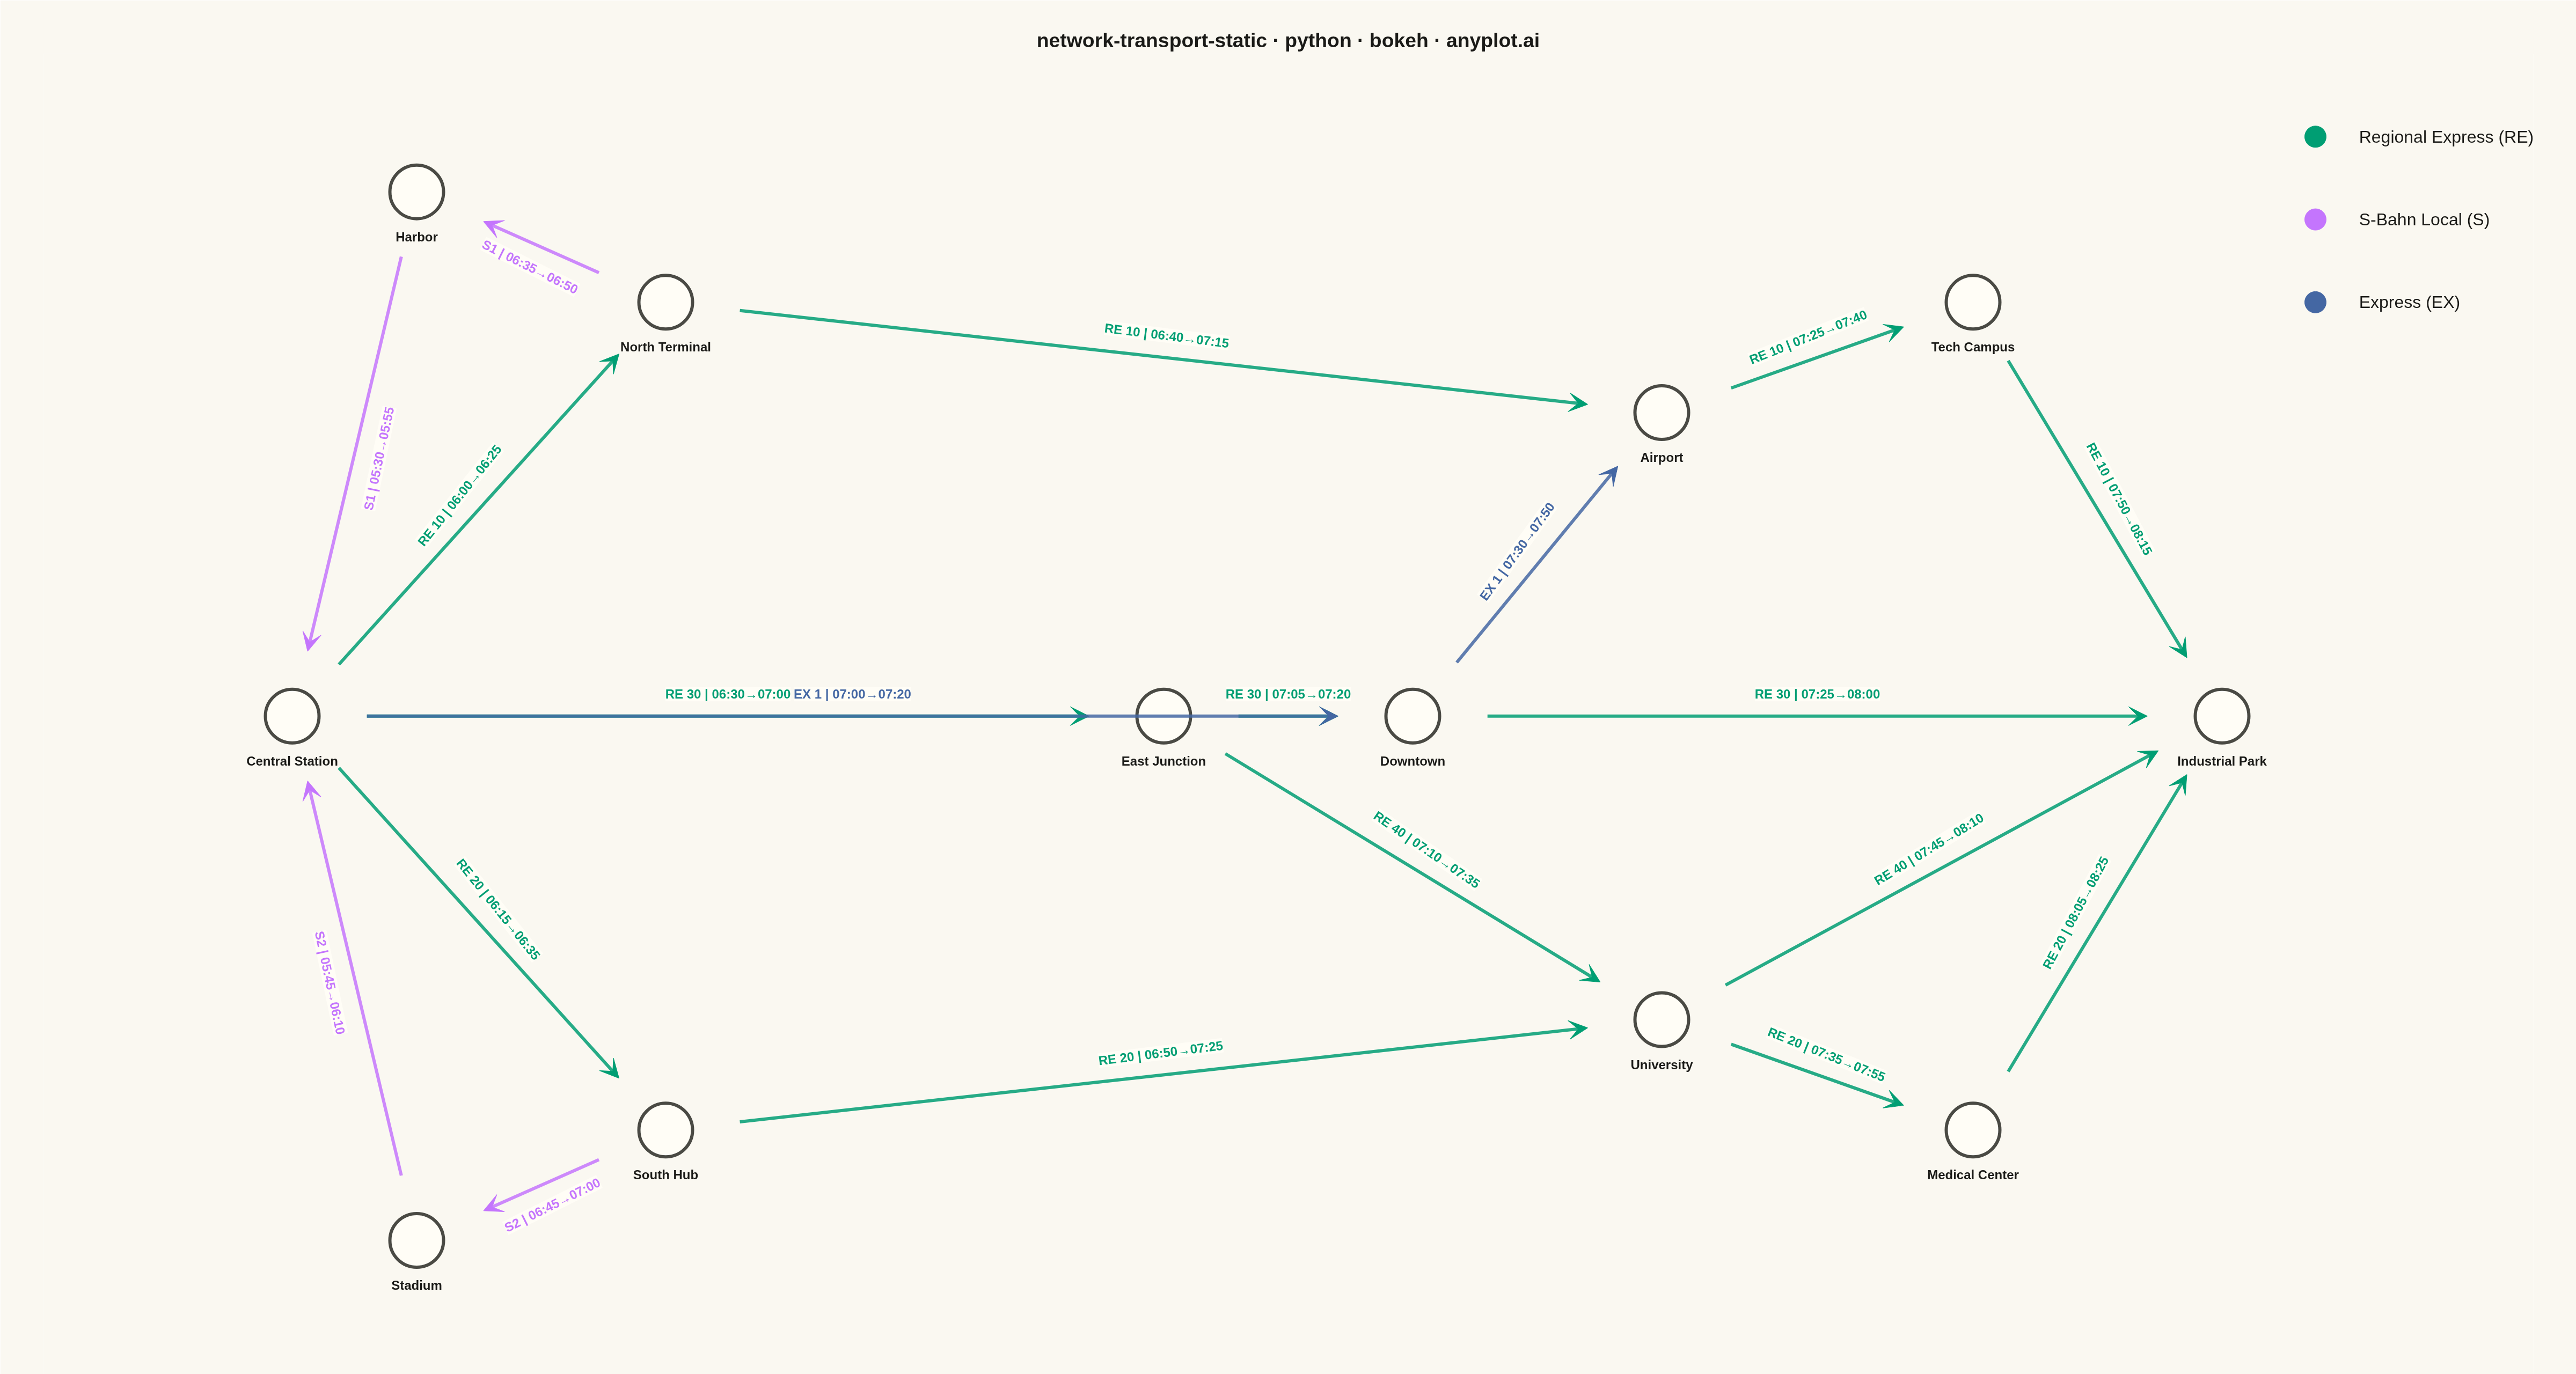
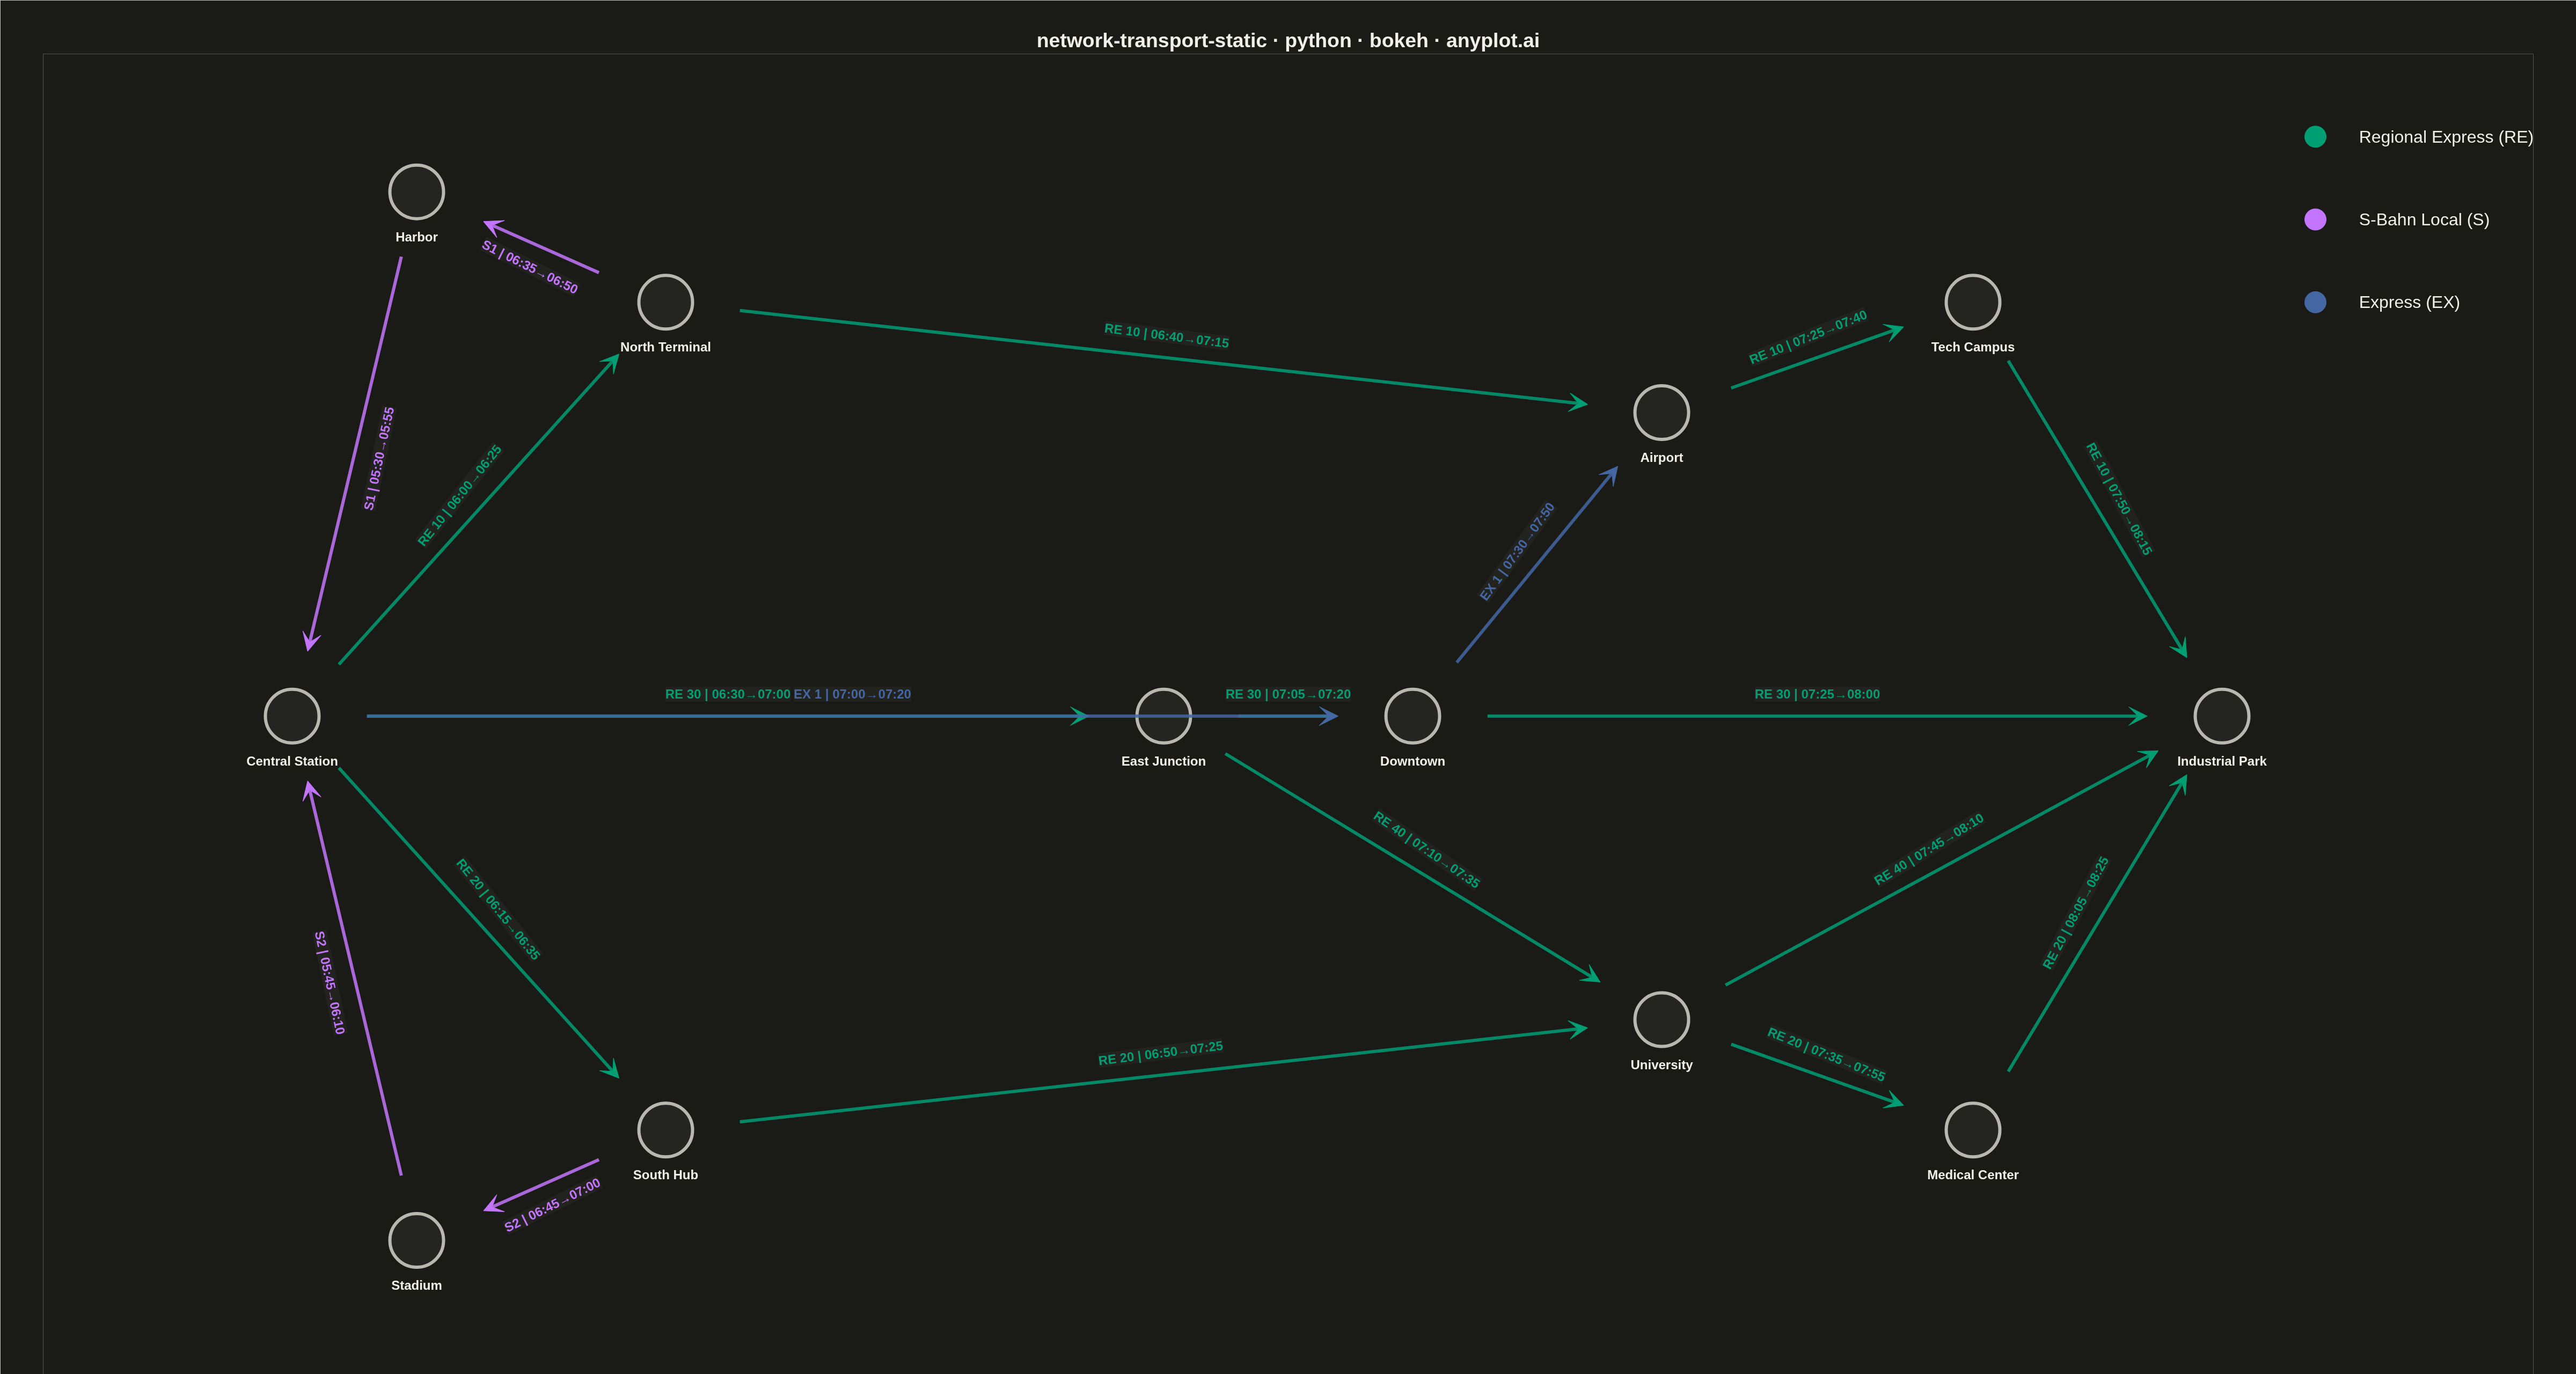
A directed network visualization for transportation systems where stations are displayed as labeled nodes and train/bus routes as directed edges. Edges display departure times, arrival times, and route identifiers. Designed for visualizing timetables, route maps, and connection patterns in rail, bus, or flight networks. This static version focuses on clear, readable presentation without interactive repositioning.
""" anyplot.ai
network-transport-static: Static Transport Network Diagram
Library: bokeh 3.9.0 | Python 3.13.13
Quality: 95/100 | Updated: 2026-05-18
"""

import os
import sys
import time
from pathlib import Path


# Remove the current directory from sys.path to avoid circular imports with bokeh.py
sys.path = [p for p in sys.path if p not in ("", ".", os.getcwd(), os.path.dirname(__file__))]

import numpy as np
from bokeh.io import output_file, save
from bokeh.models import Arrow, ColumnDataSource, Label, LabelSet, VeeHead
from bokeh.plotting import figure
from selenium import webdriver
from selenium.webdriver.chrome.options import Options


# Theme tokens
THEME = os.getenv("ANYPLOT_THEME", "light")
PAGE_BG = "#FAF8F1" if THEME == "light" else "#1A1A17"
ELEVATED_BG = "#FFFDF6" if THEME == "light" else "#242420"
INK = "#1A1A17" if THEME == "light" else "#F0EFE8"
INK_SOFT = "#4A4A44" if THEME == "light" else "#B8B7B0"

# Okabe-Ito palette - first series is always #009E73
IMPRINT = ["#009E73", "#C475FD", "#4467A3", "#BD8233", "#AE3030", "#2ABCCD", "#954477"]

np.random.seed(42)

# Data: Regional rail network with stations and routes
# Scaled coordinates for 4800x2700 canvas with margins
stations = [
    {"id": "A", "label": "Central Station", "x": 500, "y": 1350},
    {"id": "B", "label": "North Terminal", "x": 1100, "y": 2100},
    {"id": "C", "label": "East Junction", "x": 1900, "y": 1350},
    {"id": "D", "label": "South Hub", "x": 1100, "y": 600},
    {"id": "E", "label": "Airport", "x": 2700, "y": 1900},
    {"id": "F", "label": "University", "x": 2700, "y": 800},
    {"id": "G", "label": "Industrial Park", "x": 3600, "y": 1350},
    {"id": "H", "label": "Harbor", "x": 700, "y": 2300},
    {"id": "I", "label": "Stadium", "x": 700, "y": 400},
    {"id": "J", "label": "Tech Campus", "x": 3200, "y": 2100},
    {"id": "K", "label": "Medical Center", "x": 3200, "y": 600},
    {"id": "L", "label": "Downtown", "x": 2300, "y": 1350},
]

station_lookup = {s["id"]: s for s in stations}

# Routes: Train services with departure and arrival times
routes = [
    {"source_id": "A", "target_id": "B", "route_id": "RE 10", "departure_time": "06:00", "arrival_time": "06:25"},
    {"source_id": "A", "target_id": "D", "route_id": "RE 20", "departure_time": "06:15", "arrival_time": "06:35"},
    {"source_id": "A", "target_id": "C", "route_id": "RE 30", "departure_time": "06:30", "arrival_time": "07:00"},
    {"source_id": "B", "target_id": "H", "route_id": "S1", "departure_time": "06:35", "arrival_time": "06:50"},
    {"source_id": "B", "target_id": "E", "route_id": "RE 10", "departure_time": "06:40", "arrival_time": "07:15"},
    {"source_id": "C", "target_id": "L", "route_id": "RE 30", "departure_time": "07:05", "arrival_time": "07:20"},
    {"source_id": "C", "target_id": "F", "route_id": "RE 40", "departure_time": "07:10", "arrival_time": "07:35"},
    {"source_id": "D", "target_id": "I", "route_id": "S2", "departure_time": "06:45", "arrival_time": "07:00"},
    {"source_id": "D", "target_id": "F", "route_id": "RE 20", "departure_time": "06:50", "arrival_time": "07:25"},
    {"source_id": "E", "target_id": "J", "route_id": "RE 10", "departure_time": "07:25", "arrival_time": "07:40"},
    {"source_id": "F", "target_id": "G", "route_id": "RE 40", "departure_time": "07:45", "arrival_time": "08:10"},
    {"source_id": "F", "target_id": "K", "route_id": "RE 20", "departure_time": "07:35", "arrival_time": "07:55"},
    {"source_id": "L", "target_id": "E", "route_id": "EX 1", "departure_time": "07:30", "arrival_time": "07:50"},
    {"source_id": "L", "target_id": "G", "route_id": "RE 30", "departure_time": "07:25", "arrival_time": "08:00"},
    {"source_id": "J", "target_id": "G", "route_id": "RE 10", "departure_time": "07:50", "arrival_time": "08:15"},
    {"source_id": "K", "target_id": "G", "route_id": "RE 20", "departure_time": "08:05", "arrival_time": "08:25"},
    {"source_id": "A", "target_id": "L", "route_id": "EX 1", "departure_time": "07:00", "arrival_time": "07:20"},
    {"source_id": "H", "target_id": "A", "route_id": "S1", "departure_time": "05:30", "arrival_time": "05:55"},
    {"source_id": "I", "target_id": "A", "route_id": "S2", "departure_time": "05:45", "arrival_time": "06:10"},
]

# Create figure
p = figure(
    width=4800,
    height=2700,
    title="network-transport-static · python · bokeh · anyplot.ai",
    x_range=(100, 4100),
    y_range=(100, 2550),
    tools="",
    toolbar_location=None,
)

# Style the figure - scaled for 4800x2700 canvas with theme-adaptive colors
p.title.text_font_size = "28pt"
p.title.text_color = INK
p.title.align = "center"
p.xgrid.visible = False
p.ygrid.visible = False
p.xaxis.visible = False
p.yaxis.visible = False
p.outline_line_color = None
p.background_fill_color = PAGE_BG
p.border_fill_color = PAGE_BG
p.min_border_left = 80
p.min_border_right = 80
p.min_border_top = 100
p.min_border_bottom = 80

# Draw routes as arrows with labels
for route in routes:
    src = station_lookup[route["source_id"]]
    tgt = station_lookup[route["target_id"]]

    # Calculate direction vector
    dx = tgt["x"] - src["x"]
    dy = tgt["y"] - src["y"]
    length = np.sqrt(dx**2 + dy**2)

    # Normalize direction
    if length > 0:
        nx, ny = dx / length, dy / length
    else:
        nx, ny = 0, 0

    # Offset for multiple routes between same stations (perpendicular offset)
    # Find how many routes share this pair
    pair_key = tuple(sorted([route["source_id"], route["target_id"]]))
    same_pair_routes = [r for r in routes if tuple(sorted([r["source_id"], r["target_id"]])) == pair_key]
    pair_index = same_pair_routes.index(route)
    num_routes = len(same_pair_routes)

    # Perpendicular vector
    perp_x, perp_y = -ny, nx
    offset_amount = (pair_index - (num_routes - 1) / 2) * 80

    # Start and end points with offset and shortened to not overlap nodes
    node_radius = 120
    start_x = src["x"] + nx * node_radius + perp_x * offset_amount
    start_y = src["y"] + ny * node_radius + perp_y * offset_amount
    end_x = tgt["x"] - nx * node_radius + perp_x * offset_amount
    end_y = tgt["y"] - ny * node_radius + perp_y * offset_amount

    route_id = route["route_id"]
    if route_id.startswith("RE"):
        color = IMPRINT[0]
    elif route_id.startswith("S"):
        color = IMPRINT[1]
    elif route_id.startswith("EX"):
        color = IMPRINT[2]
    else:
        color = IMPRINT[3]

    # Draw arrow - scaled for large canvas
    p.add_layout(
        Arrow(
            end=VeeHead(size=35, fill_color=color, line_color=color),
            x_start=start_x,
            y_start=start_y,
            x_end=end_x,
            y_end=end_y,
            line_color=color,
            line_width=6,
            line_alpha=0.85,
        )
    )

    # Route label at midpoint
    mid_x = (start_x + end_x) / 2 + perp_x * 40
    mid_y = (start_y + end_y) / 2 + perp_y * 40

    label_text = f"{route['route_id']} | {route['departure_time']}→{route['arrival_time']}"

    # Calculate angle for label rotation
    angle = np.arctan2(dy, dx)
    if angle > np.pi / 2:
        angle -= np.pi
    elif angle < -np.pi / 2:
        angle += np.pi

    p.add_layout(
        Label(
            x=mid_x,
            y=mid_y,
            text=label_text,
            text_font_size="18pt",
            text_color=color,
            text_font_style="bold",
            text_align="center",
            text_baseline="middle",
            angle=angle,
            background_fill_color=ELEVATED_BG,
            background_fill_alpha=0.9,
        )
    )

# Draw station nodes
station_x = [s["x"] for s in stations]
station_y = [s["y"] for s in stations]
station_labels = [s["label"] for s in stations]

station_source = ColumnDataSource(data={"x": station_x, "y": station_y, "label": station_labels})

# Draw station circles - larger for visibility
p.scatter(x="x", y="y", source=station_source, size=100, fill_color=ELEVATED_BG, line_color=INK_SOFT, line_width=6)

# Station labels - positioned below nodes for clarity
labels = LabelSet(
    x="x",
    y="y",
    text="label",
    source=station_source,
    text_font_size="18pt",
    text_font_style="bold",
    text_color=INK,
    text_align="center",
    text_baseline="top",
    y_offset=-70,
)
p.add_layout(labels)

# Add legend - positioned and scaled for large canvas
legend_x = 3750
legend_y = 2400
legend_items = [
    ("Regional Express (RE)", IMPRINT[0]),
    ("S-Bahn Local (S)", IMPRINT[1]),
    ("Express (EX)", IMPRINT[2]),
]

for i, (label, color) in enumerate(legend_items):
    y_pos = legend_y - i * 150
    p.scatter(x=[legend_x], y=[y_pos], size=40, fill_color=color, line_color=color)
    p.add_layout(
        Label(x=legend_x + 70, y=y_pos, text=label, text_font_size="24pt", text_color=INK, text_baseline="middle")
    )

# Save HTML
output_file(f"plot-{THEME}.html")
save(p)

# Screenshot with headless Chrome
W, H = 4800, 2700
opts = Options()
for arg in (
    "--headless=new",
    "--no-sandbox",
    "--disable-dev-shm-usage",
    "--disable-gpu",
    f"--window-size={W},{H}",
    "--hide-scrollbars",
):
    opts.add_argument(arg)
driver = webdriver.Chrome(options=opts)
driver.set_window_size(W, H)
driver.get(f"file://{Path(f'plot-{THEME}.html').resolve()}")
time.sleep(3)
driver.save_screenshot(f"plot-{THEME}.png")
driver.quit()
Runnable source as JSON, for any HTTP client: https://api.anyplot.ai/specs/network-transport-static/bokeh/code. Any spec id and library id listed in llms-full.txt fit the same URL shape; every URL below is complete and callable.
{
  "spec_id": "network-transport-static",
  "language": "python",
  "library": "bokeh",
  "page": "https://anyplot.ai/network-transport-static/python/bokeh",
  "hub": "https://anyplot.ai/network-transport-static",
  "code_json": "https://api.anyplot.ai/specs/network-transport-static/bokeh/code",
  "spec_json": "https://api.anyplot.ai/specs/network-transport-static",
  "render_light_png": "https://storage.googleapis.com/anyplot-images/plots/network-transport-static/python/bokeh/plot-light.png",
  "render_dark_png": "https://storage.googleapis.com/anyplot-images/plots/network-transport-static/python/bokeh/plot-dark.png",
  "interactive_light_html": "https://storage.googleapis.com/anyplot-images/plots/network-transport-static/python/bokeh/plot-light.html",
  "interactive_dark_html": "https://storage.googleapis.com/anyplot-images/plots/network-transport-static/python/bokeh/plot-dark.html",
  "quality_score": 95.0,
  "license": "MIT",
  "guide": "https://anyplot.ai/llms.txt"
}
Part of Static Transport Network Diagram on anyplot.ai.