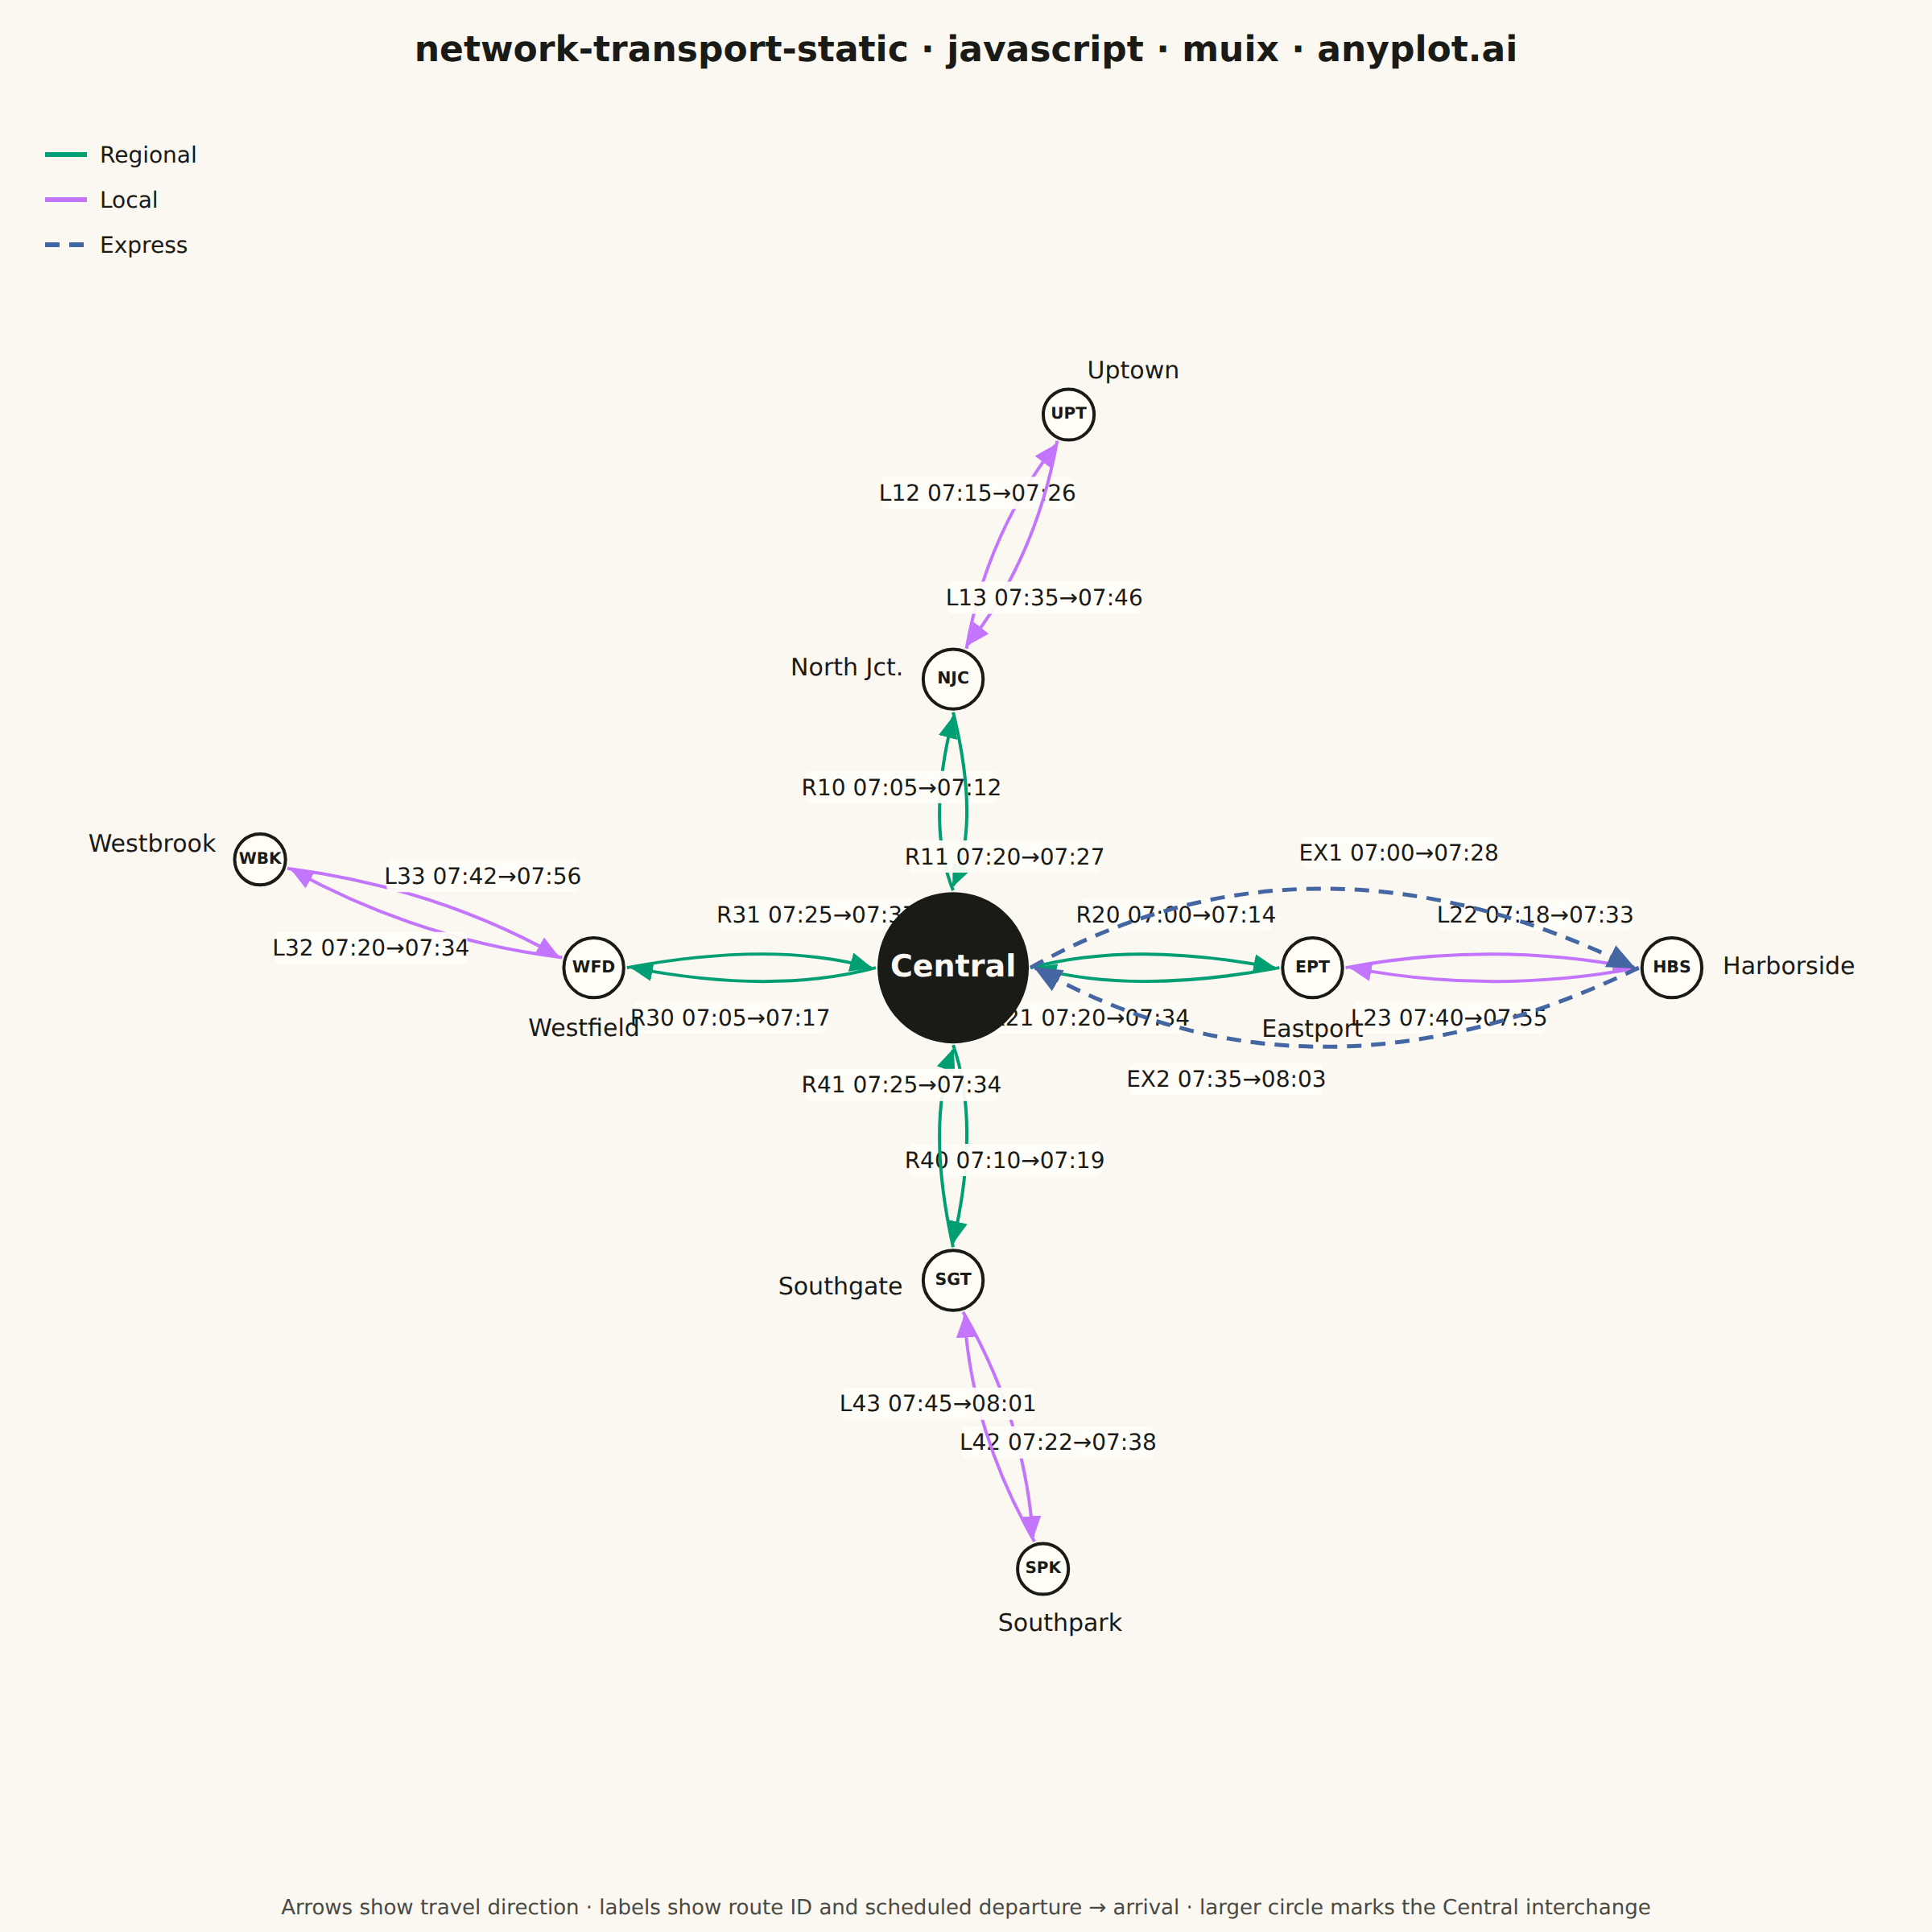
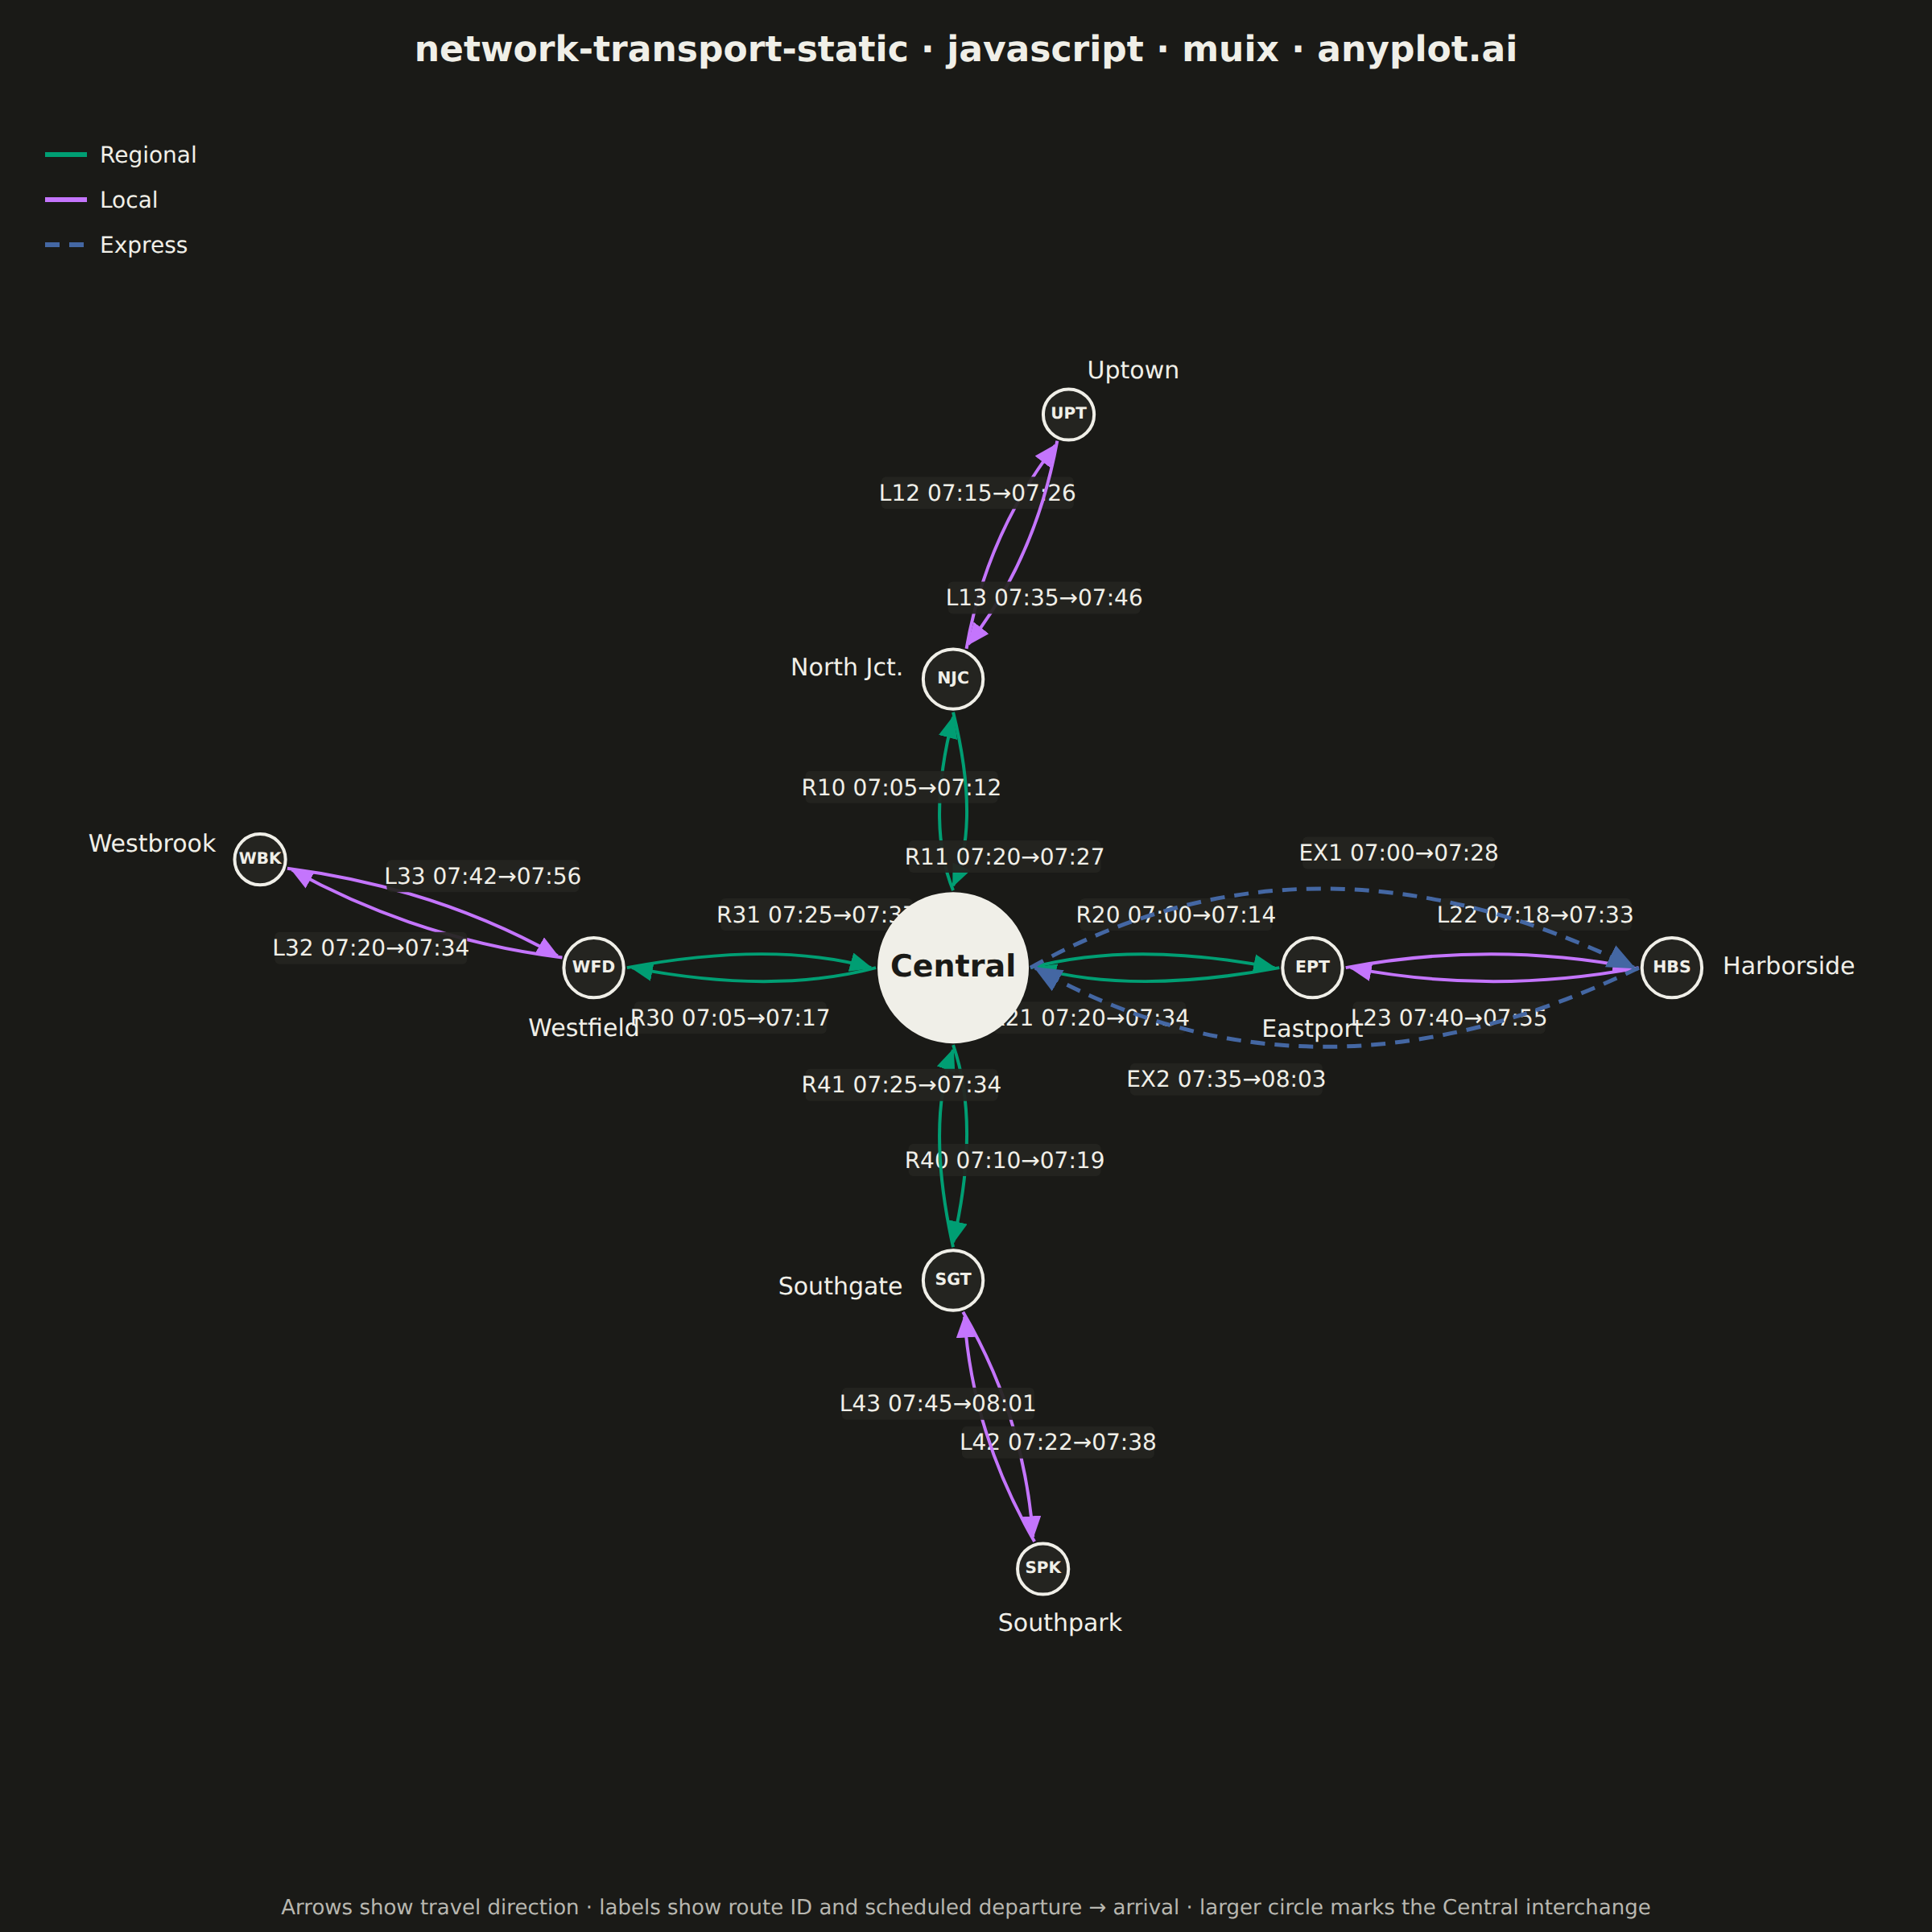
The same plot in 14 other libraries — JavaScript: Chart.js, D3.js, Apache ECharts, Highcharts; Python: Altair, Bokeh, lets-plot, Matplotlib, Plotly, plotnine, Pygal, Seaborn; R: ggplot2; Julia: Makie.jl. Compare all 15 side by side: Static Transport Network Diagram in Python, R, Julia and JavaScript.
A directed network visualization for transportation systems where stations are displayed as labeled nodes and train/bus routes as directed edges. Edges display departure times, arrival times, and route identifiers. Designed for visualizing timetables, route maps, and connection patterns in rail, bus, or flight networks. This static version focuses on clear, readable presentation without interactive repositioning.
// anyplot.ai
// network-transport-static: Static Transport Network Diagram
// Library: muix 7.29.1 | JavaScript 22.23.2
// Quality: 87/100 | Created: 2026-09-02
//# anyplot-orientation: square
// anyplot.ai
// network-transport-static: Static Transport Network Diagram
// Library: MUI X Charts | React | Node 22
// License: @mui/x-charts — MIT (community). Pro/Premium are out of scope.
// Quality: pending | Created: 2026-09-02

import { ChartContainer } from "@mui/x-charts/ChartContainer";
import { useXScale, useYScale } from "@mui/x-charts/hooks";

const t = window.ANYPLOT_TOKENS;
const FONT = "Inter, system-ui, -apple-system, sans-serif";

// --- Data: a regional commuter-rail network — four branches radiating from a
// Central interchange, plus a limited-stop express to the coast. --------------
const STATIONS = [
  { id: "CTR", label: "Central", x: 0, y: 0 },
  { id: "NJC", label: "North Jct.", x: 0, y: 2.4 },
  { id: "UPT", label: "Uptown", x: 0.9, y: 4.6 },
  { id: "EPT", label: "Eastport", x: 2.8, y: 0 },
  { id: "HBS", label: "Harborside", x: 5.6, y: 0 },
  { id: "WFD", label: "Westfield", x: -2.8, y: 0 },
  { id: "WBK", label: "Westbrook", x: -5.4, y: 0.9 },
  { id: "SGT", label: "Southgate", x: 0, y: -2.6 },
  { id: "SPK", label: "Southpark", x: 0.7, y: -5.0 },
];

const TYPES = ["Regional", "Local", "Express"];
const TYPE_COLOR = {
  Regional: t.palette[0],
  Local: t.palette[1],
  Express: t.palette[2],
};

// Trunk segments (touching the Central interchange) run both directions.
// Branch-tip segments run both directions too. The Harborside express skips
// Eastport entirely, so it is drawn as a bowed arc rather than a straight edge.
const ROUTES = [
  { source_id: "CTR", target_id: "NJC", route_id: "R10", departure_time: "07:05", arrival_time: "07:12", type: "Regional" },
  { source_id: "NJC", target_id: "CTR", route_id: "R11", departure_time: "07:20", arrival_time: "07:27", type: "Regional" },
  { source_id: "CTR", target_id: "EPT", route_id: "R20", departure_time: "07:00", arrival_time: "07:14", type: "Regional" },
  { source_id: "EPT", target_id: "CTR", route_id: "R21", departure_time: "07:20", arrival_time: "07:34", type: "Regional" },
  { source_id: "CTR", target_id: "WFD", route_id: "R30", departure_time: "07:05", arrival_time: "07:17", type: "Regional" },
  { source_id: "WFD", target_id: "CTR", route_id: "R31", departure_time: "07:25", arrival_time: "07:37", type: "Regional" },
  { source_id: "CTR", target_id: "SGT", route_id: "R40", departure_time: "07:10", arrival_time: "07:19", type: "Regional" },
  { source_id: "SGT", target_id: "CTR", route_id: "R41", departure_time: "07:25", arrival_time: "07:34", type: "Regional" },
  { source_id: "NJC", target_id: "UPT", route_id: "L12", departure_time: "07:15", arrival_time: "07:26", type: "Local" },
  { source_id: "UPT", target_id: "NJC", route_id: "L13", departure_time: "07:35", arrival_time: "07:46", type: "Local" },
  { source_id: "EPT", target_id: "HBS", route_id: "L22", departure_time: "07:18", arrival_time: "07:33", type: "Local" },
  { source_id: "HBS", target_id: "EPT", route_id: "L23", departure_time: "07:40", arrival_time: "07:55", type: "Local" },
  { source_id: "WFD", target_id: "WBK", route_id: "L32", departure_time: "07:20", arrival_time: "07:34", type: "Local" },
  { source_id: "WBK", target_id: "WFD", route_id: "L33", departure_time: "07:42", arrival_time: "07:56", type: "Local" },
  { source_id: "SGT", target_id: "SPK", route_id: "L42", departure_time: "07:22", arrival_time: "07:38", type: "Local" },
  { source_id: "SPK", target_id: "SGT", route_id: "L43", departure_time: "07:45", arrival_time: "08:01", type: "Local" },
  { source_id: "CTR", target_id: "HBS", route_id: "EX1", departure_time: "07:00", arrival_time: "07:28", type: "Express" },
  { source_id: "HBS", target_id: "CTR", route_id: "EX2", departure_time: "07:35", arrival_time: "08:03", type: "Express" },
];

const DEGREE = {};
STATIONS.forEach((s) => (DEGREE[s.id] = 0));
ROUTES.forEach((r) => {
  DEGREE[r.source_id] += 1;
  DEGREE[r.target_id] += 1;
});

function nodeRadius(id) {
  // The Central interchange is drawn larger, with its full name inside the
  // circle instead of an external label — see Stations().
  if (id === "CTR") return 46;
  return 13 + DEGREE[id] * 1.4;
}

// --- Square-friendly domain: bounding box of station coordinates, padded ----
const xs = STATIONS.map((s) => s.x);
const ys = STATIONS.map((s) => s.y);
const minX = Math.min(...xs);
const maxX = Math.max(...xs);
const minY = Math.min(...ys);
const maxY = Math.max(...ys);
const centerX = (minX + maxX) / 2;
const centerY = (minY + maxY) / 2;
const halfSpan = (Math.max(maxX - minX, maxY - minY) / 2) * 1.3;
const X_DOMAIN = [centerX - halfSpan, centerX + halfSpan];
const Y_DOMAIN = [centerY - halfSpan, centerY + halfSpan];

const stationById = Object.fromEntries(STATIONS.map((s) => [s.id, s]));

// --- Custom marks — drawn on the MUI X coordinate system --------------------
// Directed edges as quadratic-bezier curves: opposite-direction services on
// the same corridor bow to opposite sides (parallel offset), and the
// skip-stop express bows well clear of the Eastport node it passes over.
function RouteEdges() {
  const xScale = useXScale();
  const yScale = useYScale();

  return (
    <g fontFamily={FONT}>
      <defs>
        {TYPES.map((type) => (
          <marker
            key={type}
            id={`arrow-${type}`}
            markerWidth="9"
            markerHeight="9"
            refX="6.5"
            refY="3"
            orient="auto"
          >
            <path d="M0,0 L7,3 L0,6 Z" fill={TYPE_COLOR[type]} />
          </marker>
        ))}
      </defs>
      {ROUTES.map((route) => {
        const source = stationById[route.source_id];
        const target = stationById[route.target_id];
        const sx = xScale(source.x);
        const sy = yScale(source.y);
        const tx = xScale(target.x);
        const ty = yScale(target.y);
        const dx = tx - sx;
        const dy = ty - sy;
        const length = Math.hypot(dx, dy) || 1;

        // Perpendicular is derived from a *canonical* (sorted) pair direction,
        // not the route's own source→target direction — otherwise reversing
        // the route also flips the perpendicular, cancelling out the side
        // assignment below and stacking both directions on the same side.
        const [aId, bId] = route.source_id < route.target_id ? [route.source_id, route.target_id] : [route.target_id, route.source_id];
        const aPoint = { x: xScale(stationById[aId].x), y: yScale(stationById[aId].y) };
        const bPoint = { x: xScale(stationById[bId].x), y: yScale(stationById[bId].y) };
        const canonLength = Math.hypot(bPoint.x - aPoint.x, bPoint.y - aPoint.y) || 1;
        const perpX = -(bPoint.y - aPoint.y) / canonLength;
        const perpY = (bPoint.x - aPoint.x) / canonLength;
        const sign = route.source_id === aId ? -1 : 1;

        const isExpress = route.type === "Express";
        const offset = isExpress ? length * 0.22 : 17;
        const midX = (sx + tx) / 2 + perpX * offset * sign;
        const midY = (sy + ty) / 2 + perpY * offset * sign;

        // Pull the endpoints back to the node rims so arrowheads land on the
        // circle edge instead of under the fill.
        const sourceR = nodeRadius(route.source_id);
        const targetR = nodeRadius(route.target_id);
        const startX = sx + (dx / length) * (sourceR + 2);
        const startY = sy + (dy / length) * (sourceR + 2);
        const endX = tx - (dx / length) * (targetR + 5);
        const endY = ty - (dy / length) * (targetR + 5);

        const d = `M ${startX} ${startY} Q ${midX} ${midY} ${endX} ${endY}`;

        // Label sits ~60% along the curve, nudged further out — this keeps
        // it beside its own line, not on top of it.
        const lt = 0.62;
        const labelX =
          (1 - lt) ** 2 * sx + 2 * (1 - lt) * lt * midX + lt ** 2 * tx + perpX * 24 * sign;
        const labelY =
          (1 - lt) ** 2 * sy + 2 * (1 - lt) * lt * midY + lt ** 2 * ty + perpY * 24 * sign;
        const text = `${route.route_id} ${route.departure_time}→${route.arrival_time}`;
        const boxW = text.length * 7.3 + 10;
        const tooltip = `${route.route_id}: ${source.label} → ${target.label} (${route.departure_time} → ${route.arrival_time}, ${route.type})`;

        return (
          <g key={route.route_id}>
            <path
              d={d}
              fill="none"
              stroke={TYPE_COLOR[route.type]}
              strokeWidth={isExpress ? 2.5 : 2}
              strokeDasharray={isExpress ? "9 6" : undefined}
              markerEnd={`url(#arrow-${route.type})`}
            >
              <title>{tooltip}</title>
            </path>
            <rect
              x={labelX - boxW / 2}
              y={labelY - 11}
              width={boxW}
              height={20}
              rx={3}
              fill={t.elevatedBg}
              opacity={0.94}
            >
              <title>{tooltip}</title>
            </rect>
            <text x={labelX} y={labelY} fontSize={14} fill={t.ink} textAnchor="middle" dominantBaseline="middle">
              {text}
            </text>
          </g>
        );
      })}
    </g>
  );
}

// Each station's neighbors, deduplicated across both route directions — used
// to find the widest angular gap for label placement below.
const NEIGHBORS_BY_STATION = Object.fromEntries(
  STATIONS.map((station) => {
    const ids = new Set();
    ROUTES.forEach((route) => {
      if (route.source_id === station.id) ids.add(route.target_id);
      if (route.target_id === station.id) ids.add(route.source_id);
    });
    return [station.id, Array.from(ids)];
  }),
);

function Stations() {
  const xScale = useXScale();
  const yScale = useYScale();

  return (
    <g fontFamily={FONT}>
      {STATIONS.map((station) => {
        const isHub = station.id === "CTR";
        const cx = xScale(station.x);
        const cy = yScale(station.y);
        const r = nodeRadius(station.id);
        const fill = isHub ? t.ink : t.elevatedBg;
        const codeColor = isHub ? t.pageBg : t.ink;

        // The hub has 4 branches converging, so every direction around it is
        // already claimed by a route label — instead of fighting for an
        // external spot, the interchange is drawn larger with its full name
        // set inside the circle, the way transit maps mark major interchanges.
        if (isHub) {
          return (
            <g key={station.id}>
              <circle cx={cx} cy={cy} r={r} fill={fill} stroke={t.ink} strokeWidth={2}>
                <title>{`${station.label} — major interchange, ${DEGREE[station.id]} connecting routes`}</title>
              </circle>
              <text x={cx} y={cy} fontSize={19} fontWeight={600} fill={codeColor} textAnchor="middle" dominantBaseline="middle">
                {station.label}
              </text>
            </g>
          );
        }

        // Place the label in the widest angular gap between this station's
        // incident edges, so it never sits on top of a route line or label.
        const edgeAngles = NEIGHBORS_BY_STATION[station.id].map((nid) => {
          const npos = { x: xScale(stationById[nid].x), y: yScale(stationById[nid].y) };
          return Math.atan2(npos.y - cy, npos.x - cx);
        });
        let labelAngle = Math.PI / 2;
        if (edgeAngles.length > 0) {
          edgeAngles.sort((a, b) => a - b);
          let bestGap = -1;
          for (let k = 0; k < edgeAngles.length; k += 1) {
            const start = edgeAngles[k];
            const end = edgeAngles[(k + 1) % edgeAngles.length] + (k === edgeAngles.length - 1 ? 2 * Math.PI : 0);
            const gap = end - start;
            if (gap > bestGap) {
              bestGap = gap;
              labelAngle = start + gap / 2;
            }
          }
        }
        // Anchor the label away from the node along the gap direction — a
        // fixed "middle" anchor would let long names like "Harborside" swing
        // back over the node when the gap points nearly horizontal.
        const cosA = Math.cos(labelAngle);
        const textAnchor = cosA > 0.35 ? "start" : cosA < -0.35 ? "end" : "middle";
        const labelDist = r + (textAnchor === "middle" ? 20 : 13);
        const lx = cx + Math.cos(labelAngle) * labelDist;
        const ly = cy + Math.sin(labelAngle) * labelDist;

        return (
          <g key={station.id}>
            <circle cx={cx} cy={cy} r={r} fill={fill} stroke={t.ink} strokeWidth={2}>
              <title>{`${station.label} (${station.id}) — ${DEGREE[station.id]} connecting route${DEGREE[station.id] === 1 ? "" : "s"}`}</title>
            </circle>
            <text x={cx} y={cy} fontSize={Math.max(10, r * 0.55)} fontWeight={600} fill={codeColor} textAnchor="middle" dominantBaseline="middle">
              {station.id}
            </text>
            <text x={lx} y={ly} fontSize={15} fontWeight={400} fill={t.ink} textAnchor={textAnchor} dominantBaseline="middle">
              {station.label}
            </text>
          </g>
        );
      })}
    </g>
  );
}

function Legend() {
  return (
    <g transform="translate(28, 26)" fontFamily={FONT}>
      {TYPES.map((type, i) => (
        <g key={type} transform={`translate(0, ${i * 28})`}>
          <line x1={0} y1={8} x2={26} y2={8} stroke={TYPE_COLOR[type]} strokeWidth={3} strokeDasharray={type === "Express" ? "9 6" : undefined} />
          <text x={34} y={13} fontSize={14} fill={t.ink}>
            {type}
          </text>
        </g>
      ))}
    </g>
  );
}

const TITLE_H = 62;
const CAPTION_H = 30;

// --- Chart (default-exported component — the harness mounts it) -------------
export default function Chart() {
  const W = window.ANYPLOT_SIZE.width;
  const H = window.ANYPLOT_SIZE.height;
  const chartH = H - TITLE_H - CAPTION_H;

  return (
    <div
      style={{
        width: W,
        height: H,
        background: t.pageBg,
        fontFamily: FONT,
        display: "flex",
        flexDirection: "column",
      }}
    >
      <div style={{ height: TITLE_H, display: "flex", alignItems: "center", justifyContent: "center" }}>
        <span style={{ fontSize: 22, fontWeight: 600, color: t.ink }}>
          network-transport-static · javascript · muix · anyplot.ai
        </span>
      </div>
      <ChartContainer
        width={W}
        height={chartH}
        skipAnimation
        series={[]}
        margin={{ top: 20, right: 30, bottom: 20, left: 30 }}
        xAxis={[{ min: X_DOMAIN[0], max: X_DOMAIN[1], scaleType: "linear" }]}
        yAxis={[{ min: Y_DOMAIN[0], max: Y_DOMAIN[1], scaleType: "linear" }]}
      >
        <RouteEdges />
        <Stations />
        <Legend />
      </ChartContainer>
      <div style={{ height: CAPTION_H, display: "flex", alignItems: "center", justifyContent: "center" }}>
        <span style={{ fontSize: 13, color: t.inkSoft }}>
          Arrows show travel direction · labels show route ID and scheduled departure {"→"} arrival · larger circle marks the Central interchange
        </span>
      </div>
    </div>
  );
}
Runnable source as JSON, for any HTTP client: https://api.anyplot.ai/specs/network-transport-static/muix/code. Any spec id and library id listed in llms-full.txt fit the same URL shape; every URL below is complete and callable.
{
  "spec_id": "network-transport-static",
  "language": "javascript",
  "library": "muix",
  "page": "https://anyplot.ai/network-transport-static/javascript/muix",
  "hub": "https://anyplot.ai/network-transport-static",
  "code_json": "https://api.anyplot.ai/specs/network-transport-static/muix/code",
  "spec_json": "https://api.anyplot.ai/specs/network-transport-static",
  "render_light_png": "https://storage.googleapis.com/anyplot-images/plots/network-transport-static/javascript/muix/plot-light.png",
  "render_dark_png": "https://storage.googleapis.com/anyplot-images/plots/network-transport-static/javascript/muix/plot-dark.png",
  "interactive_light_html": "https://storage.googleapis.com/anyplot-images/plots/network-transport-static/javascript/muix/plot-light.html",
  "interactive_dark_html": "https://storage.googleapis.com/anyplot-images/plots/network-transport-static/javascript/muix/plot-dark.html",
  "quality_score": 87.0,
  "license": "MIT",
  "guide": "https://anyplot.ai/llms.txt"
}
Part of Static Transport Network Diagram on anyplot.ai.