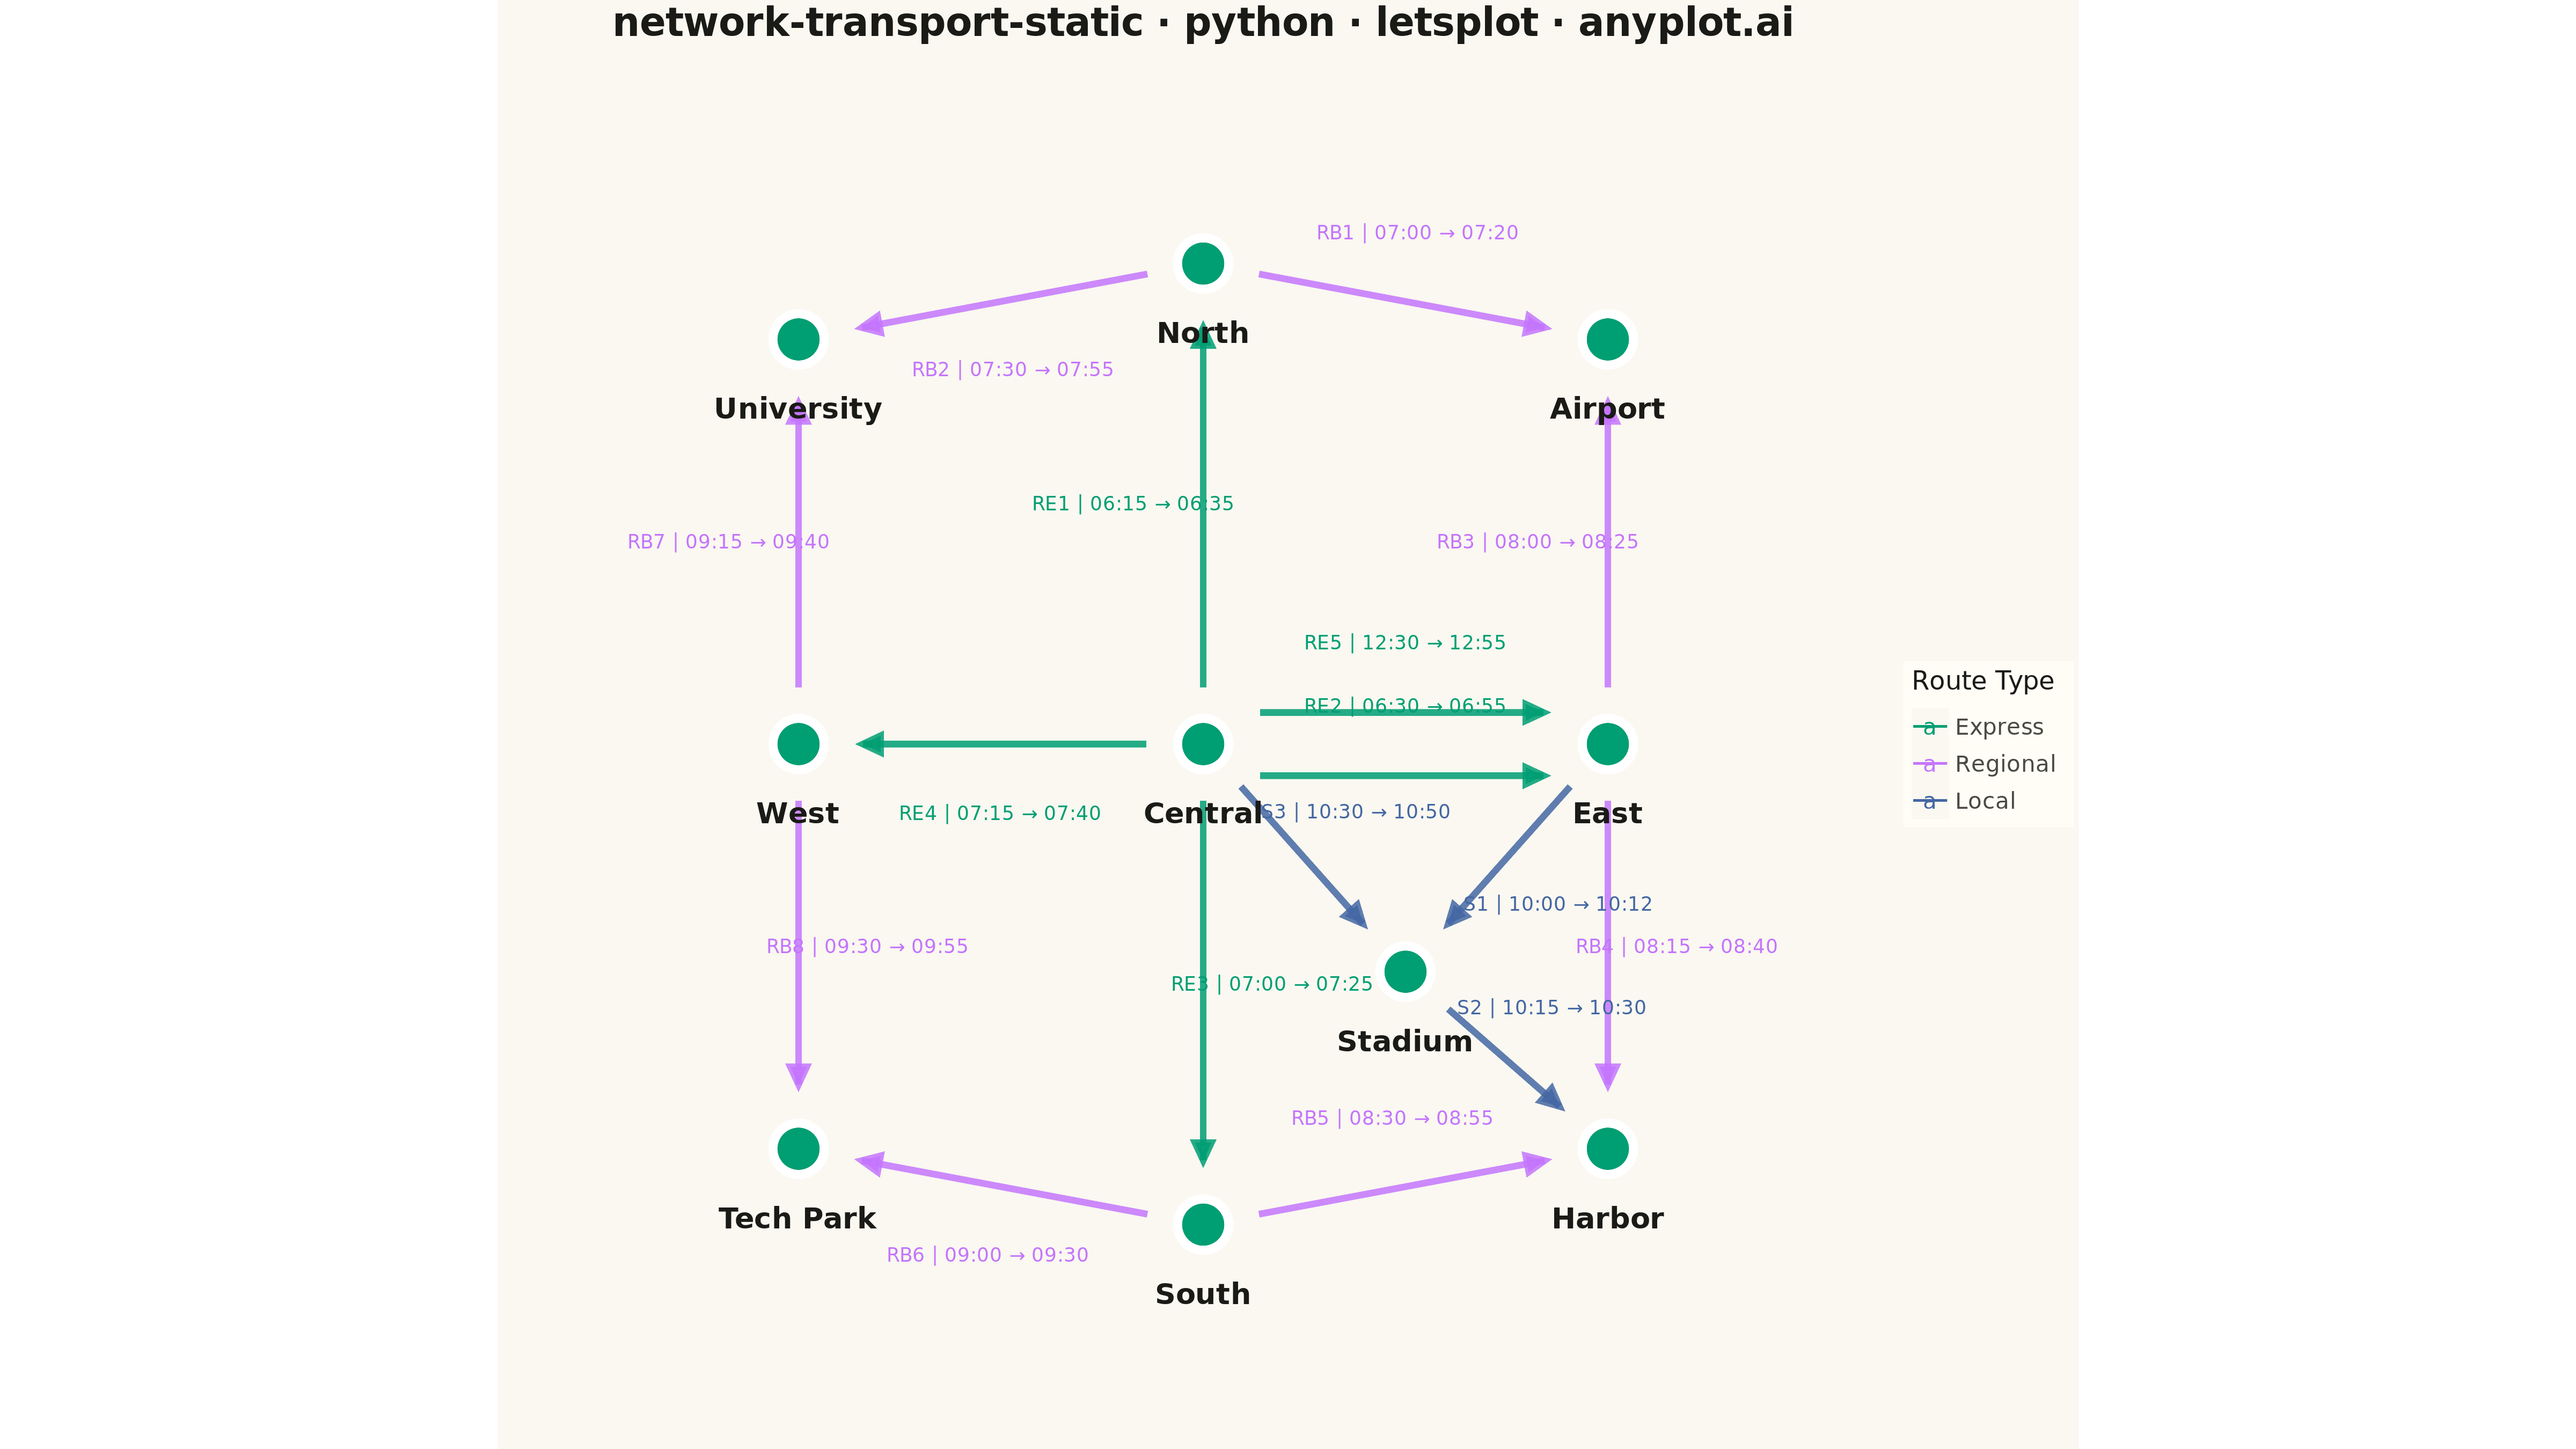
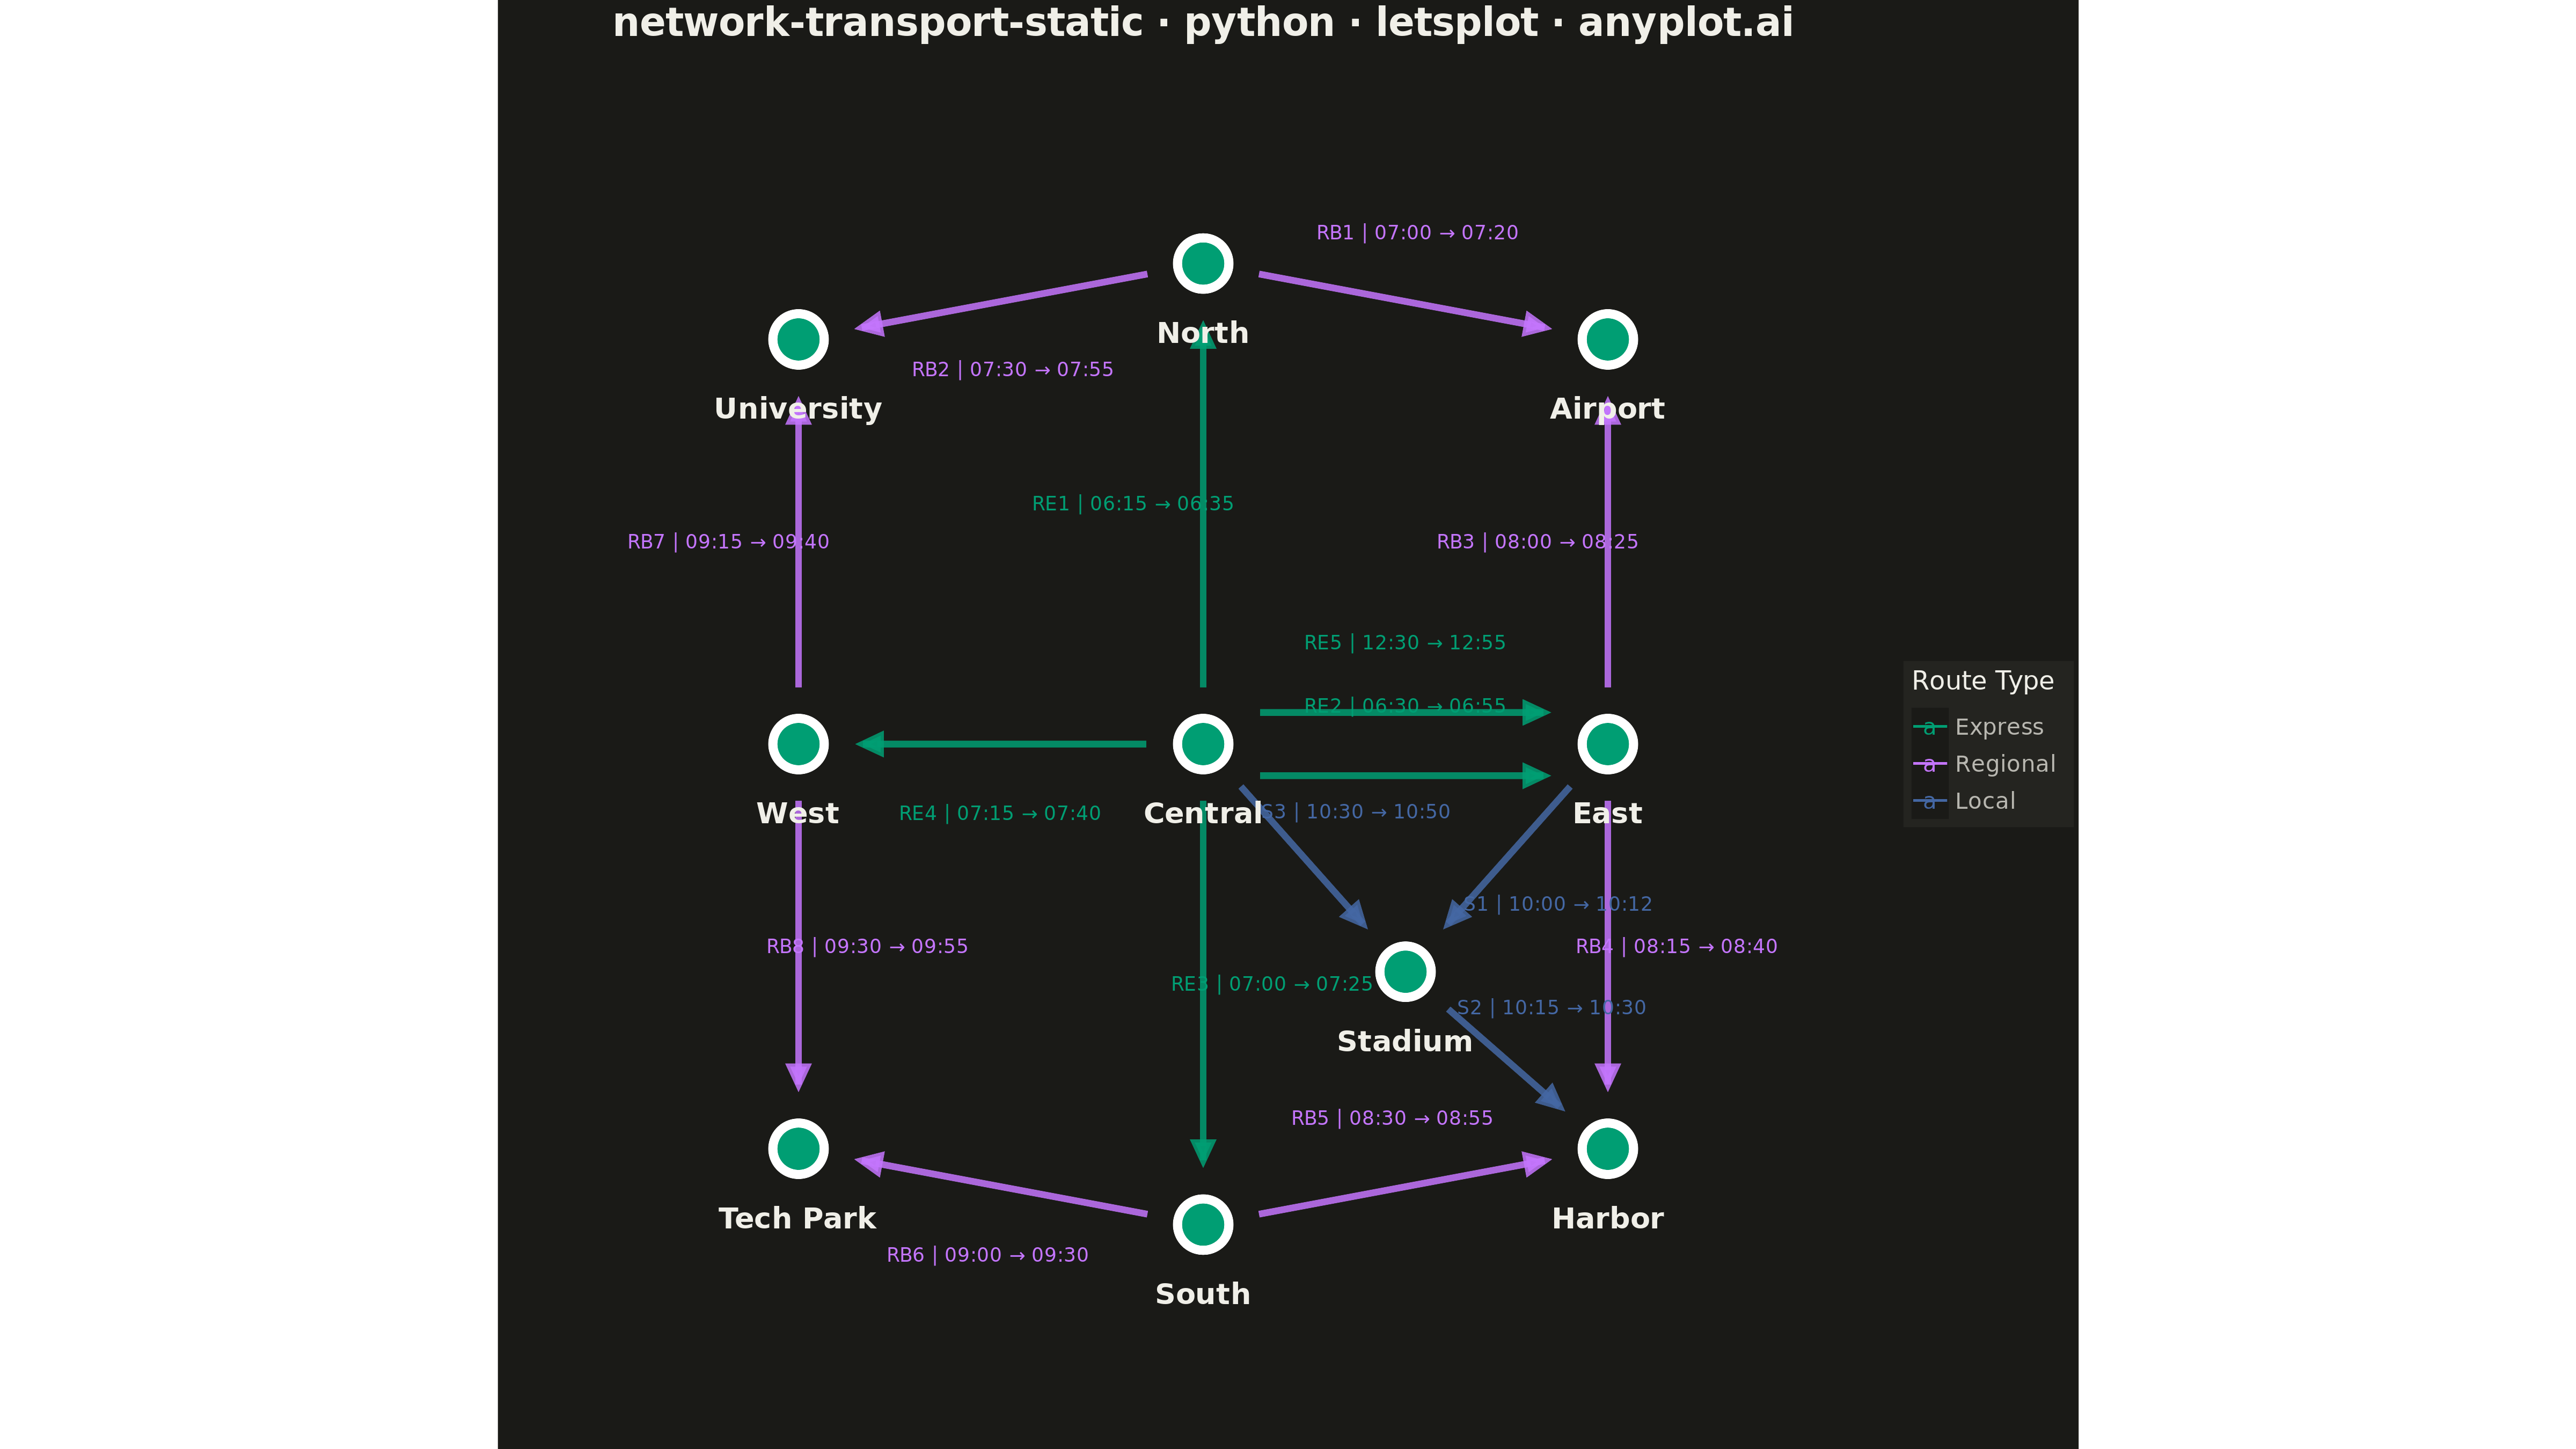
A directed network visualization for transportation systems where stations are displayed as labeled nodes and train/bus routes as directed edges. Edges display departure times, arrival times, and route identifiers. Designed for visualizing timetables, route maps, and connection patterns in rail, bus, or flight networks. This static version focuses on clear, readable presentation without interactive repositioning.
""" anyplot.ai
network-transport-static: Static Transport Network Diagram
Library: letsplot 4.9.0 | Python 3.13.13
Quality: 88/100 | Updated: 2026-05-18
"""

import os

import numpy as np
import pandas as pd
from lets_plot import (
    LetsPlot,
    aes,
    arrow,
    coord_fixed,
    element_rect,
    element_text,
    geom_point,
    geom_segment,
    geom_text,
    ggplot,
    ggsave,
    ggsize,
    labs,
    layer_tooltips,
    scale_color_manual,
    scale_x_continuous,
    scale_y_continuous,
    theme,
    theme_void,
)


LetsPlot.setup_html()

# Theme tokens
THEME = os.getenv("ANYPLOT_THEME", "light")
PAGE_BG = "#FAF8F1" if THEME == "light" else "#1A1A17"
ELEVATED_BG = "#FFFDF6" if THEME == "light" else "#242420"
INK = "#1A1A17" if THEME == "light" else "#F0EFE8"
INK_SOFT = "#4A4A44" if THEME == "light" else "#B8B7B0"
INK_MUTED = "#6B6A63" if THEME == "light" else "#A8A79F"

# Okabe-Ito palette for route types
IMPRINT = ["#009E73", "#C475FD", "#4467A3"]

# Data: Regional rail network with stations and routes
np.random.seed(42)

# Station data with x, y coordinates (positioned like a simplified rail map)
stations = [
    {"id": "A", "label": "Central", "x": 0.5, "y": 0.5},
    {"id": "B", "label": "North", "x": 0.5, "y": 0.88},
    {"id": "C", "label": "East", "x": 0.82, "y": 0.5},
    {"id": "D", "label": "South", "x": 0.5, "y": 0.12},
    {"id": "E", "label": "West", "x": 0.18, "y": 0.5},
    {"id": "F", "label": "Airport", "x": 0.82, "y": 0.82},
    {"id": "G", "label": "University", "x": 0.18, "y": 0.82},
    {"id": "H", "label": "Harbor", "x": 0.82, "y": 0.18},
    {"id": "I", "label": "Tech Park", "x": 0.18, "y": 0.18},
    {"id": "J", "label": "Stadium", "x": 0.66, "y": 0.32},
]

# Route data: train connections with times
# Includes multiple routes between same stations to demonstrate curved edges
routes = [
    # Express routes (RE) - Central hub connections
    {"source": "A", "target": "B", "route_id": "RE1", "depart": "06:15", "arrive": "06:35", "type": "Express"},
    {"source": "A", "target": "C", "route_id": "RE2", "depart": "06:30", "arrive": "06:55", "type": "Express"},
    {"source": "A", "target": "D", "route_id": "RE3", "depart": "07:00", "arrive": "07:25", "type": "Express"},
    {"source": "A", "target": "E", "route_id": "RE4", "depart": "07:15", "arrive": "07:40", "type": "Express"},
    # Regional routes (RB) - Connecting outer stations
    {"source": "B", "target": "F", "route_id": "RB1", "depart": "07:00", "arrive": "07:20", "type": "Regional"},
    {"source": "B", "target": "G", "route_id": "RB2", "depart": "07:30", "arrive": "07:55", "type": "Regional"},
    {"source": "C", "target": "F", "route_id": "RB3", "depart": "08:00", "arrive": "08:25", "type": "Regional"},
    {"source": "C", "target": "H", "route_id": "RB4", "depart": "08:15", "arrive": "08:40", "type": "Regional"},
    {"source": "D", "target": "H", "route_id": "RB5", "depart": "08:30", "arrive": "08:55", "type": "Regional"},
    {"source": "D", "target": "I", "route_id": "RB6", "depart": "09:00", "arrive": "09:30", "type": "Regional"},
    {"source": "E", "target": "G", "route_id": "RB7", "depart": "09:15", "arrive": "09:40", "type": "Regional"},
    {"source": "E", "target": "I", "route_id": "RB8", "depart": "09:30", "arrive": "09:55", "type": "Regional"},
    # Local routes (S) - Short connections, including multiple routes to same destination
    {"source": "C", "target": "J", "route_id": "S1", "depart": "10:00", "arrive": "10:12", "type": "Local"},
    {"source": "J", "target": "H", "route_id": "S2", "depart": "10:15", "arrive": "10:30", "type": "Local"},
    {"source": "A", "target": "J", "route_id": "S3", "depart": "10:30", "arrive": "10:50", "type": "Local"},
    # Second Express route A→C to demonstrate offset edges
    {"source": "A", "target": "C", "route_id": "RE5", "depart": "12:30", "arrive": "12:55", "type": "Express"},
]

# Create DataFrames
stations_df = pd.DataFrame(stations)

# Track route counts between station pairs for offset calculation
route_counts = {}
for r in routes:
    key = (r["source"], r["target"])
    route_counts[key] = route_counts.get(key, 0) + 1

route_index = {}

# Build edge DataFrame with source/target coordinates and curve offsets
station_coords = {s["id"]: (s["x"], s["y"]) for s in stations}
edges_data = []
for r in routes:
    src_x, src_y = station_coords[r["source"]]
    tgt_x, tgt_y = station_coords[r["target"]]

    # Track index for this station pair
    key = (r["source"], r["target"])
    idx = route_index.get(key, 0)
    route_index[key] = idx + 1
    total = route_counts[key]

    # Shorten edges slightly so arrows don't overlap nodes
    dx, dy = tgt_x - src_x, tgt_y - src_y
    length = np.sqrt(dx**2 + dy**2)
    offset = 0.045 / length if length > 0 else 0

    # Calculate perpendicular offset for curved/offset edges
    perp_x = -dy / length if length > 0 else 0
    perp_y = dx / length if length > 0 else 0

    # Apply perpendicular offset for multiple routes between same stations (increased for visibility)
    if total > 1:
        curve_offset = 0.05 * (idx - (total - 1) / 2)
    else:
        curve_offset = 0

    # Offset labels perpendicular to edge direction (increased for clarity)
    label_offset = 0.055

    edges_data.append(
        {
            "x": src_x + dx * offset + perp_x * curve_offset,
            "y": src_y + dy * offset + perp_y * curve_offset,
            "xend": tgt_x - dx * offset + perp_x * curve_offset,
            "yend": tgt_y - dy * offset + perp_y * curve_offset,
            "route_id": r["route_id"],
            "depart": r["depart"],
            "arrive": r["arrive"],
            "label": f"{r['route_id']} | {r['depart']} → {r['arrive']}",
            "type": r["type"],
            "mid_x": (src_x + tgt_x) / 2 + perp_x * (label_offset + curve_offset),
            "mid_y": (src_y + tgt_y) / 2 + perp_y * (label_offset + curve_offset),
            "source_station": next(s["label"] for s in stations if s["id"] == r["source"]),
            "target_station": next(s["label"] for s in stations if s["id"] == r["target"]),
        }
    )

edges_df = pd.DataFrame(edges_data)

# Map route types to Okabe-Ito colors
route_type_order = ["Express", "Regional", "Local"]
route_colors = {route_type_order[i]: IMPRINT[i] for i in range(len(route_type_order))}

# Create tooltip specs for interactive hover
edge_tooltips = (
    layer_tooltips()
    .title("@route_id")
    .line("@source_station → @target_station")
    .line("Departs: @depart")
    .line("Arrives: @arrive")
    .line("Type: @type")
)

station_tooltips = layer_tooltips().title("@label").line("Station ID: @id")

# Create the plot with interactive tooltips
plot = (
    ggplot()
    # Draw edges as segments with arrows and tooltips
    + geom_segment(
        aes(x="x", y="y", xend="xend", yend="yend", color="type"),
        data=edges_df,
        size=1.8,
        alpha=0.85,
        arrow=arrow(angle=25, length=12, type="closed"),
        tooltips=edge_tooltips,
    )
    # Draw edge labels (route and times) - larger for readability
    + geom_text(aes(x="mid_x", y="mid_y", label="label", color="type"), data=edges_df, size=6)
    # Draw station nodes with tooltips
    + geom_point(
        aes(x="x", y="y"),
        data=stations_df,
        size=12,
        color="white",
        shape=21,
        fill=IMPRINT[0],
        stroke=2.5,
        tooltips=station_tooltips,
    )
    # Draw station labels (adjusted position to avoid edge label overlap)
    + geom_text(aes(x="x", y="y", label="label"), data=stations_df, size=9, color=INK, fontface="bold", nudge_y=-0.055)
    # Color scale for route types
    + scale_color_manual(values=route_colors, name="Route Type")
    # Styling
    + labs(title="network-transport-static · python · letsplot · anyplot.ai", x="", y="")
    + theme_void()
    + theme(
        plot_background=element_rect(fill=PAGE_BG, color=PAGE_BG),
        panel_background=element_rect(fill=PAGE_BG, color=PAGE_BG),
        plot_title=element_text(size=24, face="bold", hjust=0.5, color=INK),
        legend_position="right",
        legend_background=element_rect(fill=ELEVATED_BG, color=INK_SOFT),
        legend_title=element_text(size=16, color=INK),
        legend_text=element_text(size=14, color=INK_SOFT),
    )
    + scale_x_continuous(limits=[0, 1])
    + scale_y_continuous(limits=[0, 1])
    + coord_fixed(ratio=1)
    + ggsize(1600, 900)
)

# Save as PNG (scale 3x for 4800x2700)
ggsave(plot, f"plot-{THEME}.png", scale=3, path=".")

# Save as HTML for interactivity (tooltips work in HTML)
ggsave(plot, f"plot-{THEME}.html", path=".")
Runnable source as JSON, for any HTTP client: https://api.anyplot.ai/specs/network-transport-static/letsplot/code. Any spec id and library id listed in llms-full.txt fit the same URL shape; every URL below is complete and callable.
{
  "spec_id": "network-transport-static",
  "language": "python",
  "library": "letsplot",
  "page": "https://anyplot.ai/network-transport-static/python/letsplot",
  "hub": "https://anyplot.ai/network-transport-static",
  "code_json": "https://api.anyplot.ai/specs/network-transport-static/letsplot/code",
  "spec_json": "https://api.anyplot.ai/specs/network-transport-static",
  "render_light_png": "https://storage.googleapis.com/anyplot-images/plots/network-transport-static/python/letsplot/plot-light.png",
  "render_dark_png": "https://storage.googleapis.com/anyplot-images/plots/network-transport-static/python/letsplot/plot-dark.png",
  "interactive_light_html": "https://storage.googleapis.com/anyplot-images/plots/network-transport-static/python/letsplot/plot-light.html",
  "interactive_dark_html": "https://storage.googleapis.com/anyplot-images/plots/network-transport-static/python/letsplot/plot-dark.html",
  "quality_score": 88.0,
  "license": "MIT",
  "guide": "https://anyplot.ai/llms.txt"
}
Part of Static Transport Network Diagram on anyplot.ai.