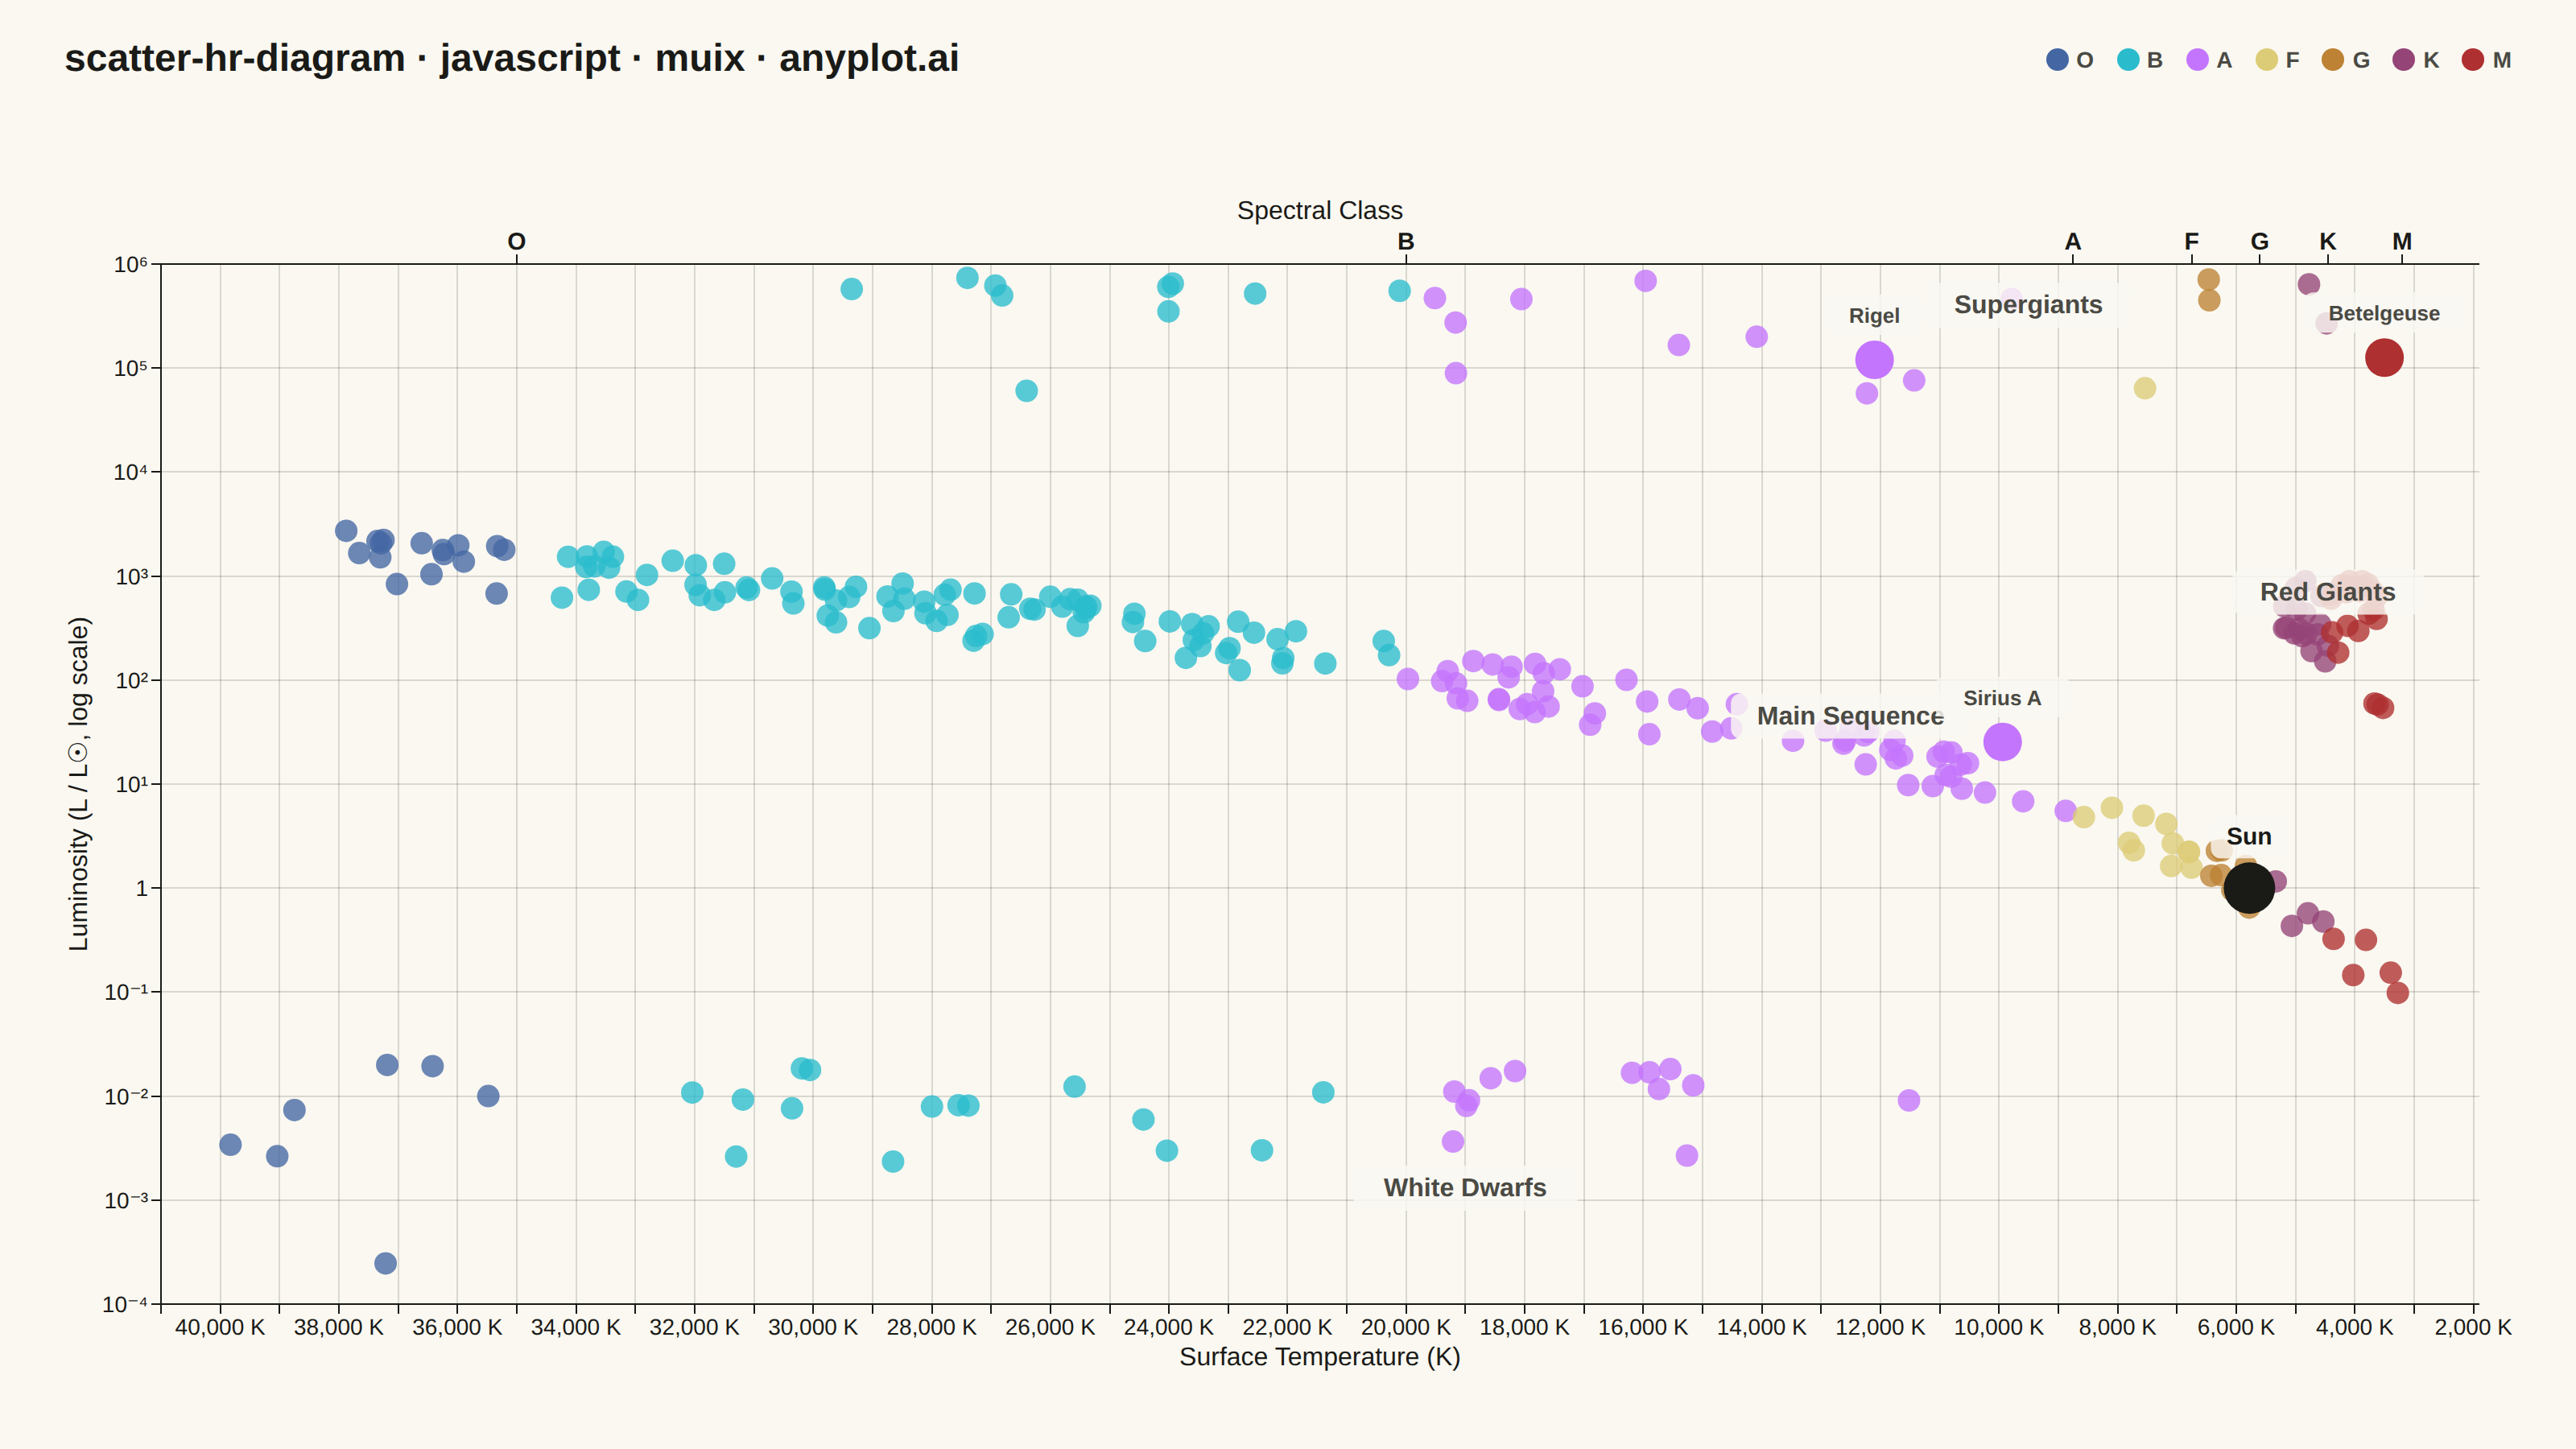
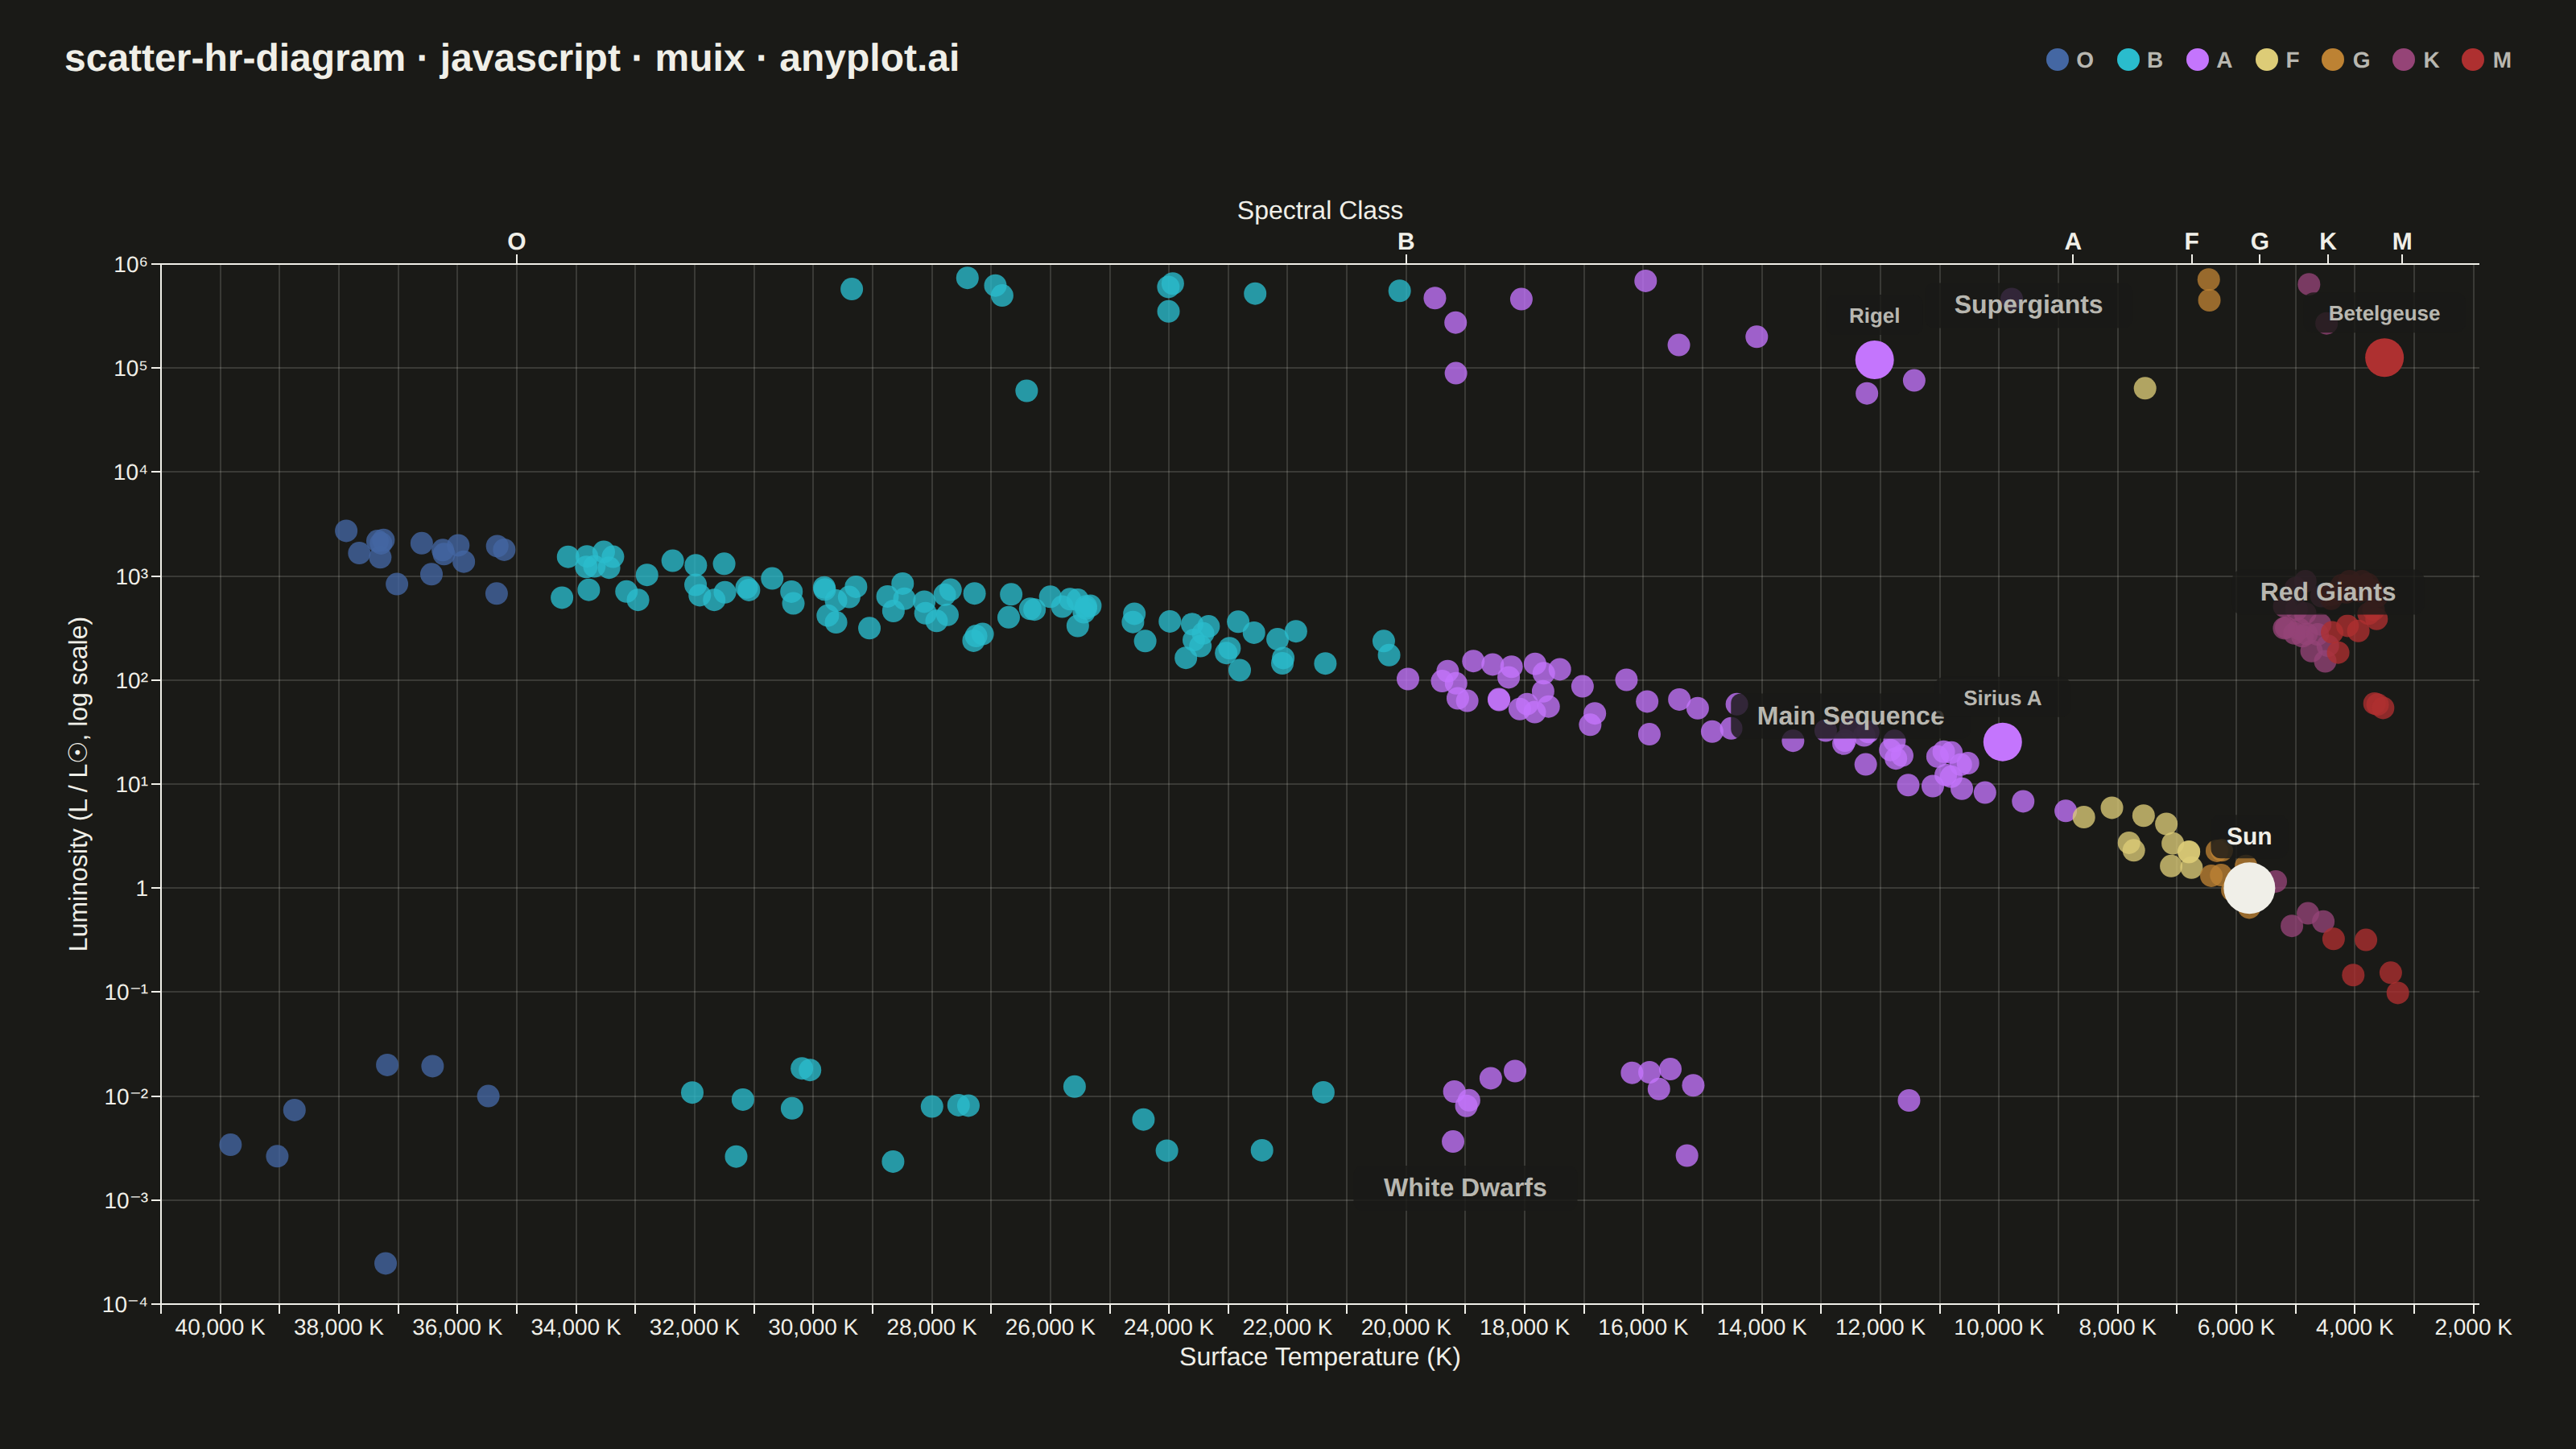
The Hertzsprung-Russell (HR) diagram is the iconic astrophysics scatter plot that shows stellar luminosity (or absolute magnitude) versus surface temperature (or spectral class). Stars naturally cluster along the main sequence diagonal, with distinct regions for red giants, supergiants, and white dwarfs, revealing the fundamental relationship between stellar temperature and brightness.
Preview render from the MUI X Charts implementation.