The same plot in 14 other libraries — JavaScript: Chart.js, D3.js, Apache ECharts, MUI X Charts; Python: Altair, Bokeh, lets-plot, Matplotlib, Plotly, plotnine, Pygal, Seaborn; R: ggplot2; Julia: Makie.jl. Compare all 15 side by side: Hertzsprung-Russell Diagram in Python, R, Julia and JavaScript.
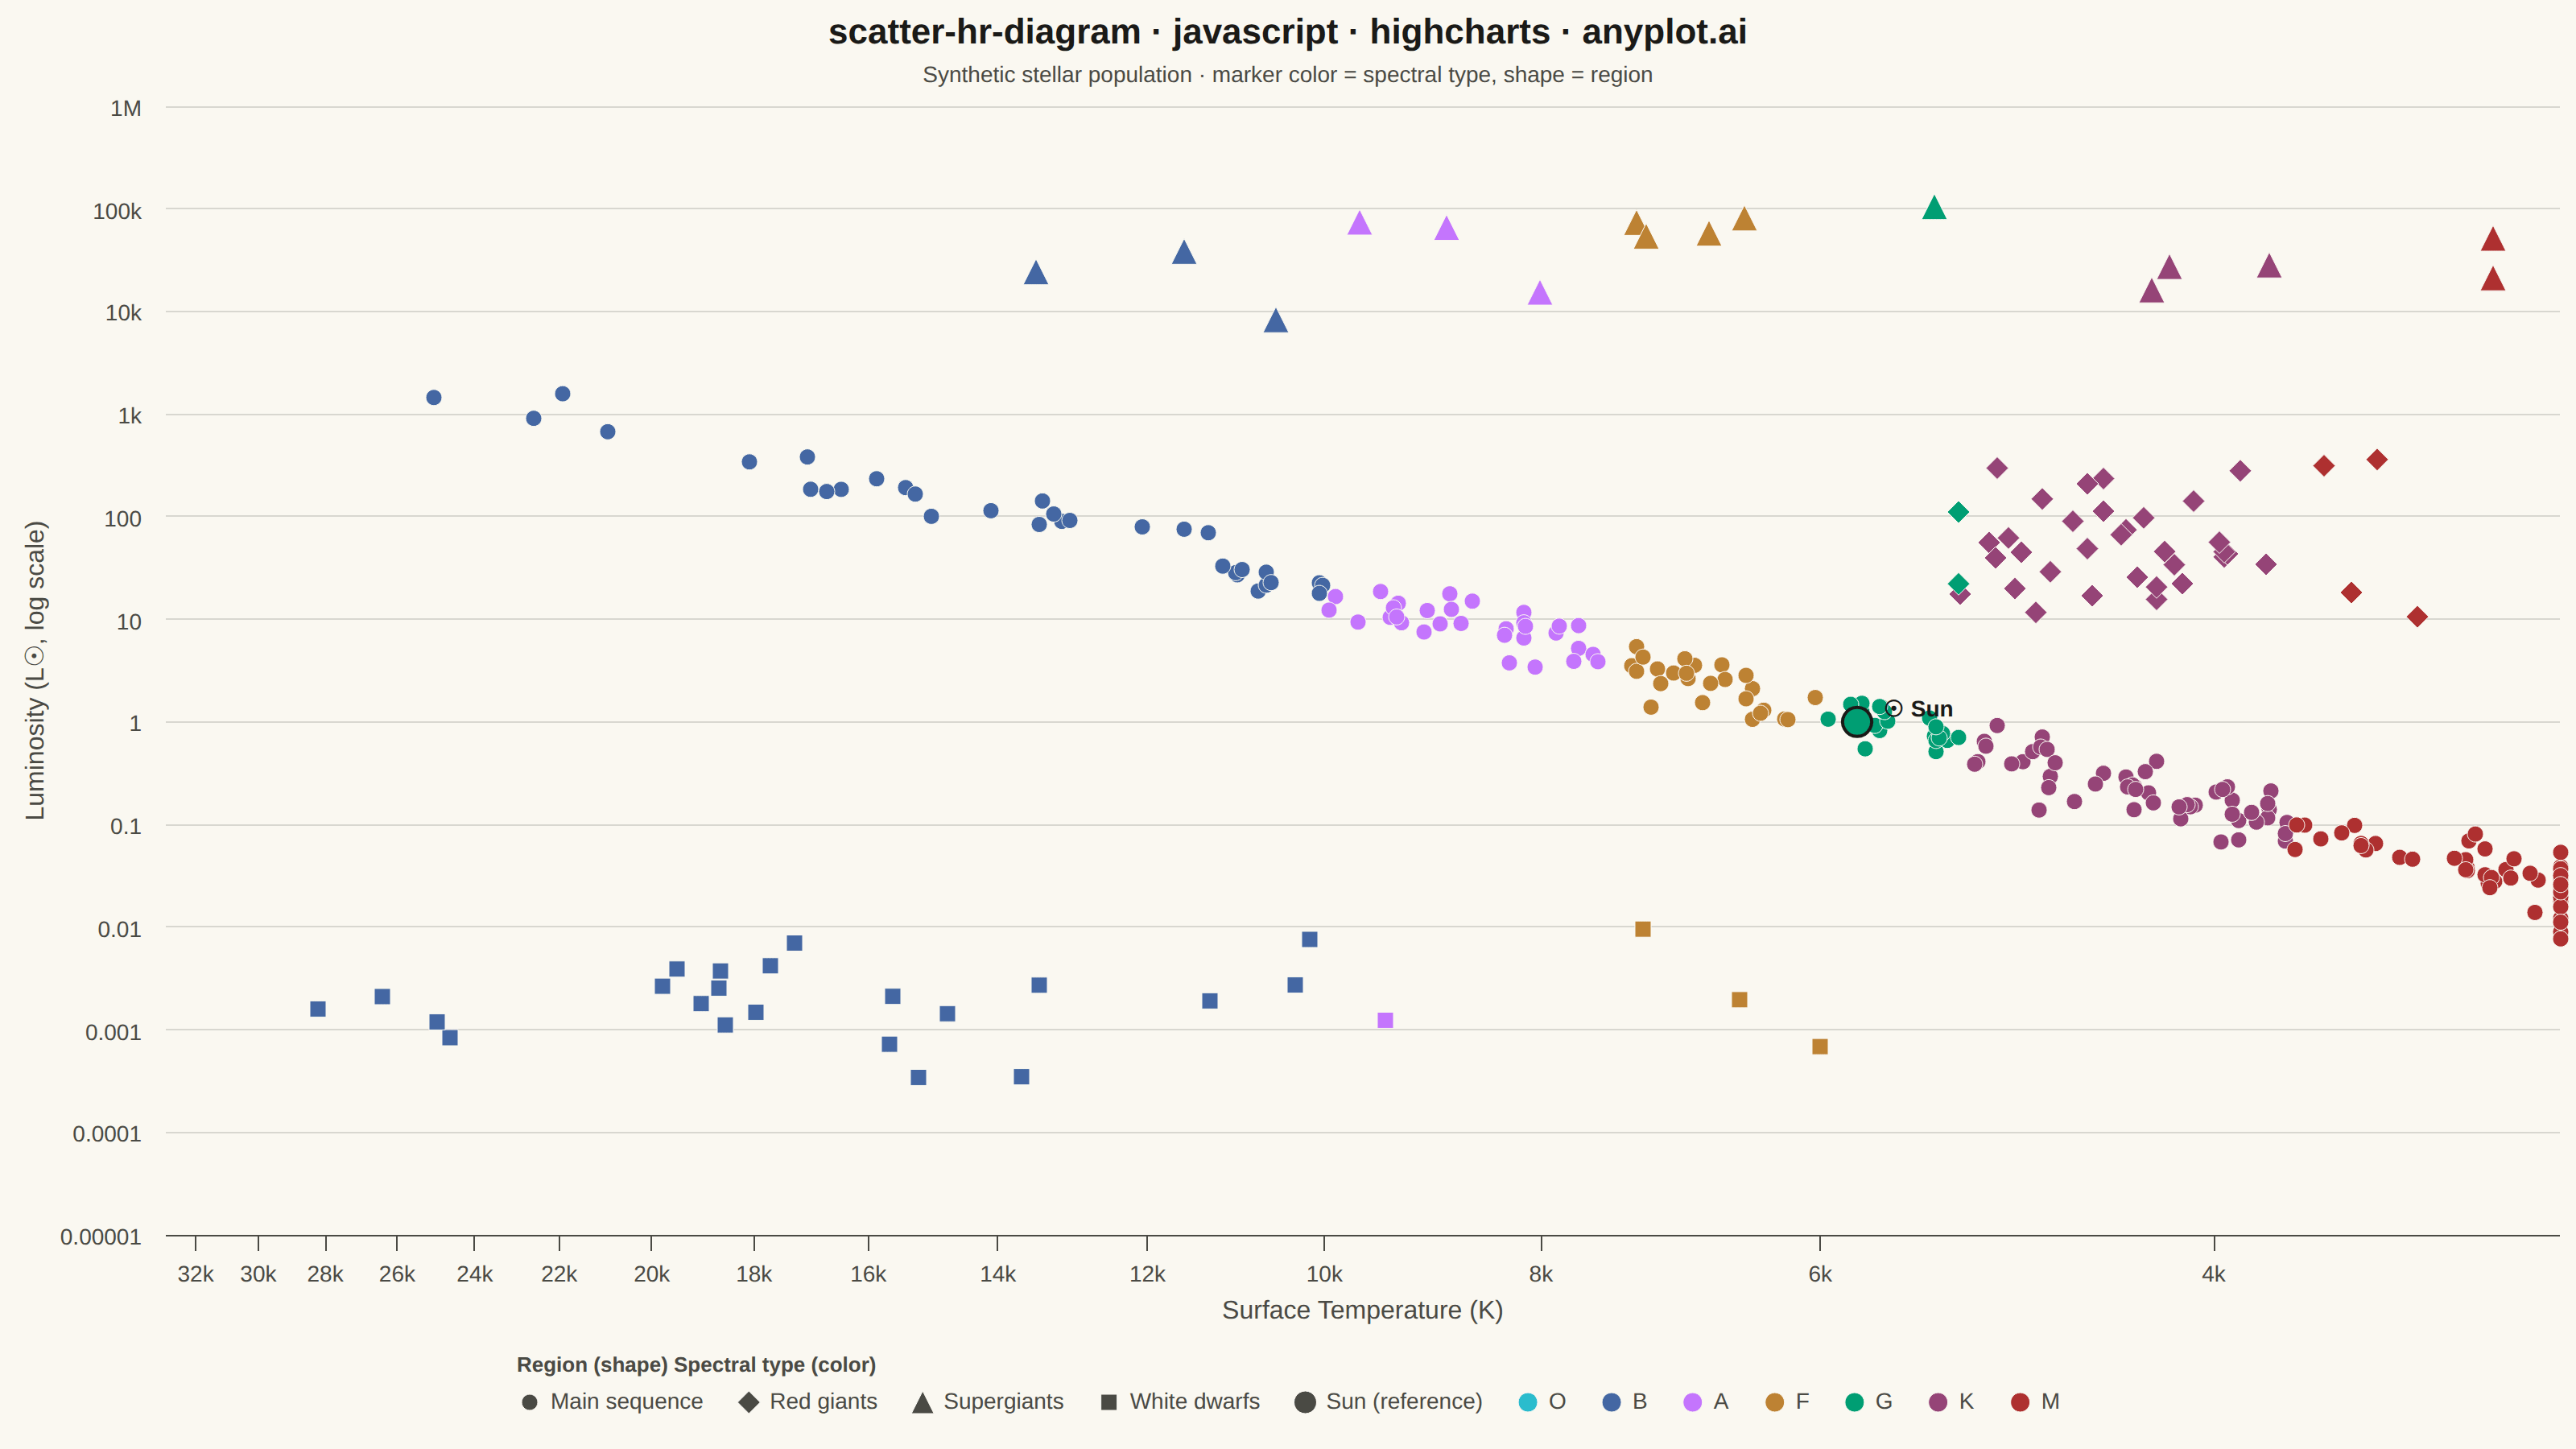
The Hertzsprung-Russell (HR) diagram is the iconic astrophysics scatter plot that shows stellar luminosity (or absolute magnitude) versus surface temperature (or spectral class). Stars naturally cluster along the main sequence diagonal, with distinct regions for red giants, supergiants, and white dwarfs, revealing the fundamental relationship between stellar temperature and brightness.
// anyplot.ai
// scatter-hr-diagram: Hertzsprung-Russell Diagram
// Library: highcharts 12.6.0 | JavaScript 22.23.2
// Quality: 88/100 | Created: 2026-08-26

const t = window.ANYPLOT_TOKENS;

// --- Deterministic PRNG (LCG, fixed seed) -----------------------------------
let seed = 42;
function rand() {
  seed = (seed * 1103515245 + 12345) & 0x7fffffff;
  return seed / 0x7fffffff;
}
function gauss(mean, std) {
  const u1 = Math.max(rand(), 1e-9);
  const u2 = rand();
  return mean + std * Math.sqrt(-2 * Math.log(u1)) * Math.cos(2 * Math.PI * u2);
}

// --- Spectral classification (temperature -> letter, boundary in Kelvin) ---
// Imprint has no true "orange"/"white" hues, so only the two strongest,
// unambiguous conventions (hot O/B = blue, cool M = red) get their semantic
// match; the mid-range classes take distinguishable Imprint members instead
// of an invented custom hex — see prompts/default-style-guide.md "Semantic
// exception". Every class is spelled out in the legend, so the mapping reads
// as a key, not a literal color claim.
const SPECTRAL_BOUNDARIES = [
  { letter: "O", min: 30000, color: "#2ABCCD" },
  { letter: "B", min: 10000, color: "#4467A3" },
  { letter: "A", min: 7500, color: "#C475FD" },
  { letter: "F", min: 6000, color: "#BD8233" },
  { letter: "G", min: 5200, color: "#009E73" },
  { letter: "K", min: 3700, color: "#954477" },
  { letter: "M", min: 0, color: "#AE3030" },
];
function spectralClass(temperature) {
  return SPECTRAL_BOUNDARIES.find((b) => temperature >= b.min);
}

// --- Data (in-memory, deterministic) ----------------------------------------
// Main sequence: log-spread temperatures, luminosity follows the empirical
// mass-luminosity relation (L ~ T^5.3, calibrated so the Sun sits on the curve).
function starPoint(temperature, luminosity, name) {
  const spectral = spectralClass(temperature);
  return {
    x: temperature,
    y: luminosity,
    color: spectral.color,
    spectral_type: spectral.letter,
    star_name: name,
  };
}

const mainSequence = [];
for (let i = 0; i < 220; i++) {
  const logT = gauss(3.72, 0.28); // ~3000-30000 K, skewed cool (M dwarfs dominate)
  const temperature = Math.min(33000, Math.max(2800, Math.pow(10, logT)));
  const baseLum = Math.pow(temperature / 5778, 5.3);
  const luminosity = baseLum * Math.pow(10, gauss(0, 0.15));
  mainSequence.push(starPoint(temperature, luminosity, `MS-${i + 1}`));
}

// Red giants: cool, but 10-1000x solar luminosity.
const redGiants = [];
for (let i = 0; i < 38; i++) {
  const temperature = Math.max(3200, Math.min(5200, gauss(4300, 500)));
  const luminosity = Math.pow(10, gauss(1.8, 0.35));
  redGiants.push(starPoint(temperature, luminosity, `RG-${i + 1}`));
}

// Supergiants: wide temperature range, extreme luminosity.
const supergiants = [];
for (let i = 0; i < 16; i++) {
  const temperature = Math.max(3000, Math.min(28000, gauss(8000, 5500)));
  const luminosity = Math.pow(10, gauss(4.7, 0.4));
  supergiants.push(starPoint(temperature, luminosity, `SG-${i + 1}`));
}

// White dwarfs: hot but tiny, so faint.
const whiteDwarfs = [];
for (let i = 0; i < 26; i++) {
  const temperature = Math.max(6000, Math.min(38000, gauss(15000, 6000)));
  const luminosity = Math.pow(10, gauss(-2.7, 0.4));
  whiteDwarfs.push(starPoint(temperature, luminosity, `WD-${i + 1}`));
}

const sun = {
  ...starPoint(5778, 1.0, "Sun"),
  marker: { symbol: "circle", radius: 9, lineWidth: 2, lineColor: t.ink },
  dataLabels: {
    enabled: true,
    format: "☉ Sun",
    align: "left",
    x: 12,
    y: 4,
    style: { color: t.ink, fontSize: "14px", fontWeight: "600", textOutline: "none" },
  },
};

// Legend-only entries: one swatch per spectral class so hue (temperature
// class) reads independently from marker shape (region), which is encoded
// per-series below.
const spectralLegend = SPECTRAL_BOUNDARIES.map((s) => ({
  name: s.letter,
  color: s.color,
  data: [],
  marker: { symbol: "circle", radius: 6 },
  enableMouseTracking: false,
  showInLegend: true,
}));

// --- Chart -------------------------------------------------------------------
Highcharts.chart("container", {
  chart: {
    type: "scatter",
    backgroundColor: "transparent",
    animation: false,
    style: { fontFamily: "inherit" },
  },
  credits: { enabled: false },
  title: {
    text: "scatter-hr-diagram · javascript · highcharts · anyplot.ai",
    style: { color: t.ink, fontSize: "22px", fontWeight: "600" },
  },
  subtitle: {
    text: "Synthetic stellar population · marker color = spectral type, shape = region",
    style: { color: t.inkSoft, fontSize: "14px" },
  },
  xAxis: {
    title: {
      text: "Surface Temperature (K)",
      style: { color: t.inkSoft, fontSize: "16px" },
    },
    type: "logarithmic",
    reversed: true,
    min: 2800,
    max: 33000,
    lineColor: t.inkSoft,
    tickColor: t.inkSoft,
    gridLineColor: t.grid,
    labels: { style: { color: t.inkSoft, fontSize: "14px" } },
  },
  yAxis: {
    title: {
      text: "Luminosity (L☉, log scale)",
      style: { color: t.inkSoft, fontSize: "16px" },
    },
    type: "logarithmic",
    min: 0.00005,
    max: 300000,
    gridLineColor: t.grid,
    lineColor: t.inkSoft,
    tickColor: t.inkSoft,
    labels: { style: { color: t.inkSoft, fontSize: "14px" } },
  },
  legend: {
    title: {
      text: "Region (shape)      Spectral type (color)",
      style: { color: t.inkSoft, fontSize: "13px" },
    },
    itemStyle: { color: t.inkSoft, fontSize: "14px" },
    itemHoverStyle: { color: t.ink },
  },
  tooltip: {
    pointFormat: "{point.star_name} ({point.spectral_type})<br/>T: {point.x:.0f} K<br/>L: {point.y:.4f} L☉",
  },
  // Region series keep one neutral swatch (chrome, not data) since shape
  // already encodes region; per-point `color` (set in starPoint) carries the
  // spectral-type hue instead, so the two channels never compete.
  colors: [t.inkSoft, t.inkSoft, t.inkSoft, t.inkSoft, t.inkSoft],
  plotOptions: {
    series: {
      animation: false,
      marker: { lineWidth: 0.5, lineColor: t.pageBg },
    },
  },
  series: [
    {
      name: "Main sequence",
      data: mainSequence,
      marker: { symbol: "circle", radius: 5 },
    },
    {
      name: "Red giants",
      data: redGiants,
      marker: { symbol: "diamond", radius: 7 },
    },
    {
      name: "Supergiants",
      data: supergiants,
      marker: { symbol: "triangle", radius: 8 },
    },
    {
      name: "White dwarfs",
      data: whiteDwarfs,
      marker: { symbol: "square", radius: 5 },
    },
    {
      name: "Sun (reference)",
      data: [sun],
      marker: { symbol: "circle", radius: 9 },
      showInLegend: true,
    },
    ...spectralLegend,
  ],
});
Runnable source as JSON, for any HTTP client: https://api.anyplot.ai/specs/scatter-hr-diagram/highcharts/code. Any spec id and library id listed in llms-full.txt fit the same URL shape; every URL below is complete and callable.
{
  "spec_id": "scatter-hr-diagram",
  "language": "javascript",
  "library": "highcharts",
  "page": "https://anyplot.ai/scatter-hr-diagram/javascript/highcharts",
  "hub": "https://anyplot.ai/scatter-hr-diagram",
  "code_json": "https://api.anyplot.ai/specs/scatter-hr-diagram/highcharts/code",
  "spec_json": "https://api.anyplot.ai/specs/scatter-hr-diagram",
  "render_light_png": "https://storage.googleapis.com/anyplot-images/plots/scatter-hr-diagram/javascript/highcharts/plot-light.png",
  "render_dark_png": "https://storage.googleapis.com/anyplot-images/plots/scatter-hr-diagram/javascript/highcharts/plot-dark.png",
  "interactive_light_html": "https://storage.googleapis.com/anyplot-images/plots/scatter-hr-diagram/javascript/highcharts/plot-light.html",
  "interactive_dark_html": "https://storage.googleapis.com/anyplot-images/plots/scatter-hr-diagram/javascript/highcharts/plot-dark.html",
  "quality_score": 88.0,
  "license": "MIT",
  "guide": "https://anyplot.ai/llms.txt"
}
Part of Hertzsprung-Russell Diagram on anyplot.ai.