The same plot in 14 other libraries — JavaScript: Chart.js, D3.js, Highcharts, MUI X Charts; Python: Altair, Bokeh, lets-plot, Matplotlib, Plotly, plotnine, Pygal, Seaborn; R: ggplot2; Julia: Makie.jl. Compare all 15 side by side: Hertzsprung-Russell Diagram in Python, R, Julia and JavaScript.
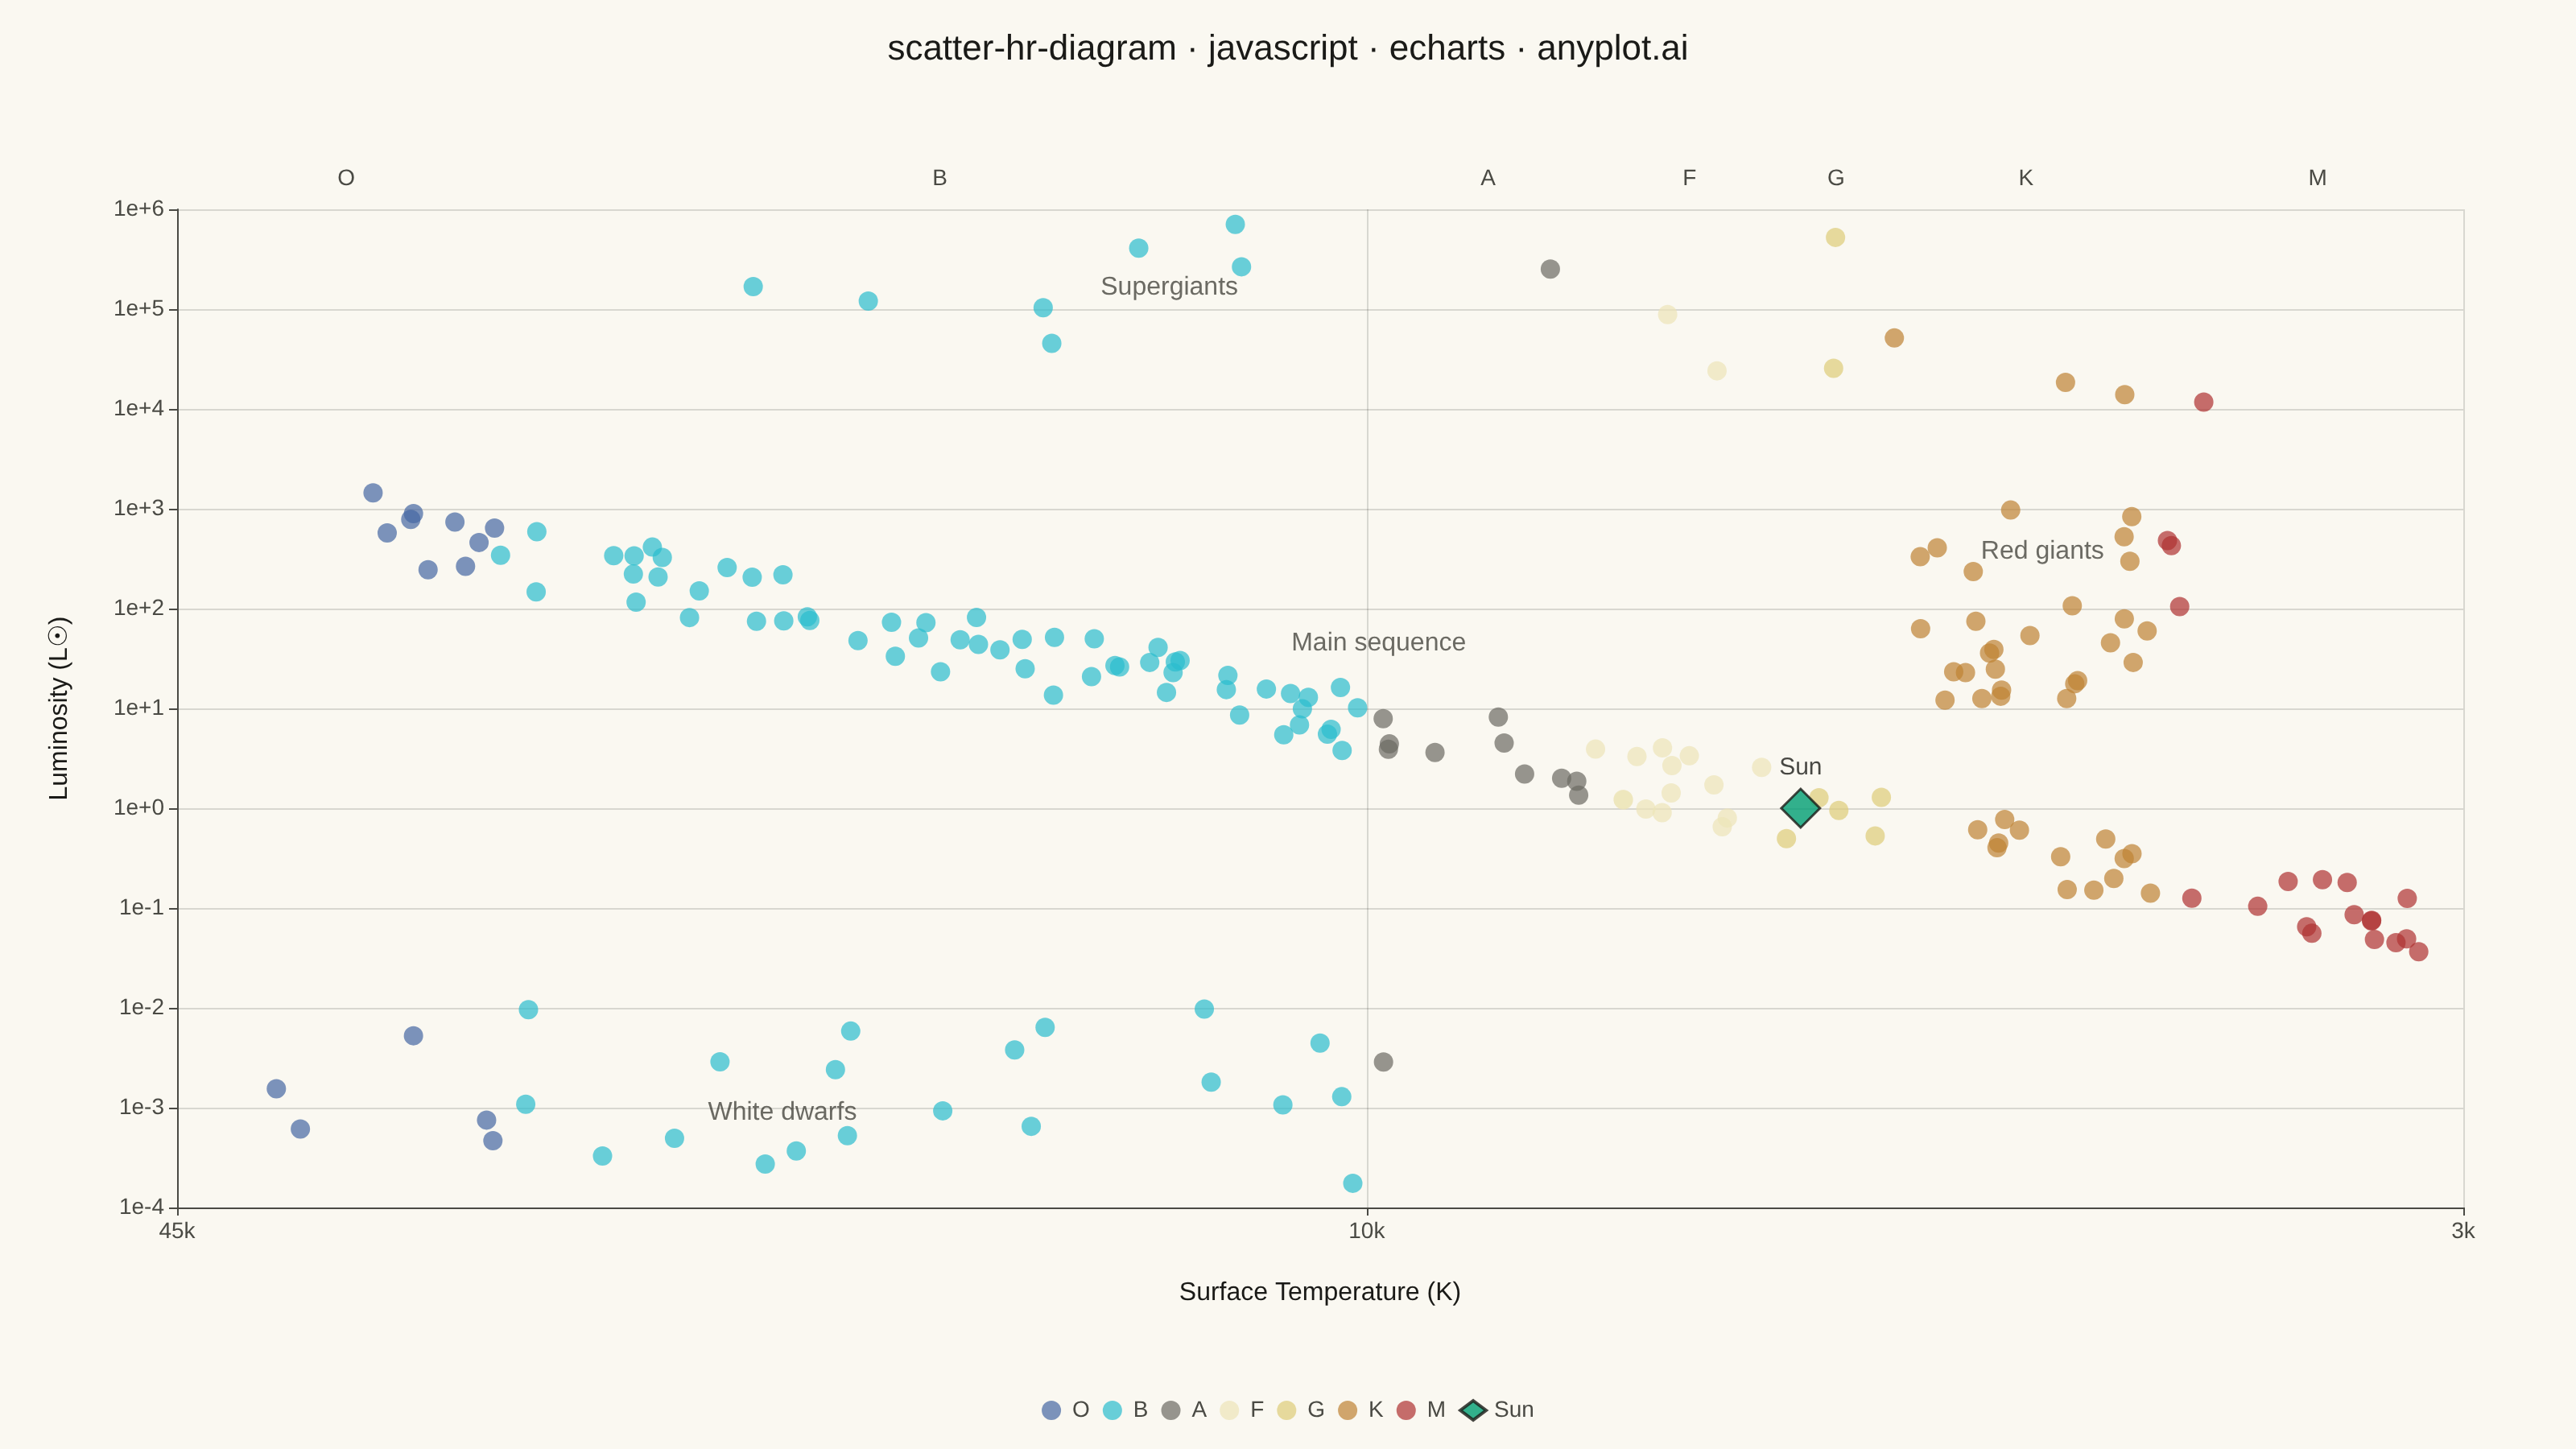
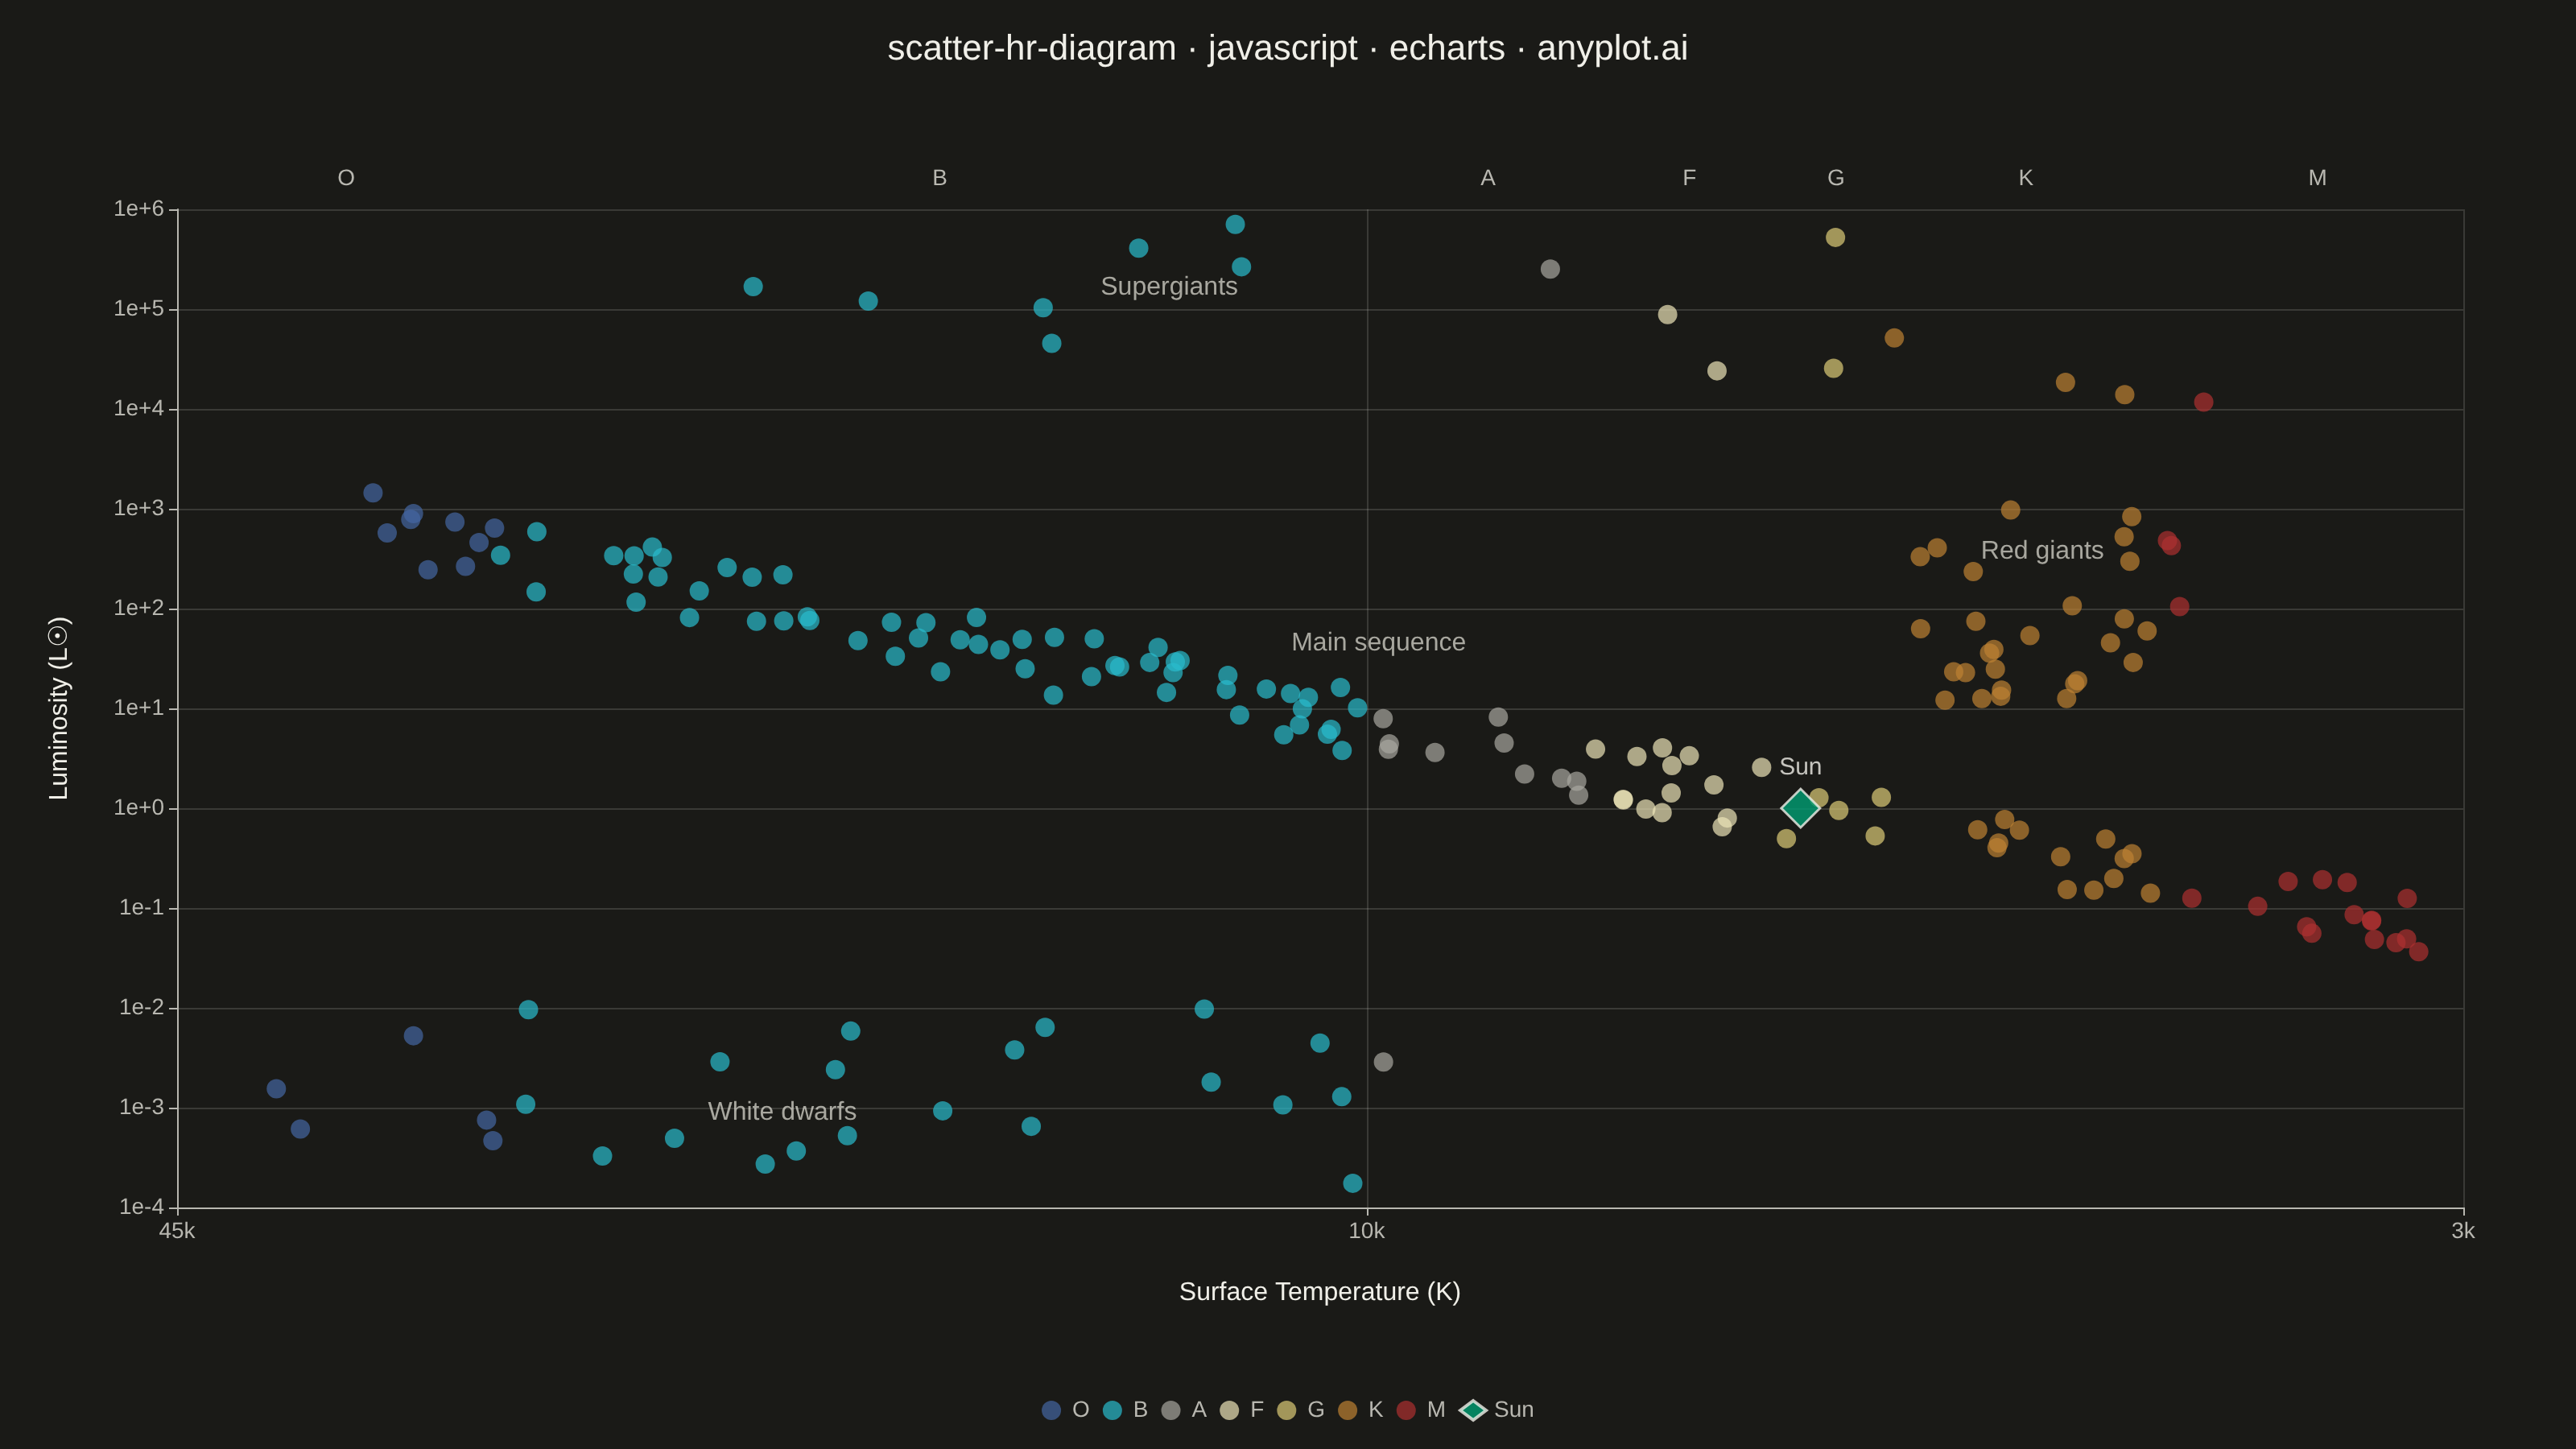
The Hertzsprung-Russell (HR) diagram is the iconic astrophysics scatter plot that shows stellar luminosity (or absolute magnitude) versus surface temperature (or spectral class). Stars naturally cluster along the main sequence diagonal, with distinct regions for red giants, supergiants, and white dwarfs, revealing the fundamental relationship between stellar temperature and brightness.
// anyplot.ai
// scatter-hr-diagram: Hertzsprung-Russell Diagram
// Library: echarts 6.1.0 | JavaScript 22.23.2
// Quality: 91/100 | Created: 2026-08-26

//# anyplot-orientation: landscape
const t = window.ANYPLOT_TOKENS;
const muted = t.theme === "dark" ? "#A8A79F" : "#6B6A63"; // theme-adaptive neutral (Imprint anchor, not exposed via tokens)

// --- Deterministic PRNG (small LCG — the browser has no seeded Math.random) -
let seed = 42;
function rand() {
  seed = (seed * 1664525 + 1013904223) % 4294967296;
  return seed / 4294967296;
}
function uniform(min, max) {
  return min + rand() * (max - min);
}

// --- Spectral classification from surface temperature (Kelvin) -------------
function spectralType(temp) {
  if (temp >= 30000) return "O";
  if (temp >= 10000) return "B";
  if (temp >= 7500) return "A";
  if (temp >= 6000) return "F";
  if (temp >= 5200) return "G";
  if (temp >= 3700) return "K";
  return "M";
}

// --- Data: four HR-diagram regions, temperature (K) vs. luminosity (Lsun) --
const stars = [];

// Main sequence: diagonal band from hot/luminous down to cool/dim.
for (let i = 0; i < 130; i++) {
  const logTemp = uniform(3.3, 4.55);
  const logLum = 3.6 * (logTemp - Math.log10(5778)) + uniform(-0.35, 0.35);
  stars.push({ temp: Math.pow(10, logTemp), lum: Math.pow(10, logLum) });
}

// Red giants: cool surfaces but far more luminous than the main sequence.
for (let i = 0; i < 30; i++) {
  const logTemp = uniform(Math.log10(3500), Math.log10(5000));
  const logLum = uniform(1, 3);
  stars.push({ temp: Math.pow(10, logTemp), lum: Math.pow(10, logLum) });
}

// Supergiants: wide temperature range, extreme luminosity.
for (let i = 0; i < 16; i++) {
  const logTemp = uniform(Math.log10(3200), Math.log10(24000));
  const logLum = uniform(4, 5.85);
  stars.push({ temp: Math.pow(10, logTemp), lum: Math.pow(10, logLum) });
}

// White dwarfs: hot surfaces but tiny, so very faint.
for (let i = 0; i < 26; i++) {
  const logTemp = uniform(Math.log10(8000), Math.log10(40000));
  const logLum = uniform(-3.85, -2);
  stars.push({ temp: Math.pow(10, logTemp), lum: Math.pow(10, logLum) });
}

stars.forEach((star) => {
  star.type = spectralType(star.temp);
});

// --- Color by spectral type, following the conventional stellar palette ----
// (blue-hot O/B -> near-white A -> yellow F/G -> orange K -> red-cool M).
// AMBER_PALE is t.amber lightened toward white: F-type stars are white-yellow,
// one shade paler than G's amber, so the two stay in the same yellow family
// (per the domain-color semantic exception) while remaining distinguishable.
const AMBER_PALE = "#EDE4B8";
const SPEC_ORDER = ["O", "B", "A", "F", "G", "K", "M"];
const SPEC_COLOR = {
  O: t.palette[2], // blue
  B: t.palette[5], // cyan-blue
  A: muted, // near-white
  F: AMBER_PALE, // white-yellow
  G: t.amber, // yellow, Sun-like
  K: t.palette[3], // ochre / orange
  M: t.palette[4], // matte red, coolest
};

const seriesByType = SPEC_ORDER.map((type) => ({
  name: type,
  type: "scatter",
  symbolSize: 12,
  itemStyle: { color: SPEC_COLOR[type], opacity: 0.7 },
  data: stars.filter((star) => star.type === type).map((star) => [star.temp, star.lum]),
}));

// --- The Sun as a distinct reference point ----------------------------------
const sunSeries = {
  name: "Sun",
  type: "scatter",
  symbol: "diamond",
  symbolSize: 24,
  itemStyle: { color: t.palette[0], borderColor: t.ink, borderWidth: 1.5 },
  label: { show: true, formatter: "Sun", position: "top", color: t.ink, fontSize: 15 },
  data: [[5778, 1]],
};

// --- Region labels, positioned via the same log/log domain as the axes -----
// (echarts markPoint text doesn't survive a log-scaled inverse axis reliably,
// so the four region captions are placed directly with the graphic component).
const GRID = { left: 110, top: 130, right: 70, bottom: 150 };
const MOUNT = window.ANYPLOT_SIZE;
const X_DOMAIN = [Math.log10(2500), Math.log10(45000)]; // must match xAxis min/max below
const Y_DOMAIN = [Math.log10(1e-4), Math.log10(1e6)]; // must match yAxis min/max below

function regionLabelPos(temp, lum) {
  const plotW = MOUNT.width - GRID.left - GRID.right;
  const plotH = MOUNT.height - GRID.top - GRID.bottom;
  const fracX = (Math.log10(temp) - X_DOMAIN[0]) / (X_DOMAIN[1] - X_DOMAIN[0]);
  const fracY = (Math.log10(lum) - Y_DOMAIN[0]) / (Y_DOMAIN[1] - Y_DOMAIN[0]);
  return {
    left: GRID.left + (1 - fracX) * plotW, // x-axis is inverse: hot (high temp) sits on the left
    top: GRID.top + (1 - fracY) * plotH, // luminosity increases upward, graphic "top" grows downward
  };
}

const regionLabels = [
  { text: "Main sequence", temp: 11000, lum: 60 },
  { text: "Red giants", temp: 4600, lum: 500 },
  { text: "Supergiants", temp: 14000, lum: 220000 },
  { text: "White dwarfs", temp: 23000, lum: 0.0012 },
].map((region) => ({
  type: "text",
  ...regionLabelPos(region.temp, region.lum),
  style: { text: region.text, fill: muted, fontSize: 16, fontWeight: 500 },
}));

// --- Secondary spectral-class labels, placed at each class's true log-domain
// midpoint (an evenly spaced category axis would misalign against the
// non-uniform temperature boundaries below) -----------------------------------
// Boundaries mirror spectralType() above; keep both in sync.
const SPEC_BOUNDS = {
  O: [30000, 45000],
  B: [10000, 30000],
  A: [7500, 10000],
  F: [6000, 7500],
  G: [5200, 6000],
  K: [3700, 5200],
  M: [2500, 3700],
};

function specTickLeft(low, high) {
  const midTemp = Math.sqrt(low * high); // geometric mean = midpoint in log space
  const plotW = MOUNT.width - GRID.left - GRID.right;
  const fracX = (Math.log10(midTemp) - X_DOMAIN[0]) / (X_DOMAIN[1] - X_DOMAIN[0]);
  return GRID.left + (1 - fracX) * plotW; // x-axis is inverse: hot (high temp) sits on the left
}

const specLabels = SPEC_ORDER.map((type) => ({
  type: "text",
  left: specTickLeft(...SPEC_BOUNDS[type]),
  top: GRID.top - 26,
  style: { text: type, fill: t.inkSoft, fontSize: 14, fontWeight: 500, align: "center" },
}));

// --- Init --------------------------------------------------------------------
const chart = echarts.init(document.getElementById("container"));

// --- Option --------------------------------------------------------------------
chart.setOption({
  animation: false,
  color: t.palette,
  backgroundColor: "transparent",
  title: {
    text: "scatter-hr-diagram · javascript · echarts · anyplot.ai",
    left: "center",
    textStyle: { color: t.ink, fontSize: 22, fontWeight: 500 },
  },
  tooltip: {
    trigger: "item",
    backgroundColor: t.elevatedBg,
    borderColor: t.grid,
    textStyle: { color: t.ink },
    formatter: (p) =>
      p.seriesName === "Sun"
        ? p.seriesName
        : `${p.seriesName}-type<br/>T: ${Math.round(p.value[0])} K<br/>L: ${p.value[1].toFixed(4)} L☉`,
  },
  legend: {
    data: [...SPEC_ORDER, "Sun"],
    bottom: 12,
    textStyle: { color: t.inkSoft, fontSize: 14 },
    itemWidth: 16,
    itemHeight: 12,
  },
  grid: { left: 110, right: 70, top: 130, bottom: 150 },
  xAxis: {
    type: "log",
    inverse: true,
    min: 2500,
    max: 45000,
    name: "Surface Temperature (K)",
    nameLocation: "middle",
    nameGap: 45,
    nameTextStyle: { color: t.ink, fontSize: 16 },
    axisLabel: {
      color: t.inkSoft,
      fontSize: 14,
      formatter: (v) => (v >= 1000 ? `${Math.round(v / 1000)}k` : `${v}`),
    },
    axisLine: { lineStyle: { color: t.inkSoft } },
    splitLine: { lineStyle: { color: t.grid } },
  },
  yAxis: {
    type: "log",
    min: 1e-4,
    max: 1e6,
    name: "Luminosity (L☉)",
    nameLocation: "middle",
    nameGap: 65,
    nameTextStyle: { color: t.ink, fontSize: 16 },
    axisLabel: { color: t.inkSoft, fontSize: 14, formatter: (v) => v.toExponential(0) },
    axisLine: { lineStyle: { color: t.inkSoft } },
    splitLine: { lineStyle: { color: t.grid } },
  },
  series: [...seriesByType, sunSeries],
  graphic: [...regionLabels, ...specLabels],
});
Runnable source as JSON, for any HTTP client: https://api.anyplot.ai/specs/scatter-hr-diagram/echarts/code. Any spec id and library id listed in llms-full.txt fit the same URL shape; every URL below is complete and callable.
{
  "spec_id": "scatter-hr-diagram",
  "language": "javascript",
  "library": "echarts",
  "page": "https://anyplot.ai/scatter-hr-diagram/javascript/echarts",
  "hub": "https://anyplot.ai/scatter-hr-diagram",
  "code_json": "https://api.anyplot.ai/specs/scatter-hr-diagram/echarts/code",
  "spec_json": "https://api.anyplot.ai/specs/scatter-hr-diagram",
  "render_light_png": "https://storage.googleapis.com/anyplot-images/plots/scatter-hr-diagram/javascript/echarts/plot-light.png",
  "render_dark_png": "https://storage.googleapis.com/anyplot-images/plots/scatter-hr-diagram/javascript/echarts/plot-dark.png",
  "interactive_light_html": "https://storage.googleapis.com/anyplot-images/plots/scatter-hr-diagram/javascript/echarts/plot-light.html",
  "interactive_dark_html": "https://storage.googleapis.com/anyplot-images/plots/scatter-hr-diagram/javascript/echarts/plot-dark.html",
  "quality_score": 91.0,
  "license": "MIT",
  "guide": "https://anyplot.ai/llms.txt"
}
Part of Hertzsprung-Russell Diagram on anyplot.ai.