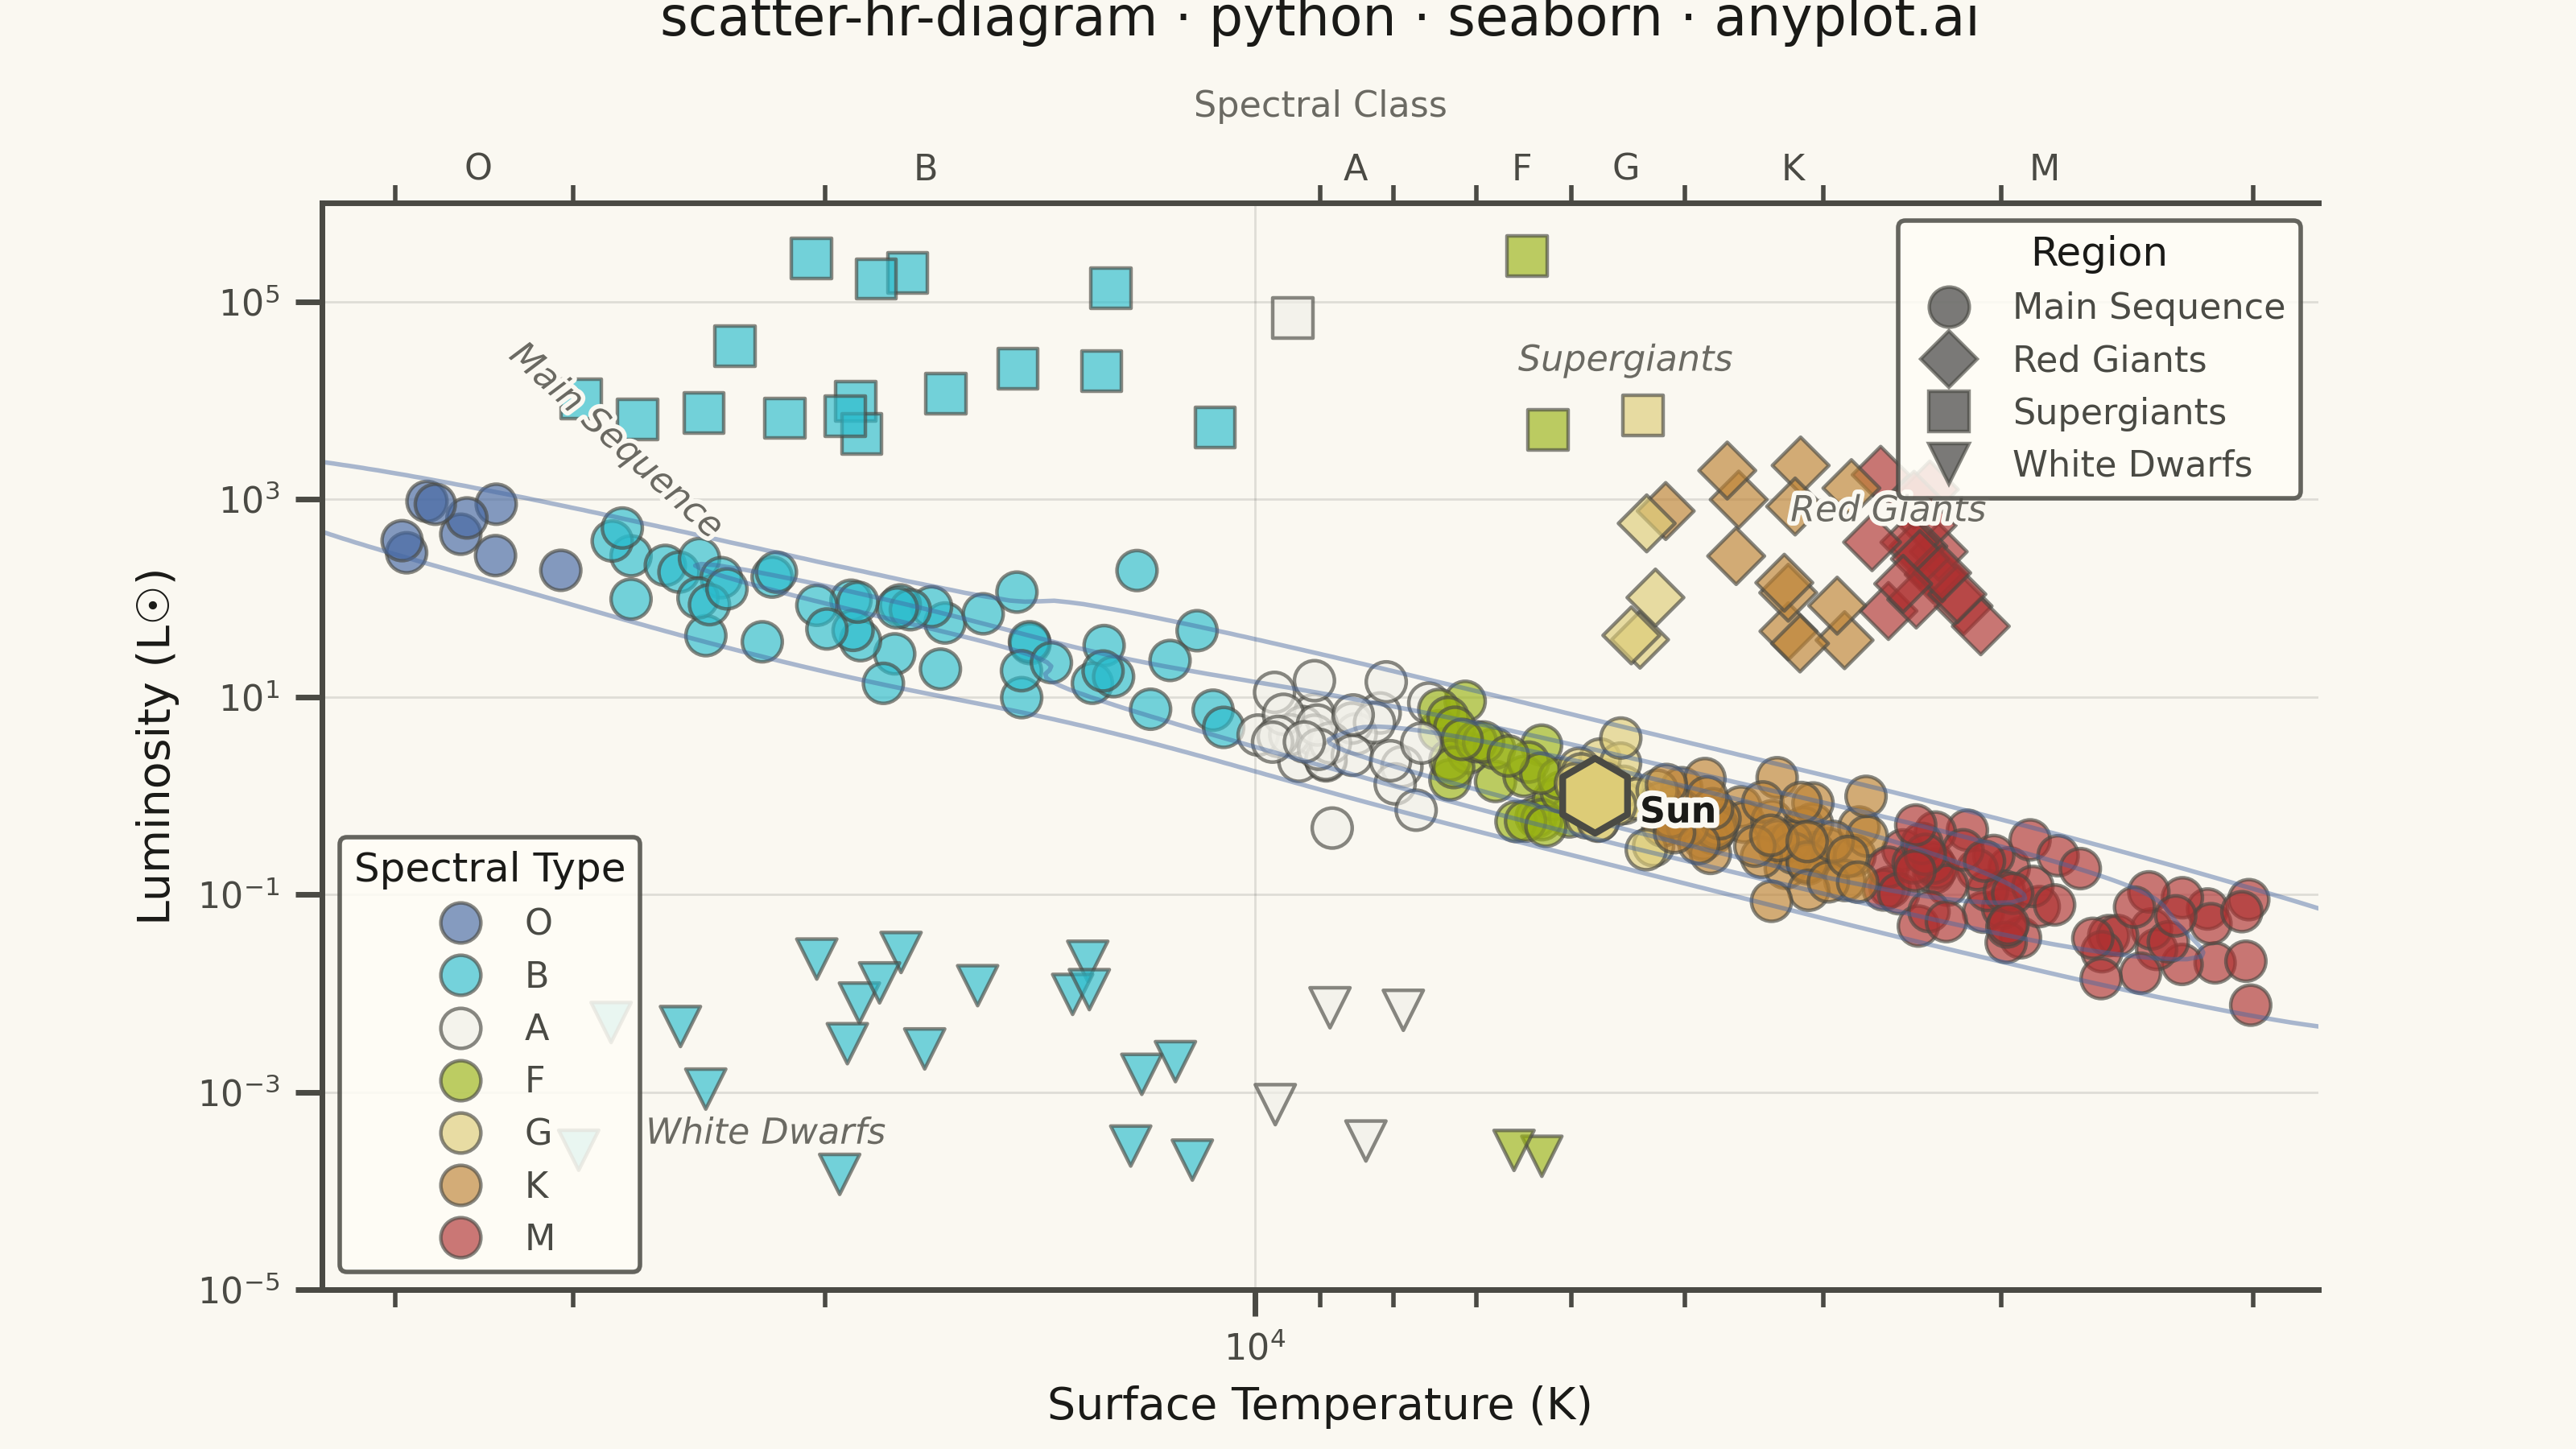
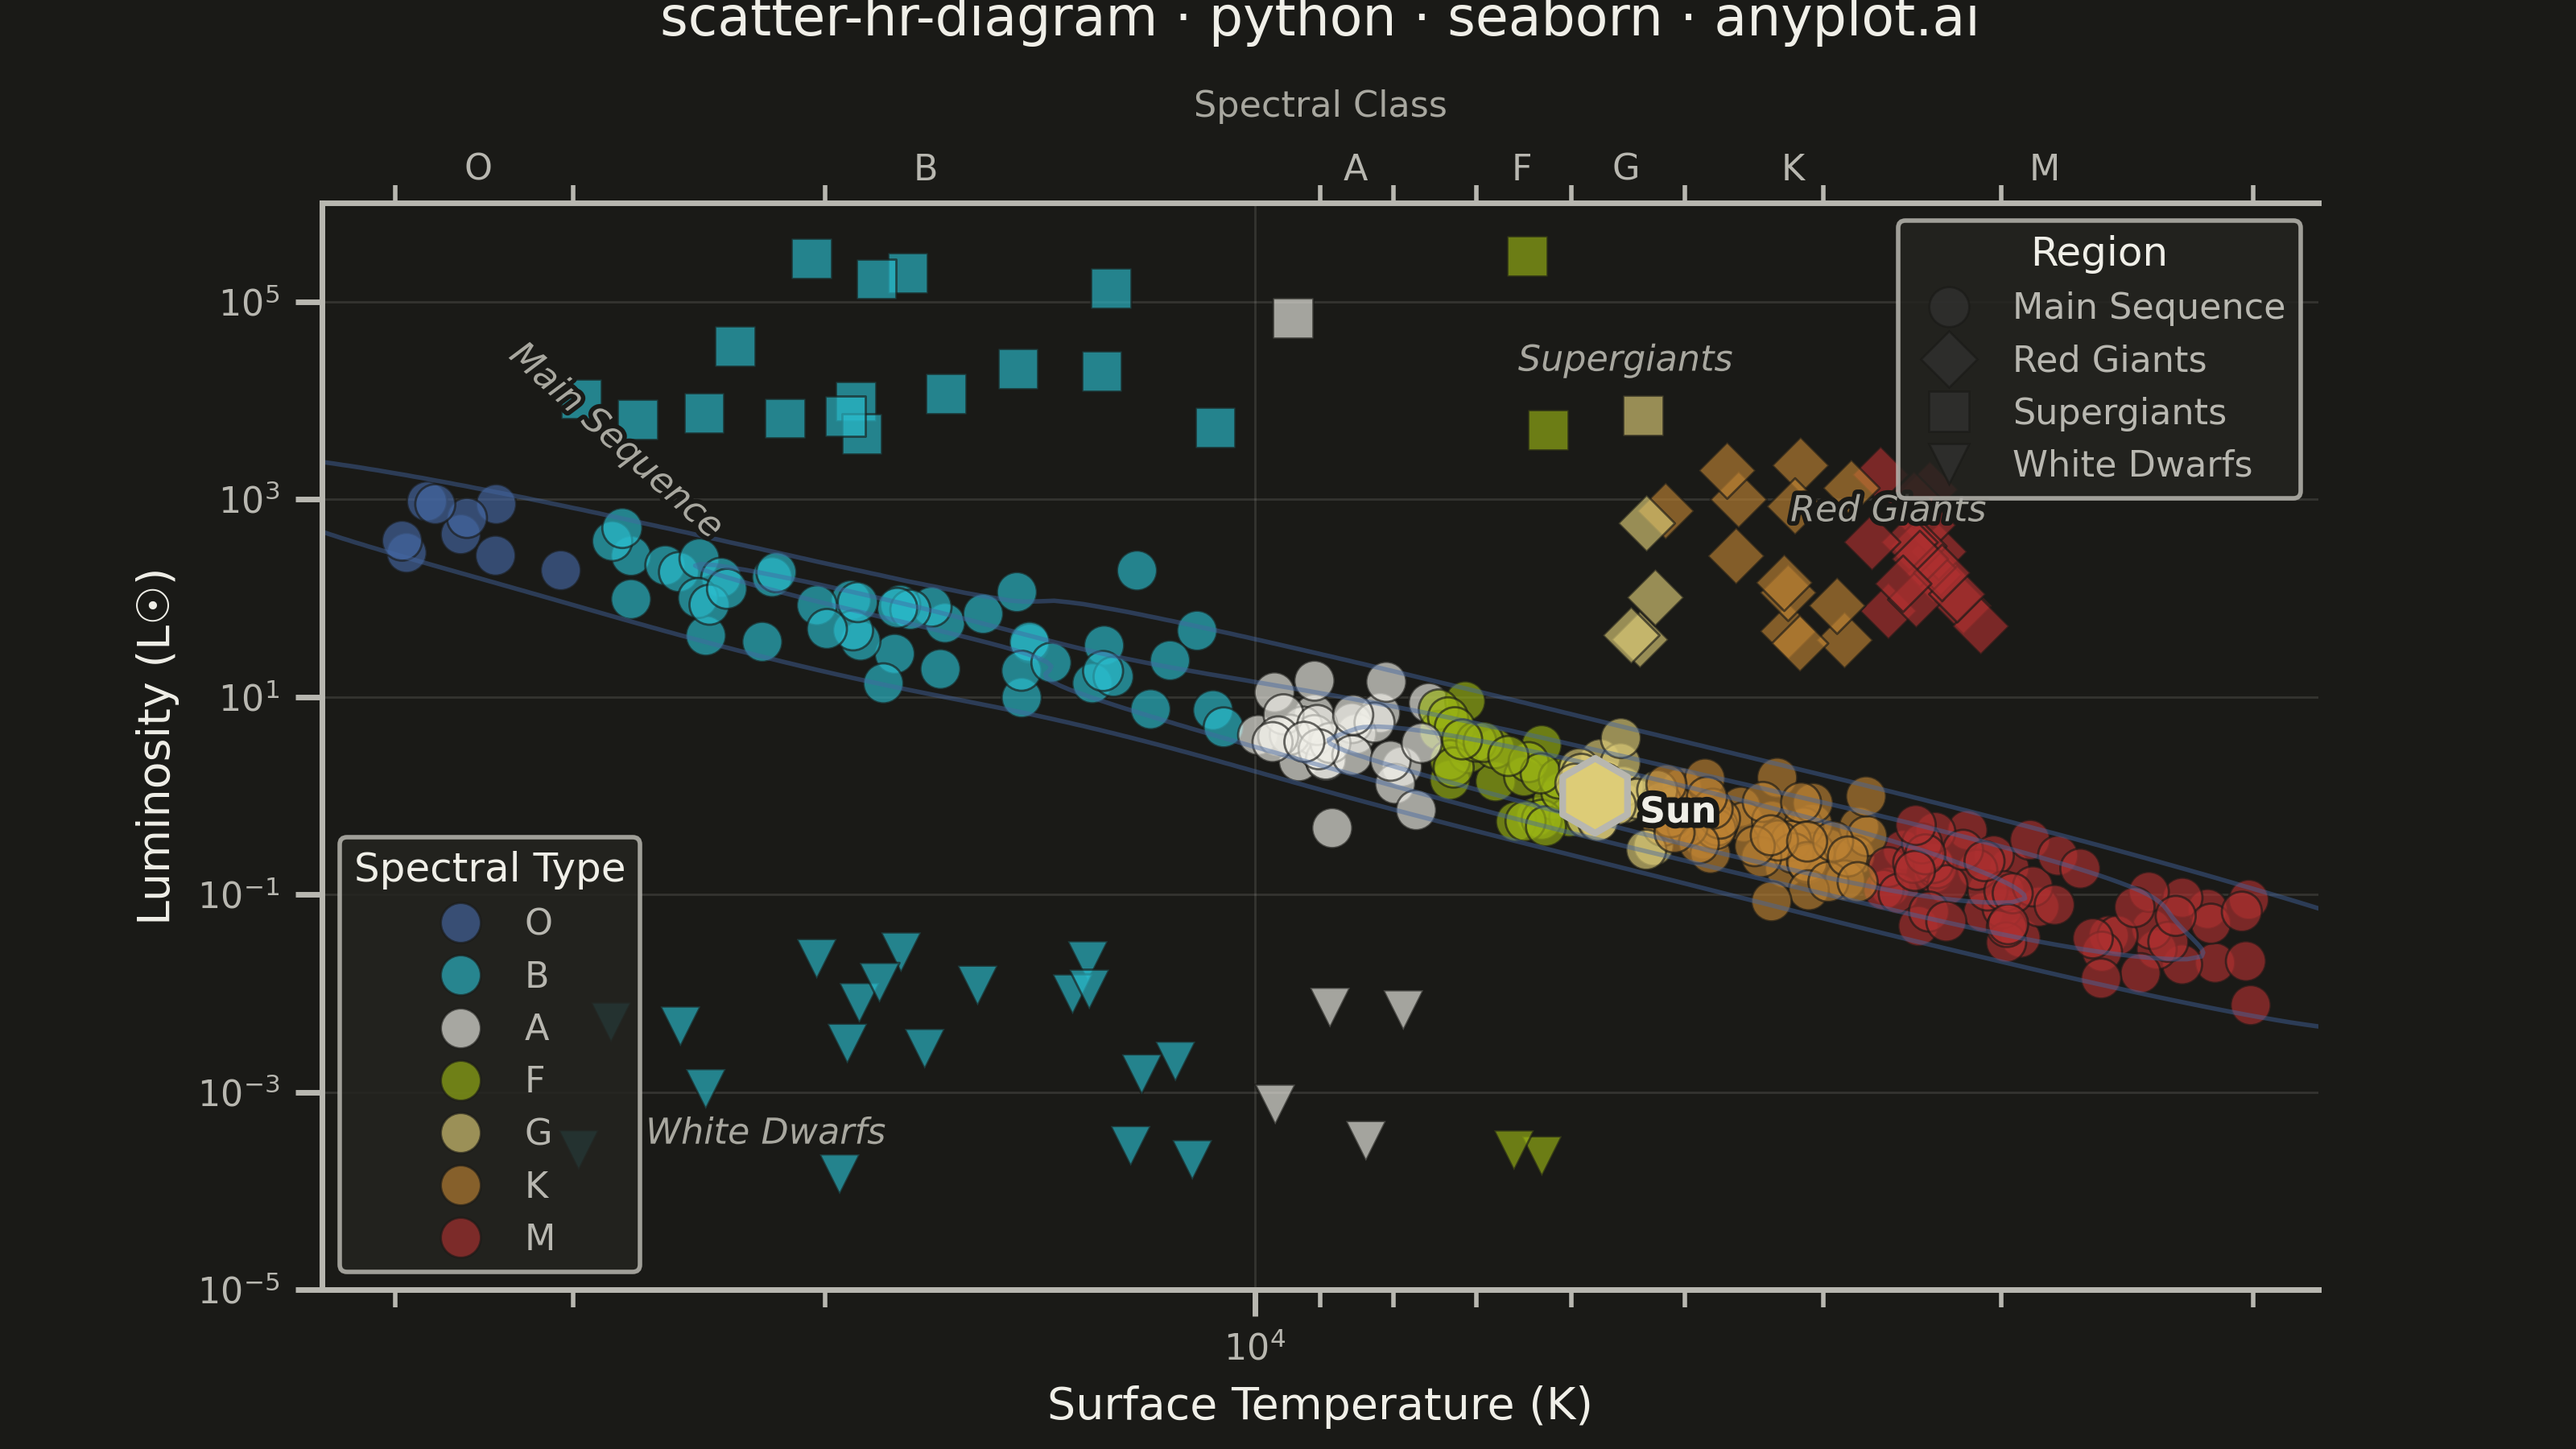
The Hertzsprung-Russell (HR) diagram is the iconic astrophysics scatter plot that shows stellar luminosity (or absolute magnitude) versus surface temperature (or spectral class). Stars naturally cluster along the main sequence diagonal, with distinct regions for red giants, supergiants, and white dwarfs, revealing the fundamental relationship between stellar temperature and brightness.
""" anyplot.ai
scatter-hr-diagram: Hertzsprung-Russell Diagram
Library: seaborn 0.13.2 | Python 3.13.13
Quality: 89/100 | Updated: 2026-06-02
"""

import os
import sys


# Prevent script directory from shadowing stdlib (matplotlib.py sibling in same dir)
_here = os.path.dirname(os.path.abspath(__file__))
sys.path = [p for p in sys.path if os.path.abspath(p or ".") != _here]

import matplotlib.patheffects as pe
import matplotlib.pyplot as plt
import numpy as np
import pandas as pd
import seaborn as sns


# Theme tokens
THEME = os.getenv("ANYPLOT_THEME", "light")
PAGE_BG = "#FAF8F1" if THEME == "light" else "#1A1A17"
ELEVATED_BG = "#FFFDF6" if THEME == "light" else "#242420"
INK = "#1A1A17" if THEME == "light" else "#F0EFE8"
INK_SOFT = "#4A4A44" if THEME == "light" else "#B8B7B0"
INK_MUTED = "#6B6A63" if THEME == "light" else "#A8A79F"

# Spectral type colors: astrophysical convention mapped to closest Imprint palette members.
# O-type (first categorical series) uses #4467A3 (Imprint blue) — O/B-type stars are blue-hot;
# using brand green #009E73 as first-series default would violate the strong spectral convention.
# A-type uses #F0EFE8 (Imprint near-white anchor); marker edge coloring provides contrast on light bg.
# F-type uses #99B314 (Imprint lime) as closest warm Imprint member to white-yellow F stars.
spectral_colors = {
    "O": "#4467A3",  # Imprint blue — hottest stars; first-series #009E73 exception: spectral convention
    "B": "#2ABCCD",  # Imprint cyan — hot blue stars
    "A": "#F0EFE8",  # Imprint near-white anchor — blue-white A-type; edges provide contrast
    "F": "#99B314",  # Imprint lime — warm-white F-type, closest warm Imprint member
    "G": "#DDCC77",  # Imprint amber — solar yellow, exact astrophysical convention match
    "K": "#BD8233",  # Imprint ochre — orange-brown K-type
    "M": "#AE3030",  # Imprint matte red — cool red M-type, exact convention match
}

# Theme-adaptive edge: dark outline on light bg for pale stars, page bg on dark
EDGE_COLOR = INK_SOFT if THEME == "light" else PAGE_BG
EDGE_WIDTH = 0.8 if THEME == "light" else 0.5

sns.set_theme(
    style="ticks",
    rc={
        "figure.facecolor": PAGE_BG,
        "axes.facecolor": PAGE_BG,
        "axes.edgecolor": INK_SOFT,
        "axes.labelcolor": INK,
        "text.color": INK,
        "xtick.color": INK_SOFT,
        "ytick.color": INK_SOFT,
        "grid.color": INK,
        "grid.alpha": 0.12,
        "grid.linewidth": 0.5,
        "legend.facecolor": ELEVATED_BG,
        "legend.edgecolor": INK_SOFT,
    },
)

# Data
np.random.seed(42)

main_seq_temp = np.concatenate(
    [
        np.random.uniform(25000, 40000, 15),
        np.random.uniform(10000, 25000, 40),
        np.random.uniform(6000, 10000, 60),
        np.random.uniform(3500, 6000, 80),
        np.random.uniform(2000, 3500, 55),
    ]
)
main_seq_lum = 10 ** (np.log10(main_seq_temp / 5778) * 3.5 + np.random.normal(0, 0.3, len(main_seq_temp)))

rg_temp = np.random.uniform(3000, 5500, 35)
rg_lum = 10 ** np.random.uniform(1.5, 3.5, 35)

sg_temp = np.random.uniform(3000, 30000, 20)
sg_lum = 10 ** np.random.uniform(3.5, 5.5, 20)

wd_temp = np.random.uniform(5000, 30000, 25)
wd_lum = 10 ** np.random.uniform(-4, -1.5, 25)

temperatures = np.concatenate([main_seq_temp, rg_temp, sg_temp, wd_temp])
luminosities = np.concatenate([main_seq_lum, rg_lum, sg_lum, wd_lum])
regions = (
    ["Main Sequence"] * len(main_seq_temp)
    + ["Red Giants"] * len(rg_temp)
    + ["Supergiants"] * len(sg_temp)
    + ["White Dwarfs"] * len(wd_temp)
)

spectral_types = np.select(
    [
        temperatures >= 30000,
        temperatures >= 10000,
        temperatures >= 7500,
        temperatures >= 6000,
        temperatures >= 5200,
        temperatures >= 3700,
    ],
    ["O", "B", "A", "F", "G", "K"],
    default="M",
)

df = pd.DataFrame(
    {
        "Temperature (K)": temperatures,
        "Luminosity (L☉)": luminosities,
        "Region": regions,
        "Spectral Type": spectral_types,
    }
)

# Plot — figsize=(8, 4.5) at dpi=400 → exactly 3200×1800 px
fig, ax = plt.subplots(figsize=(8, 4.5), dpi=400, facecolor=PAGE_BG)
ax.set_facecolor(PAGE_BG)
fig.subplots_adjust(top=0.86)  # breathing room for secondary spectral-class axis + title

spectral_order = ["O", "B", "A", "F", "G", "K", "M"]
palette = [spectral_colors[s] for s in spectral_order]

region_markers = {"Main Sequence": "o", "Red Giants": "D", "Supergiants": "s", "White Dwarfs": "v"}

sns.scatterplot(
    data=df,
    x="Temperature (K)",
    y="Luminosity (L☉)",
    hue="Spectral Type",
    hue_order=spectral_order,
    palette=palette,
    style="Region",
    markers=region_markers,
    s=80,
    alpha=0.65,
    edgecolor=EDGE_COLOR,
    linewidth=EDGE_WIDTH,
    ax=ax,
    legend="full",
)

# KDE density contours along the main sequence — Imprint blue, seaborn distinctive feature
ms_df = df[df["Region"] == "Main Sequence"]
sns.kdeplot(
    data=ms_df,
    x="Temperature (K)",
    y="Luminosity (L☉)",
    levels=4,
    color="#4467A3",
    alpha=0.45,
    linewidths=1.0,
    ax=ax,
    log_scale=True,
)

# Sun reference — hexagon marker differentiates this impl from other library implementations
ax.scatter(5778, 1, s=280, color="#DDCC77", edgecolors=INK_SOFT, linewidth=1.5, zorder=10, marker="h")
ax.annotate(
    "Sun",
    (5778, 1),
    textcoords="offset points",
    xytext=(10, -6),
    fontsize=8,
    color=INK,
    fontweight="bold",
    path_effects=[pe.withStroke(linewidth=2.5, foreground=PAGE_BG)],
)

# Region labels — positioned in sparsely occupied zones to avoid KDE overlap
text_style = {
    "fontsize": 8,
    "color": INK_MUTED,
    "fontstyle": "italic",
    "path_effects": [pe.withStroke(linewidth=2, foreground=PAGE_BG)],
}
ax.text(5500, 2e4, "Supergiants", ha="center", **text_style)
ax.text(3600, 600, "Red Giants", ha="center", **text_style)
ax.text(22000, 3e-4, "White Dwarfs", ha="center", **text_style)
# Main Sequence label placed in sparse upper-left region of the diagonal (O/B star zone)
ax.text(28000, 400, "Main Sequence", ha="center", rotation=-42, **text_style)

# Style — log scale, reversed x-axis per astrophysical convention
ax.set_xscale("log")
ax.set_yscale("log")
ax.invert_xaxis()
ax.set_xlim(45000, 1800)
ax.set_ylim(1e-5, 1e6)

title = "scatter-hr-diagram · python · seaborn · anyplot.ai"
ax.set_xlabel("Surface Temperature (K)", fontsize=10, color=INK)
ax.set_ylabel("Luminosity (L☉)", fontsize=10, color=INK)
ax.set_title(title, fontsize=12, fontweight="medium", color=INK, pad=12)
ax.tick_params(axis="both", labelsize=8, colors=INK_SOFT)

ax.spines["top"].set_visible(False)
ax.spines["right"].set_visible(False)
for s in ("left", "bottom"):
    ax.spines[s].set_color(INK_SOFT)

ax.yaxis.grid(True, alpha=0.12, linewidth=0.5, color=INK)
ax.xaxis.grid(True, alpha=0.12, linewidth=0.5, color=INK)

# Secondary spectral class axis
spec_boundaries = {"O": 35000, "B": 17000, "A": 8500, "F": 6500, "G": 5500, "K": 4200, "M": 2800}
ax2 = ax.twiny()
ax2.set_xscale("log")
ax2.set_xlim(ax.get_xlim())
ax2.set_xticks(list(spec_boundaries.values()))
ax2.set_xticklabels(list(spec_boundaries.keys()))
ax2.tick_params(axis="x", labelsize=8, colors=INK_SOFT, length=0)
ax2.spines["top"].set_color(INK_SOFT)
ax2.spines["right"].set_visible(False)
ax2.set_xlabel("Spectral Class", fontsize=8, color=INK_MUTED, labelpad=8)

# Separate spectral type and region legends
handles, labels = ax.get_legend_handles_labels()
spectral_handles = [(h, lab) for h, lab in zip(handles, labels, strict=False) if lab in spectral_order]
region_handles = [(h, lab) for h, lab in zip(handles, labels, strict=False) if lab in region_markers]

leg1 = ax.legend(
    [h for h, _ in spectral_handles],
    [lab for _, lab in spectral_handles],
    title="Spectral Type",
    fontsize=8,
    title_fontsize=9,
    loc="lower left",
    framealpha=0.85,
    facecolor=ELEVATED_BG,
    edgecolor=INK_SOFT,
    labelcolor=INK_SOFT,
)
leg1.get_title().set_color(INK)

leg2 = ax.legend(
    [h for h, _ in region_handles],
    [lab for _, lab in region_handles],
    title="Region",
    fontsize=8,
    title_fontsize=9,
    loc="upper right",
    framealpha=0.85,
    facecolor=ELEVATED_BG,
    edgecolor=INK_SOFT,
    labelcolor=INK_SOFT,
)
leg2.get_title().set_color(INK)
ax.add_artist(leg1)

# Save — bbox_inches must stay default (None) to preserve exact 3200×1800 px
plt.savefig(f"plot-{THEME}.png", dpi=400, facecolor=PAGE_BG)
Runnable source as JSON, for any HTTP client: https://api.anyplot.ai/specs/scatter-hr-diagram/seaborn/code. Any spec id and library id listed in llms-full.txt fit the same URL shape; every URL below is complete and callable.
{
  "spec_id": "scatter-hr-diagram",
  "language": "python",
  "library": "seaborn",
  "page": "https://anyplot.ai/scatter-hr-diagram/python/seaborn",
  "hub": "https://anyplot.ai/scatter-hr-diagram",
  "code_json": "https://api.anyplot.ai/specs/scatter-hr-diagram/seaborn/code",
  "spec_json": "https://api.anyplot.ai/specs/scatter-hr-diagram",
  "render_light_png": "https://storage.googleapis.com/anyplot-images/plots/scatter-hr-diagram/python/seaborn/plot-light.png",
  "render_dark_png": "https://storage.googleapis.com/anyplot-images/plots/scatter-hr-diagram/python/seaborn/plot-dark.png",
  "quality_score": 89.0,
  "license": "MIT",
  "guide": "https://anyplot.ai/llms.txt"
}
Part of Hertzsprung-Russell Diagram on anyplot.ai.