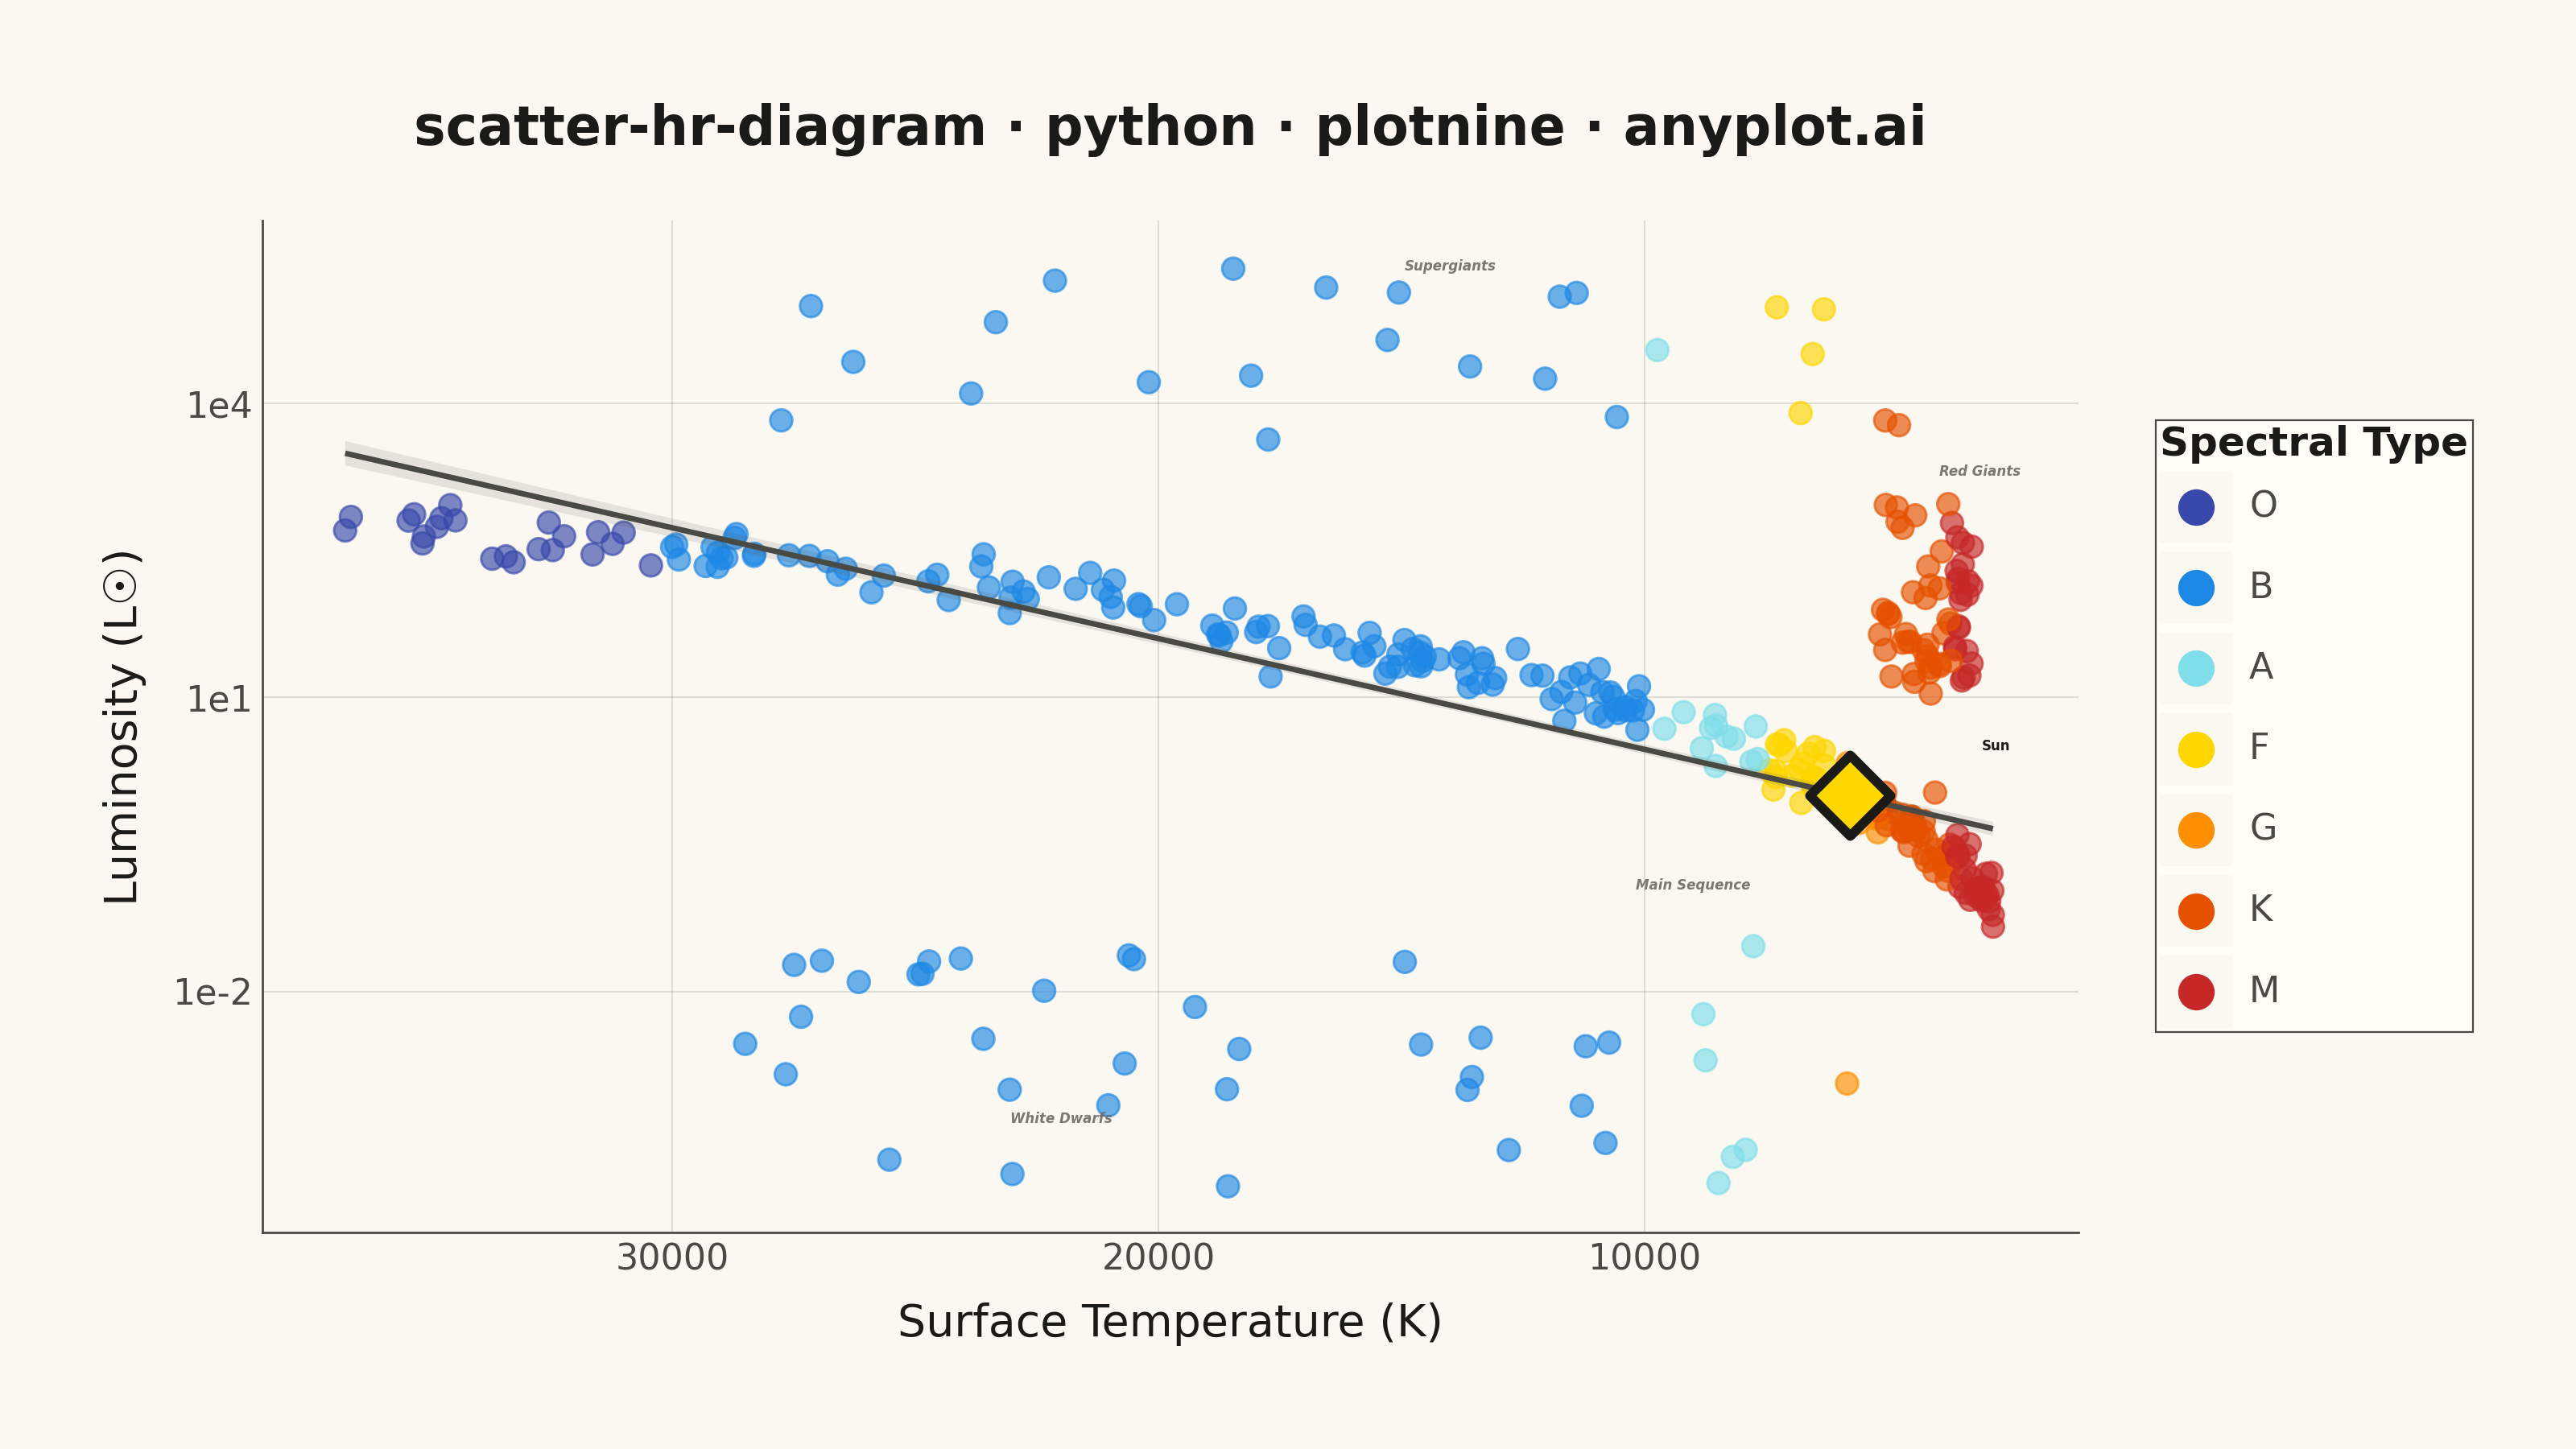
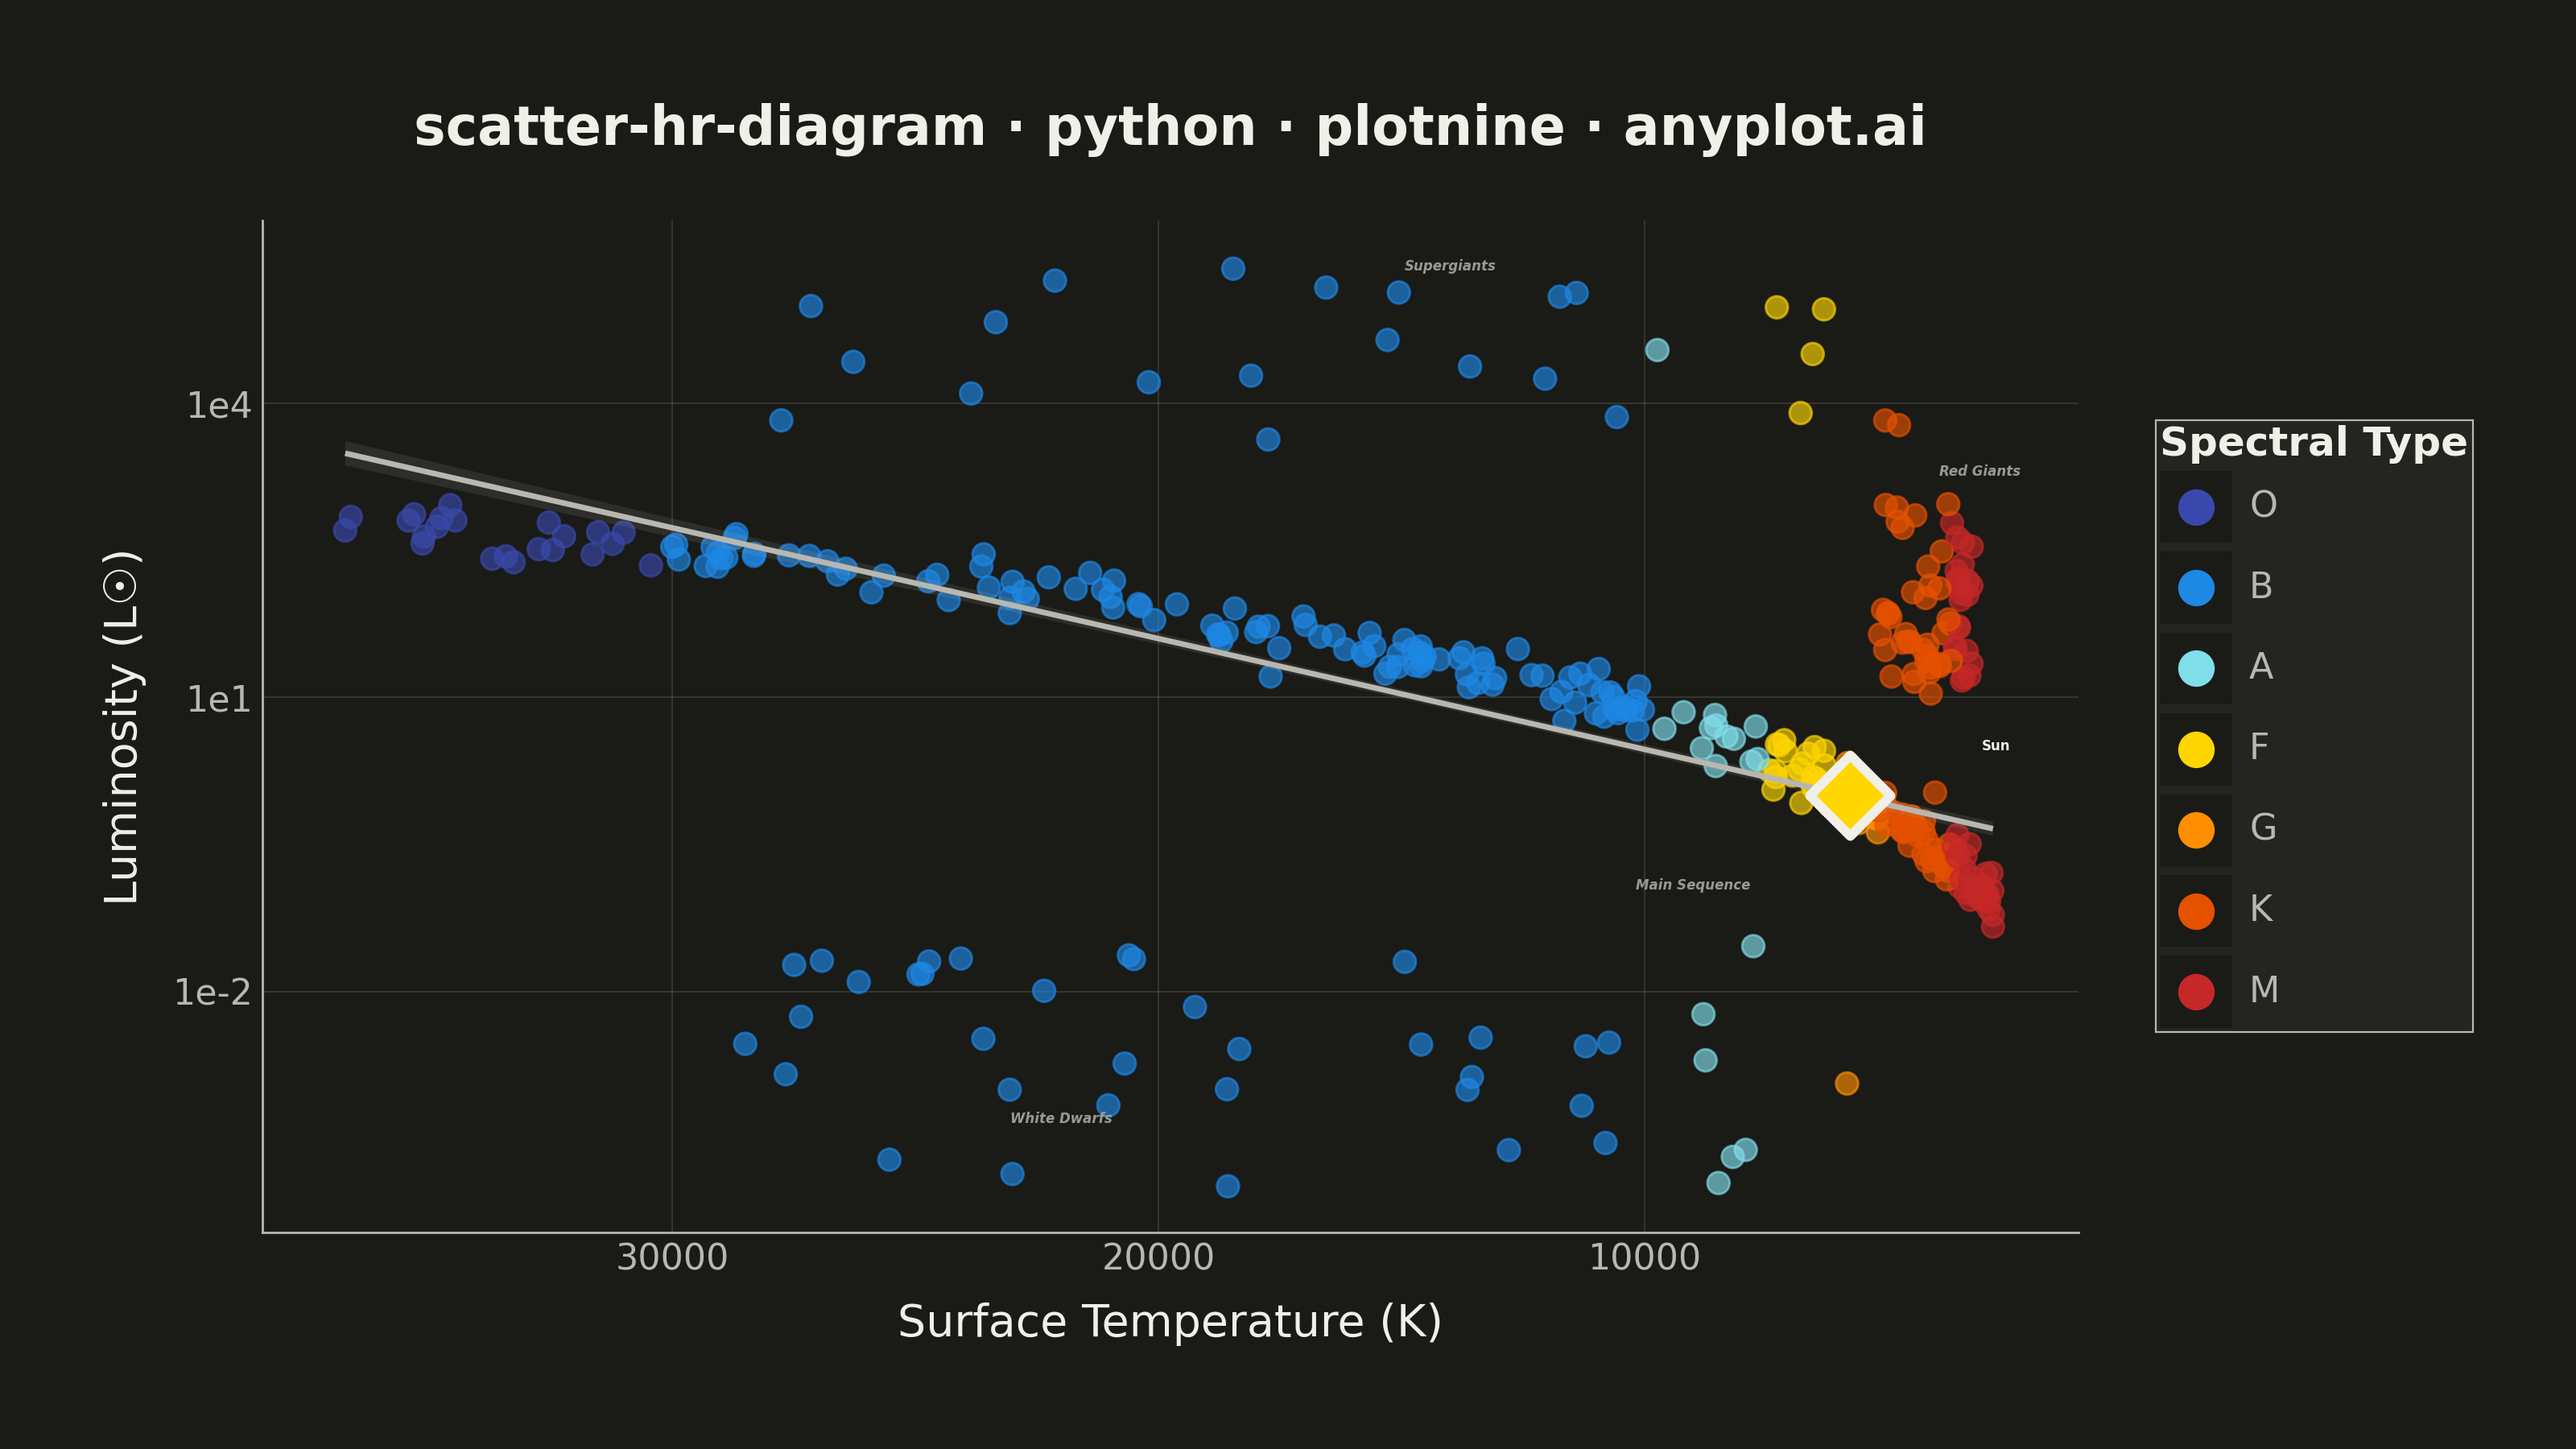
The Hertzsprung-Russell (HR) diagram is the iconic astrophysics scatter plot that shows stellar luminosity (or absolute magnitude) versus surface temperature (or spectral class). Stars naturally cluster along the main sequence diagonal, with distinct regions for red giants, supergiants, and white dwarfs, revealing the fundamental relationship between stellar temperature and brightness.
""" anyplot.ai
scatter-hr-diagram: Hertzsprung-Russell Diagram
Library: plotnine 0.15.4 | Python 3.13.13
Quality: 85/100 | Updated: 2026-06-02
"""

import os
import sys


# Prevent this file from shadowing the plotnine library when run by name
_this_dir = os.path.dirname(os.path.abspath(__file__))
if _this_dir in sys.path:
    sys.path.remove(_this_dir)

import numpy as np
import pandas as pd
from plotnine import (
    aes,
    annotate,
    element_blank,
    element_line,
    element_rect,
    element_text,
    geom_point,
    geom_smooth,
    geom_text,
    ggplot,
    guide_legend,
    guides,
    labs,
    scale_color_manual,
    scale_x_reverse,
    scale_y_log10,
    theme,
    theme_minimal,
)


THEME = os.getenv("ANYPLOT_THEME", "light")

PAGE_BG = "#FAF8F1" if THEME == "light" else "#1A1A17"
ELEVATED_BG = "#FFFDF6" if THEME == "light" else "#242420"
INK = "#1A1A17" if THEME == "light" else "#F0EFE8"
INK_SOFT = "#4A4A44" if THEME == "light" else "#B8B7B0"
INK_MUTED = "#6B6A63" if THEME == "light" else "#A8A79F"

# Data — Imprint palette not used here: spectral type colors follow domain convention
# (blue for O/B, white/cyan for A, yellow-white for F, golden for G, orange K, red M)
np.random.seed(42)

# Main sequence: L ~ T^3.5 (approx), with scatter
n_main = 250
main_log_temp = np.random.uniform(np.log10(2800), np.log10(38000), n_main)
main_temp = 10**main_log_temp
main_log_lum = 3.5 * (main_log_temp - np.log10(5778)) + np.random.normal(0, 0.15, n_main)
main_lum = 10**main_log_lum

# Red giants (cool but luminous)
n_giants = 60
giant_temp = np.random.uniform(3200, 5200, n_giants)
giant_lum = 10 ** np.random.uniform(1.0, 3.0, n_giants)

# Supergiants (very luminous, broad temp range)
n_super = 25
super_temp = np.random.uniform(3500, 28000, n_super)
super_lum = 10 ** np.random.uniform(3.5, 5.5, n_super)

# White dwarfs (hot but very dim)
n_wd = 40
wd_temp = np.random.uniform(5000, 30000, n_wd)
wd_lum = 10 ** np.random.uniform(-4, -1.5, n_wd)

# Conventional spectral-type palette — all 7 types visually distinct on both themes
spectral_colors = {
    "O": "#3949AB",  # medium indigo (> 30 000 K) — visible on dark bg
    "B": "#1E88E5",  # medium blue (10 000 – 30 000 K)
    "A": "#80DEEA",  # light cyan (7 500 – 10 000 K) — clearly different from B
    "F": "#FFD600",  # bright yellow (6 000 – 7 500 K) — visible on cream, different from G
    "G": "#FF8F00",  # deep amber (5 200 – 6 000 K) — clearly different from F
    "K": "#E65100",  # deep orange (3 700 – 5 200 K)
    "M": "#C62828",  # crimson red (< 3 700 K)
}

temperatures = np.concatenate([main_temp, giant_temp, super_temp, wd_temp])
luminosities = np.concatenate([main_lum, giant_lum, super_lum, wd_lum])
regions = ["Main Sequence"] * n_main + ["Red Giants"] * n_giants + ["Supergiants"] * n_super + ["White Dwarfs"] * n_wd

spectral_bins = [0, 3700, 5200, 6000, 7500, 10000, 30000, np.inf]
spectral_labels = ["M", "K", "G", "F", "A", "B", "O"]
spectral = pd.cut(temperatures, bins=spectral_bins, labels=spectral_labels, ordered=False)

df = pd.DataFrame(
    {
        "temperature": temperatures,
        "luminosity": luminosities,
        "region": regions,
        "spectral_type": pd.Categorical(spectral, categories=["O", "B", "A", "F", "G", "K", "M"]),
    }
)

# Sun reference
sun = pd.DataFrame({"temperature": [5778], "luminosity": [1.0], "label": ["Sun"]})

# Plot
plot = (
    ggplot(df, aes(x="temperature", y="luminosity", color="spectral_type"))
    + geom_point(size=2.5, alpha=0.65, stroke=0.3)
    + geom_smooth(
        data=df[df["region"] == "Main Sequence"],
        mapping=aes(x="temperature", y="luminosity"),
        method="lm",
        color=INK_SOFT,
        fill=INK_SOFT,
        alpha=0.12,
        size=0.7,
        inherit_aes=False,
    )
    + geom_point(
        data=sun,
        mapping=aes(x="temperature", y="luminosity"),
        color=INK,
        fill="#FFD700",
        size=6,
        shape="D",
        stroke=1.2,
        inherit_aes=False,
    )
    + geom_text(
        data=sun,
        mapping=aes(x="temperature", y="luminosity", label="label"),
        color=INK,
        size=3,
        nudge_x=3000,
        nudge_y=0.5,
        inherit_aes=False,
        fontweight="bold",
    )
    + annotate(
        "text",
        x=9000,
        y=0.12,
        label="Main Sequence",
        color=INK_MUTED,
        size=3,
        fontstyle="italic",
        fontweight="bold",
        alpha=0.9,
    )
    + annotate(
        "text",
        x=3100,
        y=2000,
        label="Red Giants",
        color=INK_MUTED,
        size=3,
        fontstyle="italic",
        fontweight="bold",
        alpha=0.9,
    )
    + annotate(
        "text",
        x=14000,
        y=250000,
        label="Supergiants",
        color=INK_MUTED,
        size=3,
        fontstyle="italic",
        fontweight="bold",
        alpha=0.9,
    )
    + annotate(
        "text",
        x=22000,
        y=0.0005,
        label="White Dwarfs",
        color=INK_MUTED,
        size=3,
        fontstyle="italic",
        fontweight="bold",
        alpha=0.9,
    )
    + scale_x_reverse()
    + scale_y_log10()
    + scale_color_manual(values=spectral_colors, name="Spectral Type")
    + labs(
        x="Surface Temperature (K)", y="Luminosity (L☉)", title="scatter-hr-diagram · python · plotnine · anyplot.ai"
    )
    + guides(color=guide_legend(override_aes={"size": 4, "alpha": 1}))
    + theme_minimal()
    + theme(
        figure_size=(8, 4.5),
        plot_title=element_text(size=12, weight="bold", color=INK, margin={"b": 8}),
        axis_title=element_text(size=10, color=INK),
        axis_text=element_text(size=8, color=INK_SOFT),
        legend_title=element_text(size=9, weight="bold", color=INK),
        legend_text=element_text(size=8, color=INK_SOFT),
        legend_position="right",
        legend_background=element_rect(fill=ELEVATED_BG, color=INK_SOFT, size=0.4),
        legend_key=element_rect(fill=PAGE_BG, color="none"),
        panel_grid_minor=element_blank(),
        panel_grid_major=element_line(color=INK, size=0.3, alpha=0.15),
        panel_background=element_rect(fill=PAGE_BG, color="none"),
        plot_background=element_rect(fill=PAGE_BG, color=PAGE_BG),
        panel_border=element_blank(),
        axis_line=element_line(color=INK_SOFT, size=0.5),
        plot_margin=0.04,
    )
)

# Save
plot.save(f"plot-{THEME}.png", dpi=400, width=8, height=4.5, units="in", verbose=False)
Runnable source as JSON, for any HTTP client: https://api.anyplot.ai/specs/scatter-hr-diagram/plotnine/code. Any spec id and library id listed in llms-full.txt fit the same URL shape; every URL below is complete and callable.
{
  "spec_id": "scatter-hr-diagram",
  "language": "python",
  "library": "plotnine",
  "page": "https://anyplot.ai/scatter-hr-diagram/python/plotnine",
  "hub": "https://anyplot.ai/scatter-hr-diagram",
  "code_json": "https://api.anyplot.ai/specs/scatter-hr-diagram/plotnine/code",
  "spec_json": "https://api.anyplot.ai/specs/scatter-hr-diagram",
  "render_light_png": "https://storage.googleapis.com/anyplot-images/plots/scatter-hr-diagram/python/plotnine/plot-light.png",
  "render_dark_png": "https://storage.googleapis.com/anyplot-images/plots/scatter-hr-diagram/python/plotnine/plot-dark.png",
  "quality_score": 85.0,
  "license": "MIT",
  "guide": "https://anyplot.ai/llms.txt"
}
Part of Hertzsprung-Russell Diagram on anyplot.ai.