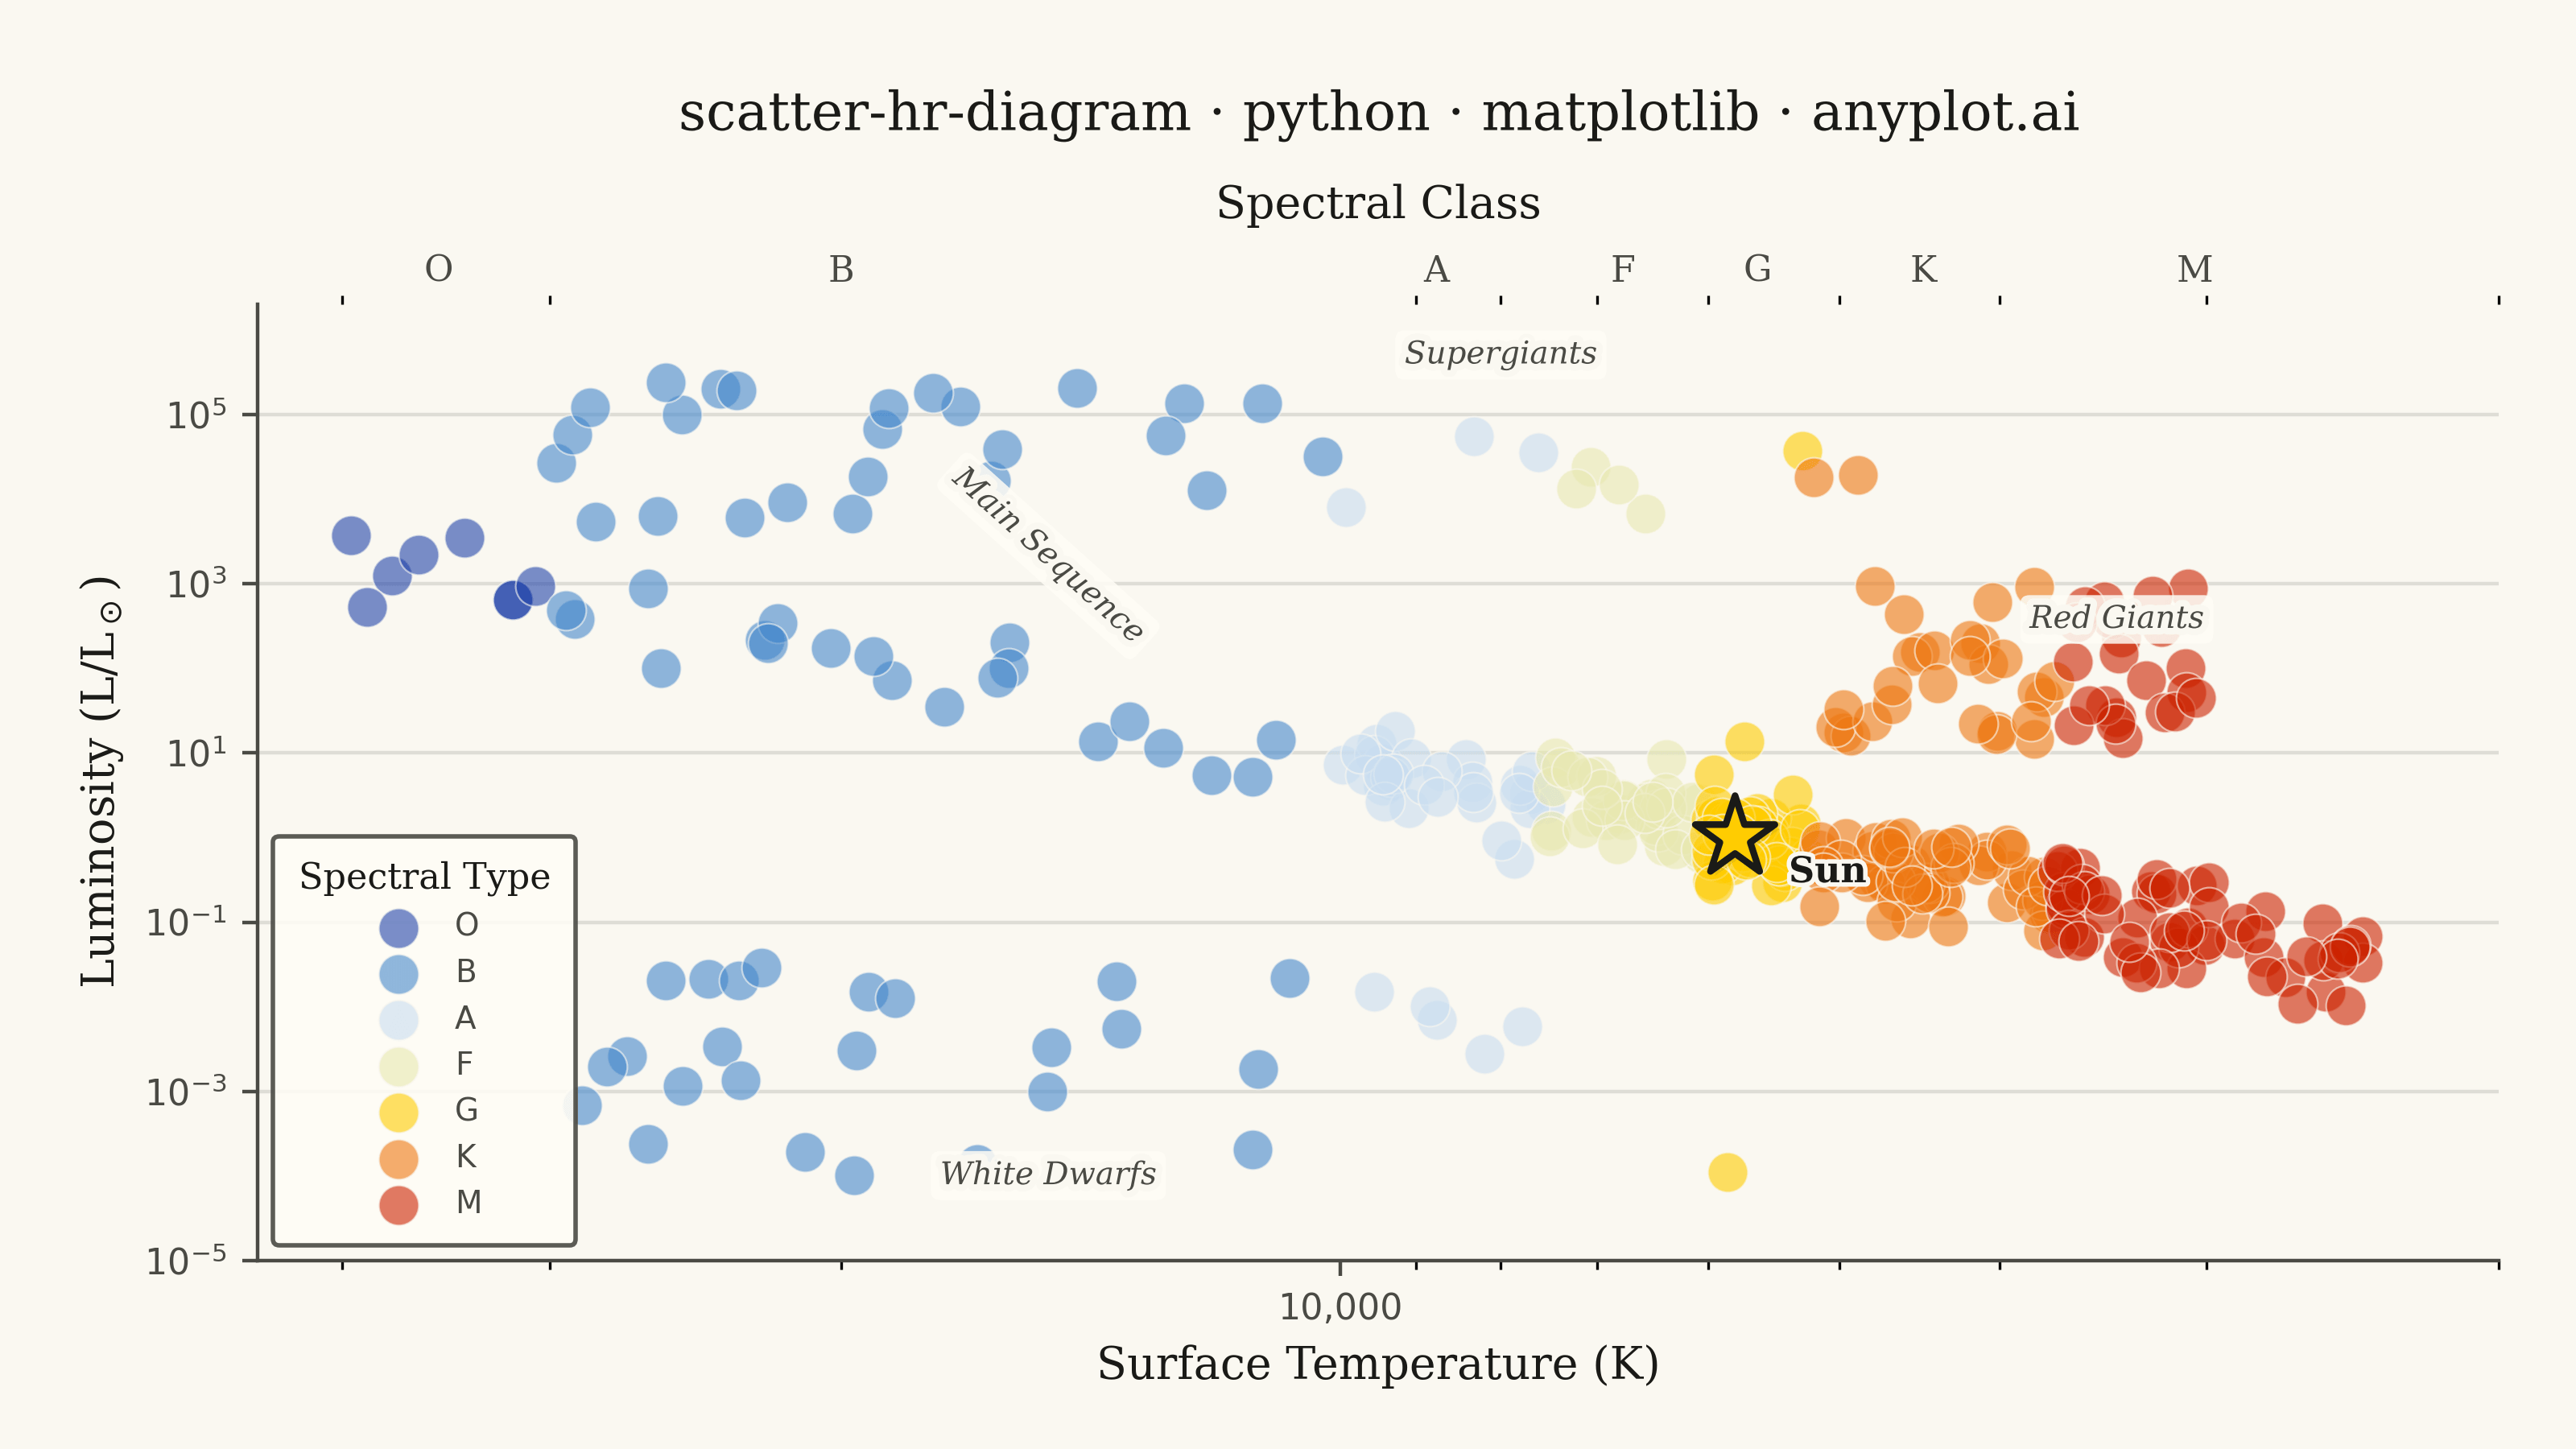
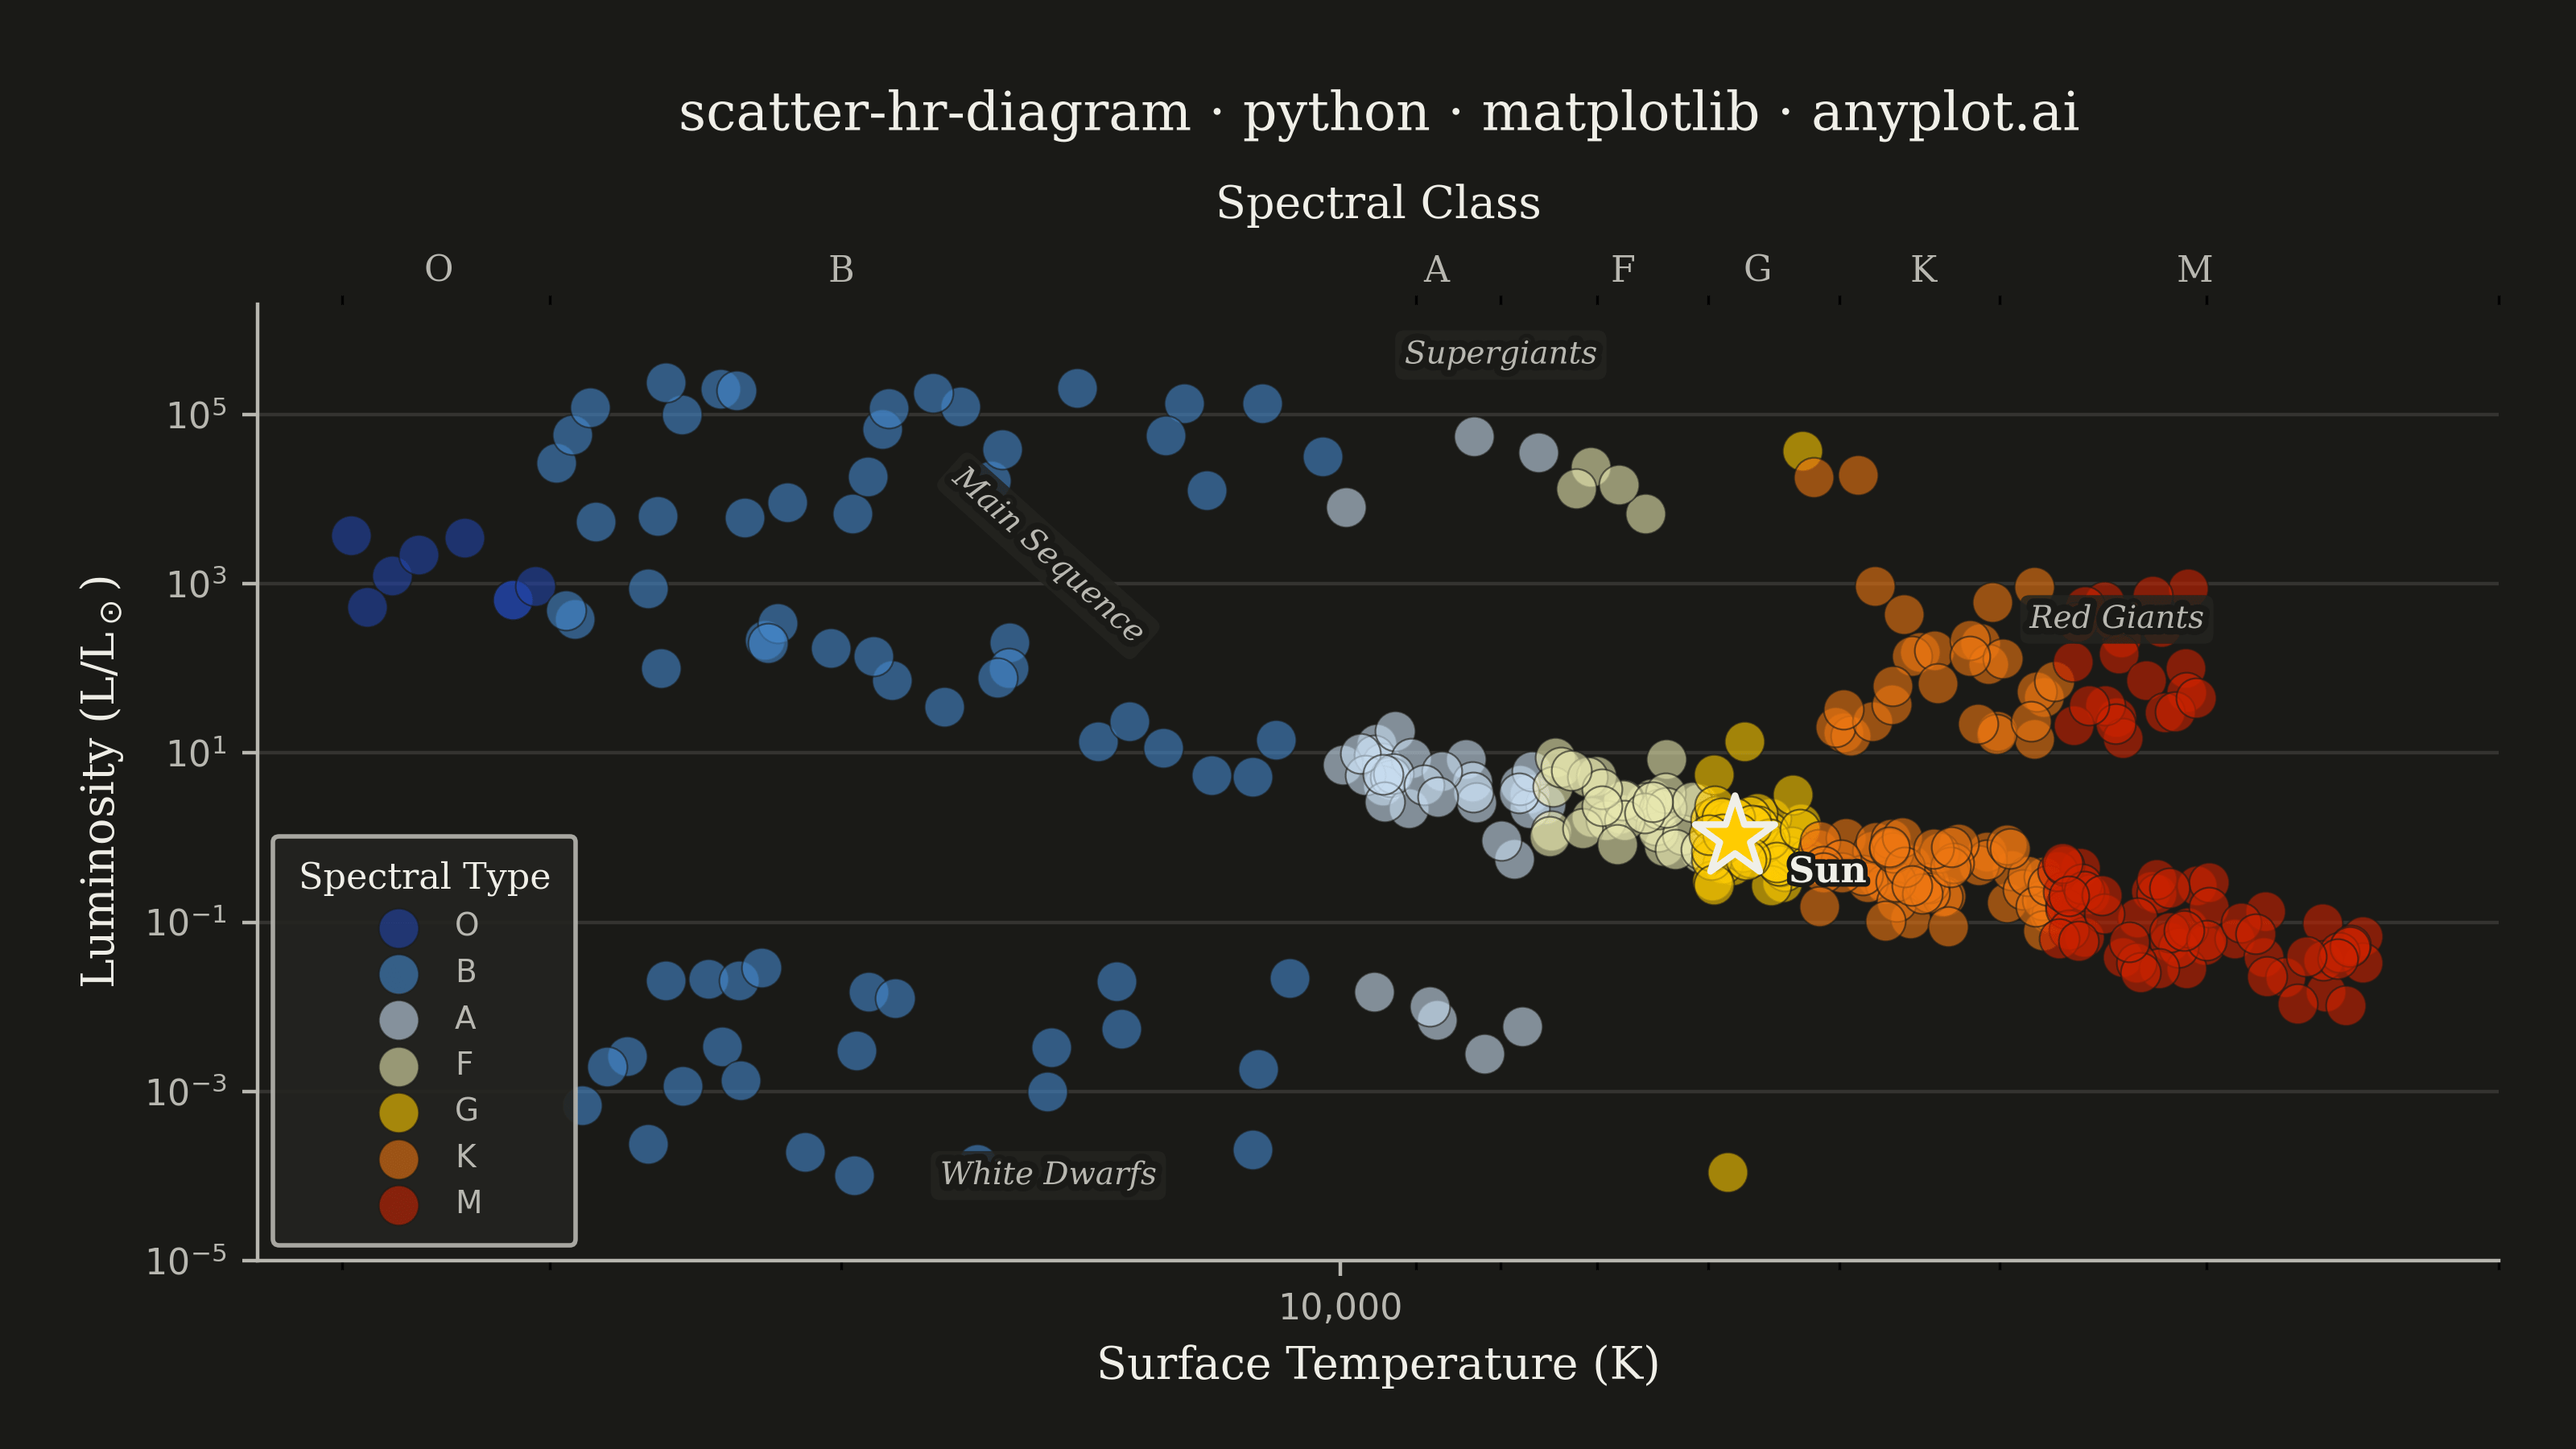
The Hertzsprung-Russell (HR) diagram is the iconic astrophysics scatter plot that shows stellar luminosity (or absolute magnitude) versus surface temperature (or spectral class). Stars naturally cluster along the main sequence diagonal, with distinct regions for red giants, supergiants, and white dwarfs, revealing the fundamental relationship between stellar temperature and brightness.
""" anyplot.ai
scatter-hr-diagram: Hertzsprung-Russell Diagram
Library: matplotlib 3.10.9 | Python 3.13.13
Quality: 92/100 | Updated: 2026-06-02
"""

import os

import matplotlib.patheffects as pe
import matplotlib.pyplot as plt
import matplotlib.ticker as mticker
import numpy as np


# Theme tokens
THEME = os.getenv("ANYPLOT_THEME", "light")
PAGE_BG = "#FAF8F1" if THEME == "light" else "#1A1A17"
ELEVATED_BG = "#FFFDF6" if THEME == "light" else "#242420"
INK = "#1A1A17" if THEME == "light" else "#F0EFE8"
INK_SOFT = "#4A4A44" if THEME == "light" else "#B8B7B0"
INK_MUTED = "#6B6A63" if THEME == "light" else "#A8A79F"

# Spectral type colors — astrophysical convention (semantic exception from Imprint categorical order)
# A-type (#c8ddf0, blue-white) is now clearly distinct from B-type (#4488cc, blue)
spectral_colors = {
    "O": "#2244aa",  # blue-violet (hottest)
    "B": "#4488cc",  # blue
    "A": "#c8ddf0",  # blue-white (distinctly lighter than B)
    "F": "#e8e8b0",  # yellow-white
    "G": "#ffcc00",  # yellow
    "K": "#ee7711",  # orange
    "M": "#cc2200",  # red (coolest)
}

temp_ranges = {
    "O": (30000, 40000),
    "B": (10000, 30000),
    "A": (7500, 10000),
    "F": (6000, 7500),
    "G": (5200, 6000),
    "K": (3700, 5200),
    "M": (2400, 3700),
}

# Data
np.random.seed(42)

# Main sequence stars (250)
ms_counts = {"O": 8, "B": 20, "A": 30, "F": 35, "G": 45, "K": 55, "M": 57}
all_temps, all_lums, all_types = [], [], []

for sp, (t_lo, t_hi) in temp_ranges.items():
    n = ms_counts[sp]
    temps = np.random.uniform(t_lo, t_hi, n)
    log_lums = 4.0 * np.log10(temps / 5778) + np.random.normal(0, 0.3, n)
    all_temps.extend(temps)
    all_lums.extend(10**log_lums)
    all_types.extend([sp] * n)

# Red giants (50)
rg_temps = np.random.uniform(3000, 5200, 50)
rg_lums = 10 ** np.random.uniform(1.0, 3.0, 50)
all_temps.extend(rg_temps)
all_lums.extend(rg_lums)
all_types.extend(np.where(rg_temps >= 3700, "K", "M").tolist())

# Supergiants (35) — np.select replaces nested ternaries for readability
sg_temps = np.random.uniform(3500, 30000, 35)
sg_lums = 10 ** np.random.uniform(3.5, 5.5, 35)
all_temps.extend(sg_temps)
all_lums.extend(sg_lums)
all_types.extend(
    np.select(
        [sg_temps < 3700, sg_temps < 5200, sg_temps < 6000, sg_temps < 7500, sg_temps < 10000, sg_temps < 30000],
        ["M", "K", "G", "F", "A", "B"],
        default="O",
    ).tolist()
)

# White dwarfs (30)
wd_temps = np.random.uniform(5000, 30000, 30)
wd_lums = 10 ** np.random.uniform(-4.0, -1.5, 30)
all_temps.extend(wd_temps)
all_lums.extend(wd_lums)
all_types.extend(
    np.select(
        [wd_temps < 6000, wd_temps < 7500, wd_temps < 10000, wd_temps < 30000], ["G", "F", "A", "B"], default="O"
    ).tolist()
)

all_temps = np.array(all_temps)
all_lums = np.array(all_lums)

# Plot — figsize=(8, 4.5) dpi=400 → exactly 3200×1800 px (no bbox_inches='tight')
fig, ax = plt.subplots(figsize=(8, 4.5), dpi=400, facecolor=PAGE_BG)
ax.set_facecolor(PAGE_BG)

for sp in ["O", "B", "A", "F", "G", "K", "M"]:
    mask = np.array([t == sp for t in all_types])
    if mask.any():
        ax.scatter(
            all_temps[mask],
            all_lums[mask],
            c=spectral_colors[sp],
            label=sp,
            s=80,
            alpha=0.6,
            edgecolors=PAGE_BG,
            linewidth=0.4,
            zorder=3,
        )

# Sun reference point — star marker with shadow glow
ax.scatter(
    5778,
    1.0,
    c="#ffcc00",
    s=350,
    edgecolors=INK,
    linewidth=1.5,
    zorder=5,
    marker="*",
    path_effects=[pe.withSimplePatchShadow(offset=(1, -1), shadow_rgbFace="#ccaa00", alpha=0.4)],
)
ax.annotate(
    "Sun",
    (5778, 1.0),
    textcoords="offset points",
    xytext=(12, -10),
    fontsize=8,
    fontweight="bold",
    color=INK,
    fontfamily="serif",
    path_effects=[pe.withStroke(linewidth=2, foreground=PAGE_BG)],
)

# Region labels with elevated background boxes
region_style = {"fontsize": 7, "fontstyle": "italic", "color": INK_SOFT, "fontfamily": "serif", "ha": "center"}
text_effect = [pe.withStroke(linewidth=3, foreground=PAGE_BG)]

ax.annotate(
    "Main Sequence",
    xy=(15000, 200),
    rotation=-42,
    bbox={"boxstyle": "round,pad=0.3", "fc": ELEVATED_BG, "ec": "none", "alpha": 0.85},
    path_effects=text_effect,
    **region_style,
)
ax.annotate(
    "Red Giants",
    xy=(3400, 300),
    bbox={"boxstyle": "round,pad=0.3", "fc": ELEVATED_BG, "ec": "none", "alpha": 0.85},
    path_effects=text_effect,
    **region_style,
)
ax.annotate(
    "Supergiants",
    xy=(8000, 400000),
    bbox={"boxstyle": "round,pad=0.3", "fc": ELEVATED_BG, "ec": "none", "alpha": 0.85},
    path_effects=text_effect,
    **region_style,
)
ax.annotate(
    "White Dwarfs",
    xy=(15000, 0.00008),
    bbox={"boxstyle": "round,pad=0.3", "fc": ELEVATED_BG, "ec": "none", "alpha": 0.85},
    path_effects=text_effect,
    **region_style,
)

# Style
ax.set_xscale("log")
ax.set_yscale("log")
ax.set_xlim(45000, 2000)
ax.set_ylim(1e-5, 2e6)

ax.xaxis.set_major_formatter(mticker.FuncFormatter(lambda x, _: f"{int(x):,}"))

title = "scatter-hr-diagram · python · matplotlib · anyplot.ai"
title_fontsize = max(8, round(12 * 67 / len(title))) if len(title) > 67 else 12

ax.set_xlabel("Surface Temperature (K)", fontsize=10, color=INK, fontfamily="serif")
ax.set_ylabel("Luminosity (L/L$_\\odot$)", fontsize=10, color=INK, fontfamily="serif")
ax.set_title(
    title,
    fontsize=title_fontsize,
    fontweight="medium",
    color=INK,
    fontfamily="serif",
    pad=12,
    path_effects=[pe.withStroke(linewidth=2, foreground=PAGE_BG)],
)
ax.tick_params(axis="both", labelsize=8, colors=INK_SOFT)

legend = ax.legend(
    title="Spectral Type",
    fontsize=7,
    title_fontsize=8,
    loc="lower left",
    framealpha=0.9,
    edgecolor=INK_SOFT,
    facecolor=ELEVATED_BG,
    borderpad=0.8,
)
legend.get_frame().set_facecolor(ELEVATED_BG)
legend.get_frame().set_edgecolor(INK_SOFT)
legend.get_title().set_fontfamily("serif")
legend.get_title().set_color(INK)
plt.setp(legend.get_texts(), color=INK_SOFT)

ax.spines["top"].set_visible(False)
ax.spines["right"].set_visible(False)
ax.spines["left"].set_linewidth(0.8)
ax.spines["left"].set_color(INK_SOFT)
ax.spines["bottom"].set_linewidth(0.8)
ax.spines["bottom"].set_color(INK_SOFT)
ax.yaxis.grid(True, alpha=0.12, linewidth=0.8, which="both", color=INK)

# Secondary x-axis for spectral classes
ax2 = ax.twiny()
spectral_positions = [35000, 20000, 8750, 6750, 5600, 4450, 3050]
spectral_labels_top = ["O", "B", "A", "F", "G", "K", "M"]
ax2.set_xscale("log")
ax2.set_xlim(ax.get_xlim())
ax2.set_xticks(spectral_positions)
ax2.set_xticklabels(spectral_labels_top, fontsize=8, fontfamily="serif", color=INK_SOFT)
ax2.set_xlabel("Spectral Class", fontsize=10, labelpad=8, fontfamily="serif", color=INK)
ax2.tick_params(axis="x", length=0, colors=INK_SOFT)
for spine in ax2.spines.values():
    spine.set_visible(False)

fig.subplots_adjust(left=0.10, right=0.97, top=0.79, bottom=0.13)

# Save
plt.savefig(f"plot-{THEME}.png", dpi=400, facecolor=PAGE_BG)
Runnable source as JSON, for any HTTP client: https://api.anyplot.ai/specs/scatter-hr-diagram/matplotlib/code. Any spec id and library id listed in llms-full.txt fit the same URL shape; every URL below is complete and callable.
{
  "spec_id": "scatter-hr-diagram",
  "language": "python",
  "library": "matplotlib",
  "page": "https://anyplot.ai/scatter-hr-diagram/python/matplotlib",
  "hub": "https://anyplot.ai/scatter-hr-diagram",
  "code_json": "https://api.anyplot.ai/specs/scatter-hr-diagram/matplotlib/code",
  "spec_json": "https://api.anyplot.ai/specs/scatter-hr-diagram",
  "render_light_png": "https://storage.googleapis.com/anyplot-images/plots/scatter-hr-diagram/python/matplotlib/plot-light.png",
  "render_dark_png": "https://storage.googleapis.com/anyplot-images/plots/scatter-hr-diagram/python/matplotlib/plot-dark.png",
  "quality_score": 92.0,
  "license": "MIT",
  "guide": "https://anyplot.ai/llms.txt"
}
Part of Hertzsprung-Russell Diagram on anyplot.ai.