The same plot in 14 other libraries — JavaScript: Chart.js, D3.js, Apache ECharts, Highcharts; Python: Altair, Bokeh, lets-plot, Matplotlib, Plotly, plotnine, Pygal, Seaborn; R: ggplot2; Julia: Makie.jl. Compare all 15 side by side: Hertzsprung-Russell Diagram in Python, R, Julia and JavaScript.
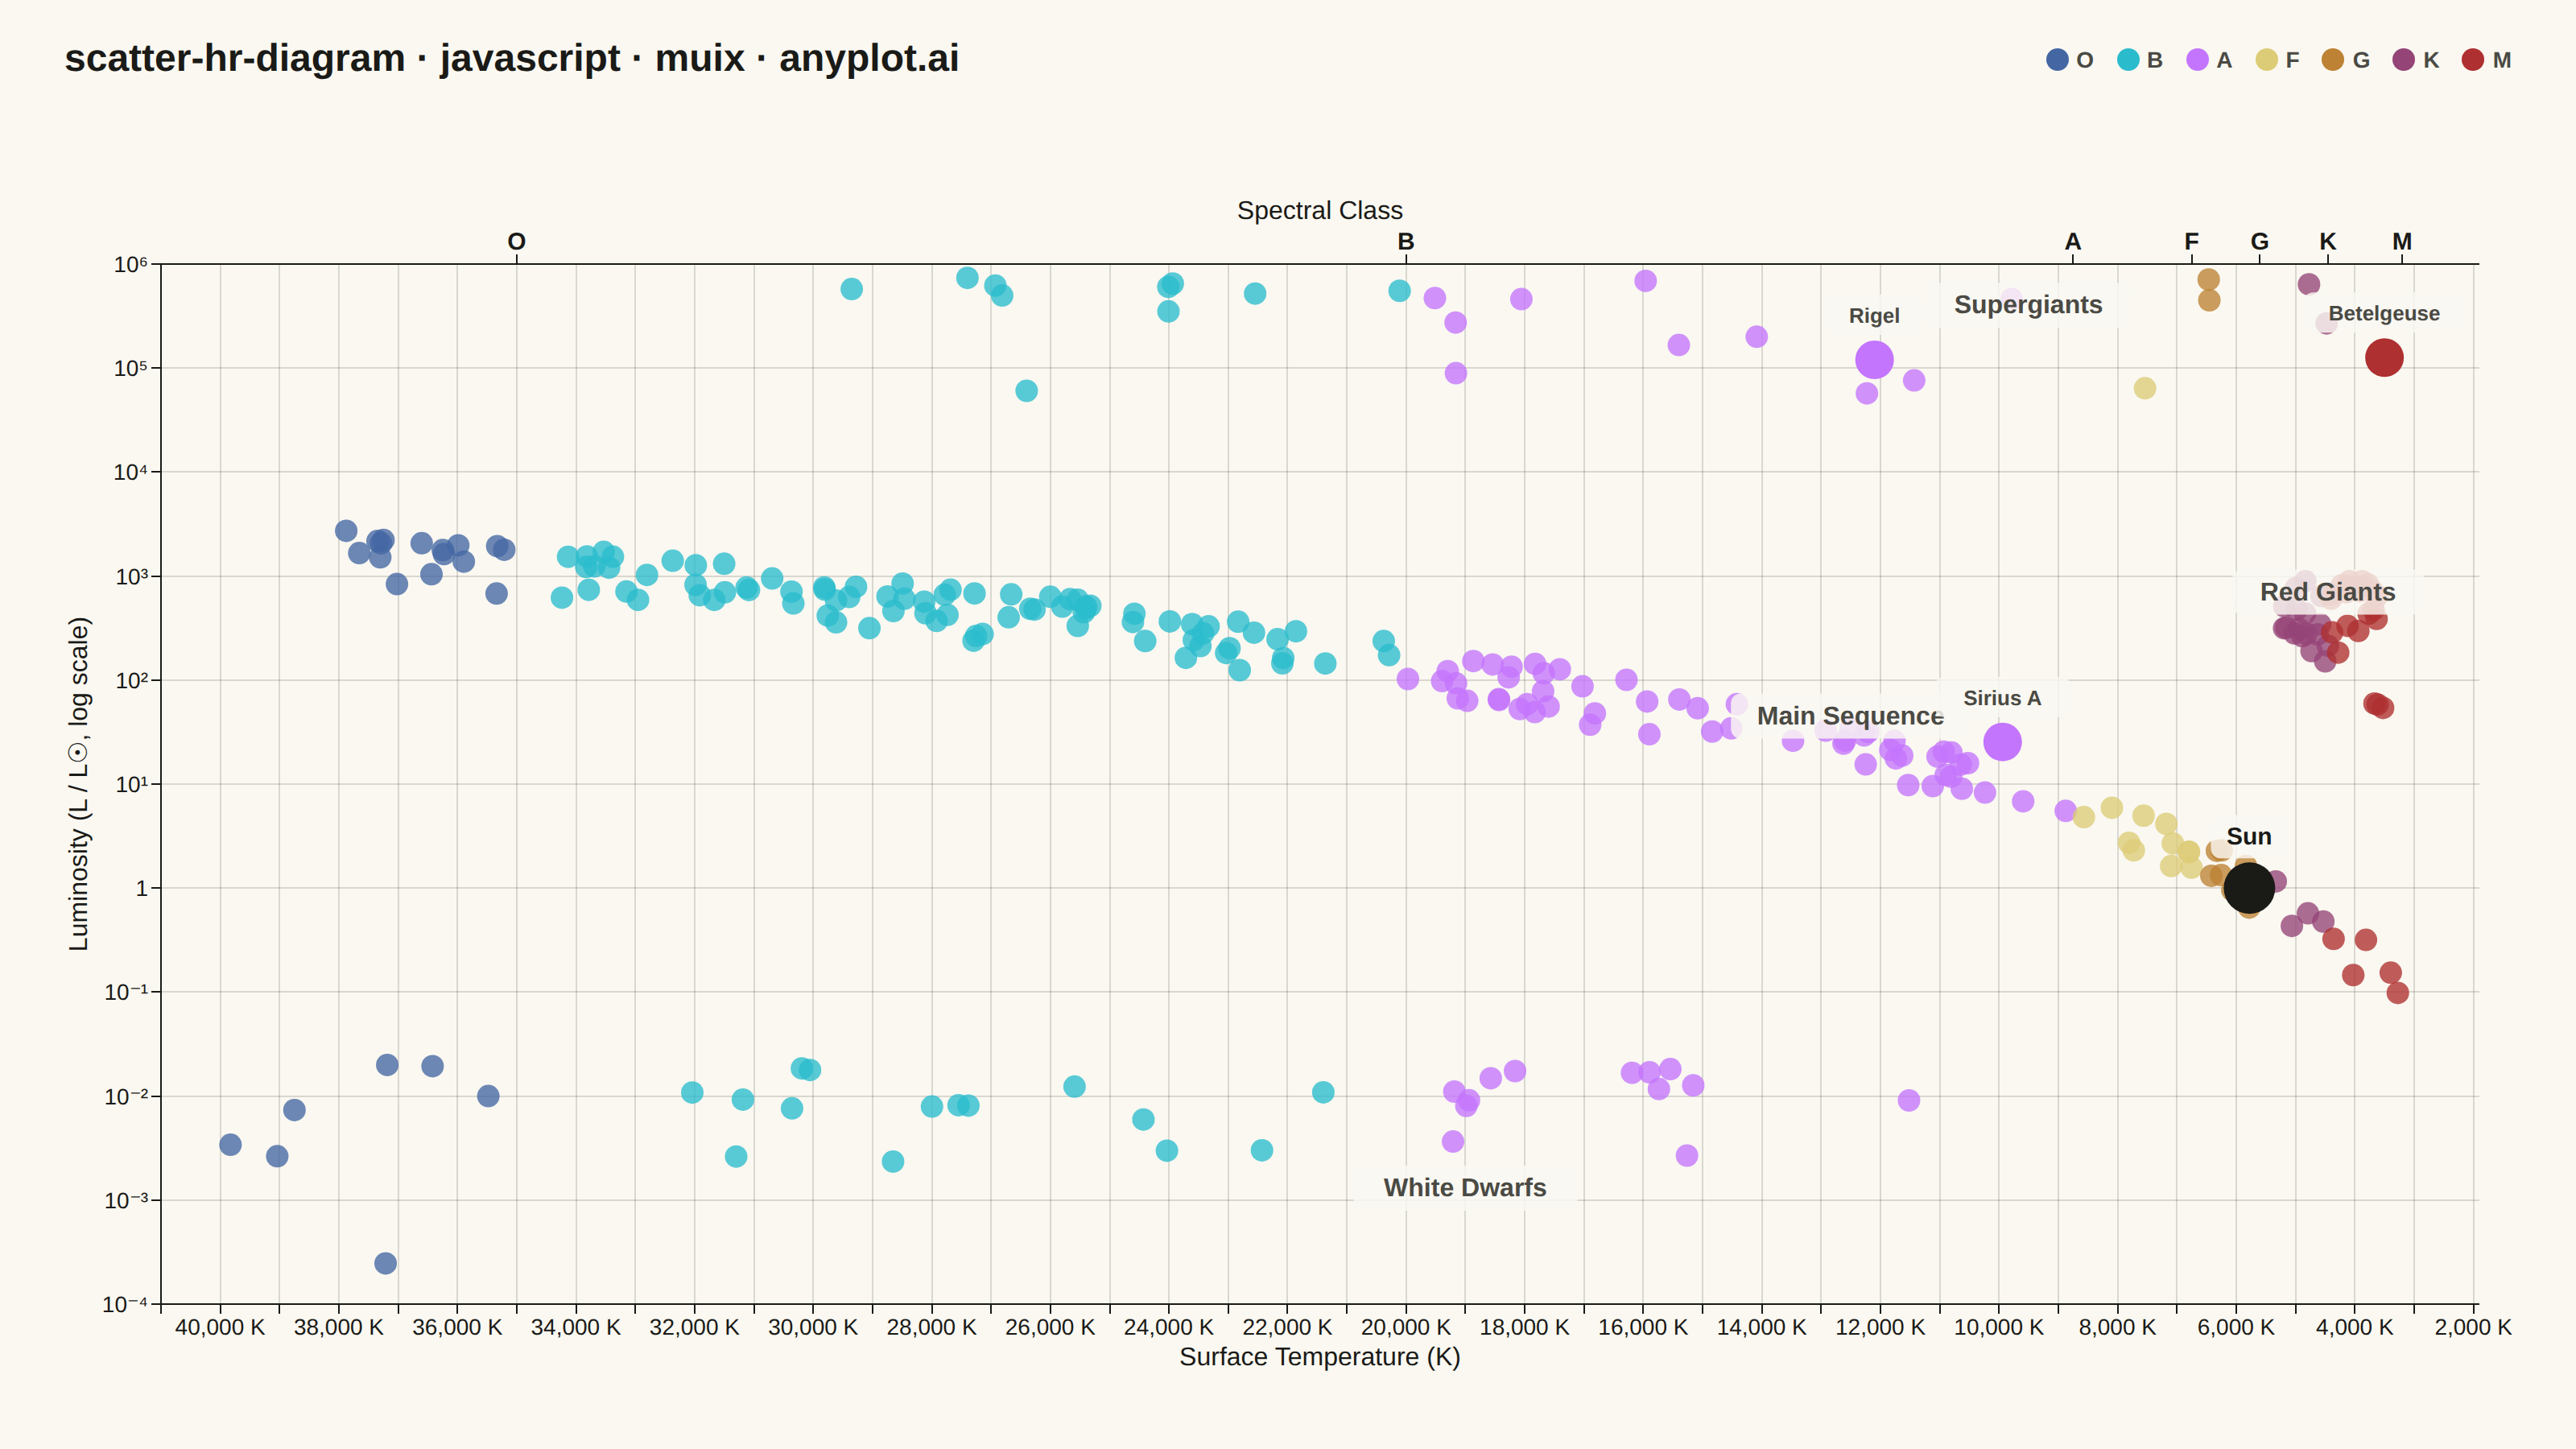
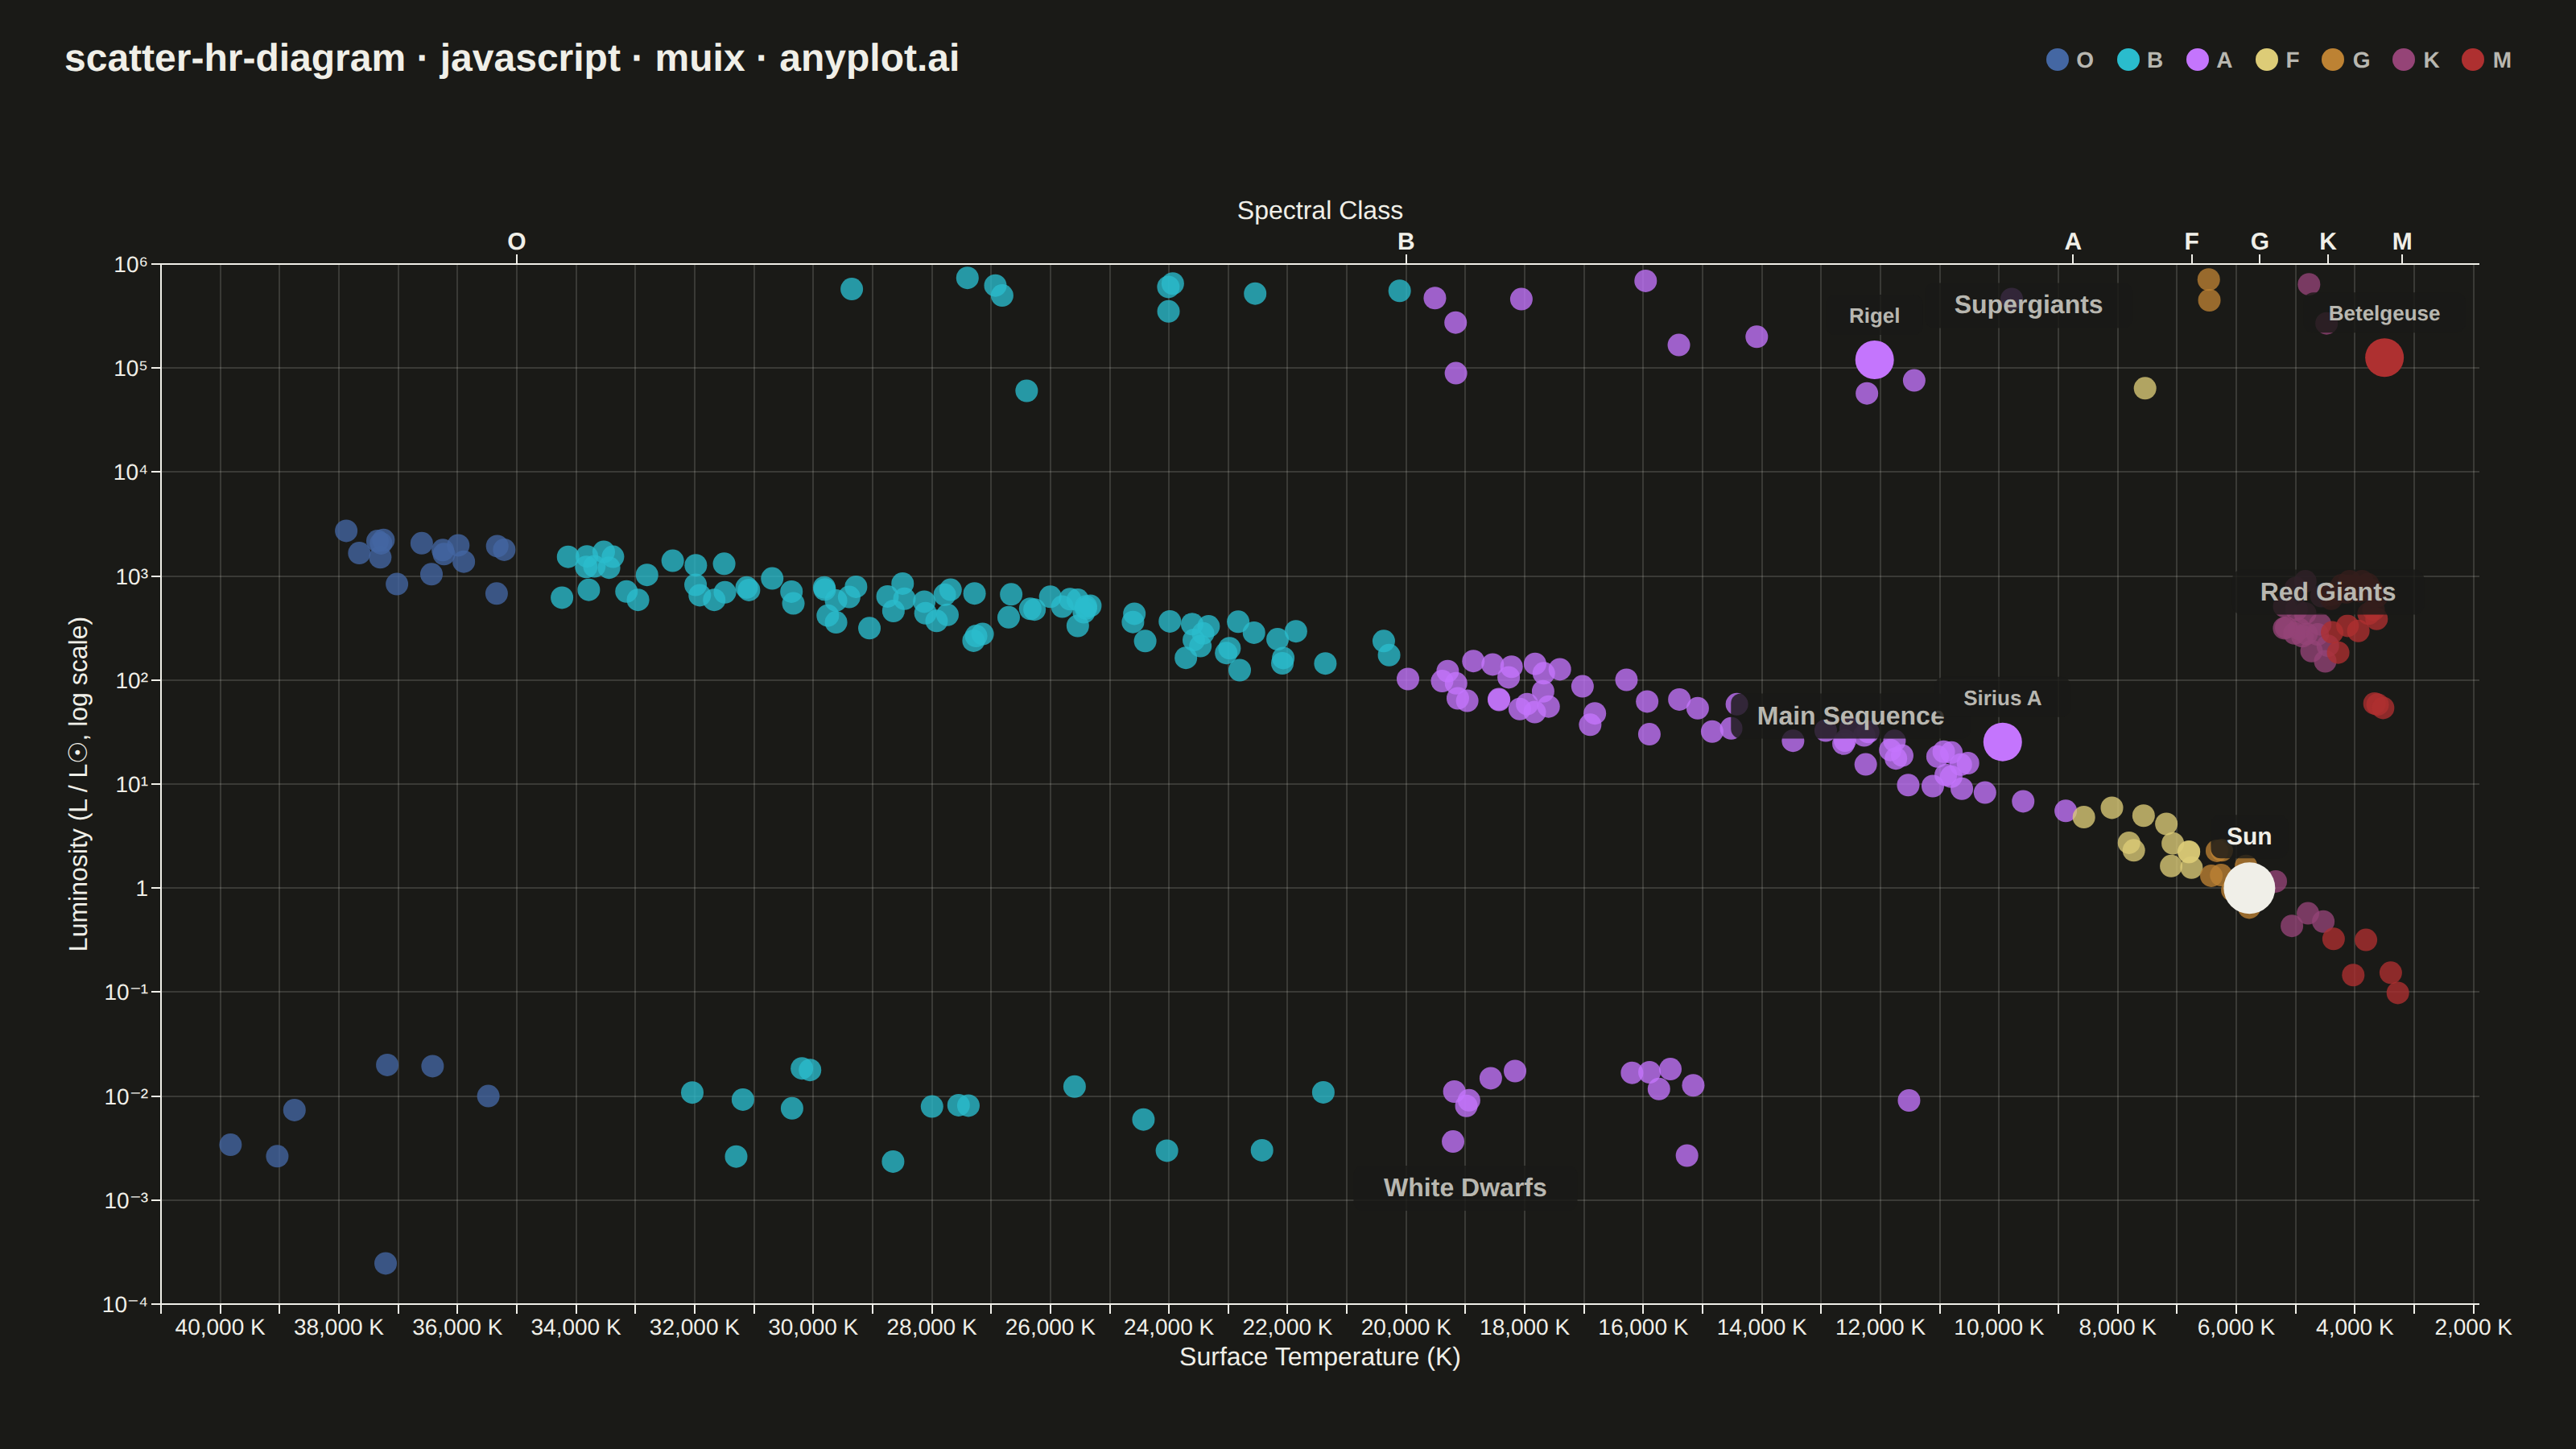
The Hertzsprung-Russell (HR) diagram is the iconic astrophysics scatter plot that shows stellar luminosity (or absolute magnitude) versus surface temperature (or spectral class). Stars naturally cluster along the main sequence diagonal, with distinct regions for red giants, supergiants, and white dwarfs, revealing the fundamental relationship between stellar temperature and brightness.
// anyplot.ai
// scatter-hr-diagram: Hertzsprung-Russell Diagram
// Library: muix 7.29.1 | JavaScript 22.23.2
// Quality: 92/100 | Created: 2026-08-26
import { ScatterChart } from "@mui/x-charts/ScatterChart";
import { ChartsText } from "@mui/x-charts/ChartsText";
import { useXScale, useYScale } from "@mui/x-charts/hooks";
import Box from "@mui/material/Box";
import Typography from "@mui/material/Typography";

const t = window.ANYPLOT_TOKENS;

// --- Data (in-memory, deterministic, tiny LCG PRNG) -------------------------

function lcg(seed: number) {
  let s = seed >>> 0;
  return () => {
    s = (Math.imul(1664525, s) + 1013904223) >>> 0;
    return s / 4294967295;
  };
}
const rand = lcg(42);
const randRange = (min: number, max: number) => min + rand() * (max - min);

// Main sequence: mass-luminosity relation L ~ (T / T_sun)^3.9 with scatter,
// spanning the full O-through-M temperature range.
const mainSequence = Array.from({ length: 180 }, (_, i) => {
  const temperature = randRange(2600, 38000);
  const luminosity = (temperature / 5778) ** 3.9 * randRange(0.55, 1.8);
  return { x: temperature, y: luminosity, id: `ms-${i}` };
});

// Red giants: cool but swollen, so far brighter than a main-sequence star of
// the same temperature.
const redGiants = Array.from({ length: 40 }, (_, i) => ({
  x: randRange(3400, 5200),
  y: randRange(15, 900),
  id: `rg-${i}`,
}));

// Supergiants: any temperature, always extremely luminous.
const supergiants = Array.from({ length: 25 }, (_, i) => ({
  x: randRange(3000, 30000),
  y: randRange(8000, 800000),
  id: `sg-${i}`,
}));

// White dwarfs: stellar remnants — hot surfaces, but tiny and faint.
const whiteDwarfs = Array.from({ length: 35 }, (_, i) => ({
  x: randRange(8000, 40000),
  y: randRange(0.0001, 0.02),
  id: `wd-${i}`,
}));

const sun = { x: 5778, y: 1, id: "sun" };

// A few real, named stars (approximate literature temperature/luminosity)
// give the spec's `star_name` field a payoff beyond the Sun.
const NOTABLE_STARS = [
  { name: "Sirius A", x: 9940, y: 25.4 },
  { name: "Rigel", x: 12100, y: 120000 },
  { name: "Betelgeuse", x: 3500, y: 126000 },
];

// Spectral-class boundary temperatures (K), hottest -> coolest, driving the
// secondary top axis (the spec's optional spectral-class labels).
const SPECTRAL_TICKS = [35000, 20000, 8750, 6750, 5600, 4450, 3200];
const SPECTRAL_LABELS: Record<number, string> = {
  35000: "O",
  20000: "B",
  8750: "A",
  6750: "F",
  5600: "G",
  4450: "K",
  3200: "M",
};
const SPECTRAL_ORDER = ["O", "B", "A", "F", "G", "K", "M"];

// Buckets a temperature into its spectral letter using the same boundaries
// that drive the secondary top axis, so marker color and axis position always
// agree on which class a star belongs to.
function classifySpectralType(temperature: number): string {
  for (const boundary of SPECTRAL_TICKS) {
    if (temperature >= boundary) return SPECTRAL_LABELS[boundary];
  }
  return "M";
}

// The Imprint palette has no literal white or orange, so these are the
// closest fixed hues standing in for the spec's conventional star colors
// (blue/white/yellow/orange/red) — same hex in both themes, per palette rules.
const SPECTRAL_COLORS: Record<string, string> = {
  O: t.palette[2], // blue
  B: t.palette[5], // cyan (blue-white)
  A: t.palette[1], // lavender — palest available hue, stands in for white
  F: t.amber, // pale gold
  G: t.palette[3], // ochre — deeper gold, Sun-like
  K: t.palette[6], // rose — warm red-orange
  M: t.palette[4], // matte red
};

function withAlpha(hex: string, alpha: number) {
  const r = parseInt(hex.slice(1, 3), 16);
  const g = parseInt(hex.slice(3, 5), 16);
  const b = parseInt(hex.slice(5, 7), 16);
  return `rgba(${r}, ${g}, ${b}, ${alpha})`;
}

// Every generated star, grouped by spectral type (computed from temperature)
// rather than by the population that generated it — this is what drives
// point color, while the region labels below stay purely spatial annotations.
const allStars = [...mainSequence, ...redGiants, ...supergiants, ...whiteDwarfs];
const starsByType: Record<string, { x: number; y: number; id: string }[]> = Object.fromEntries(
  SPECTRAL_ORDER.map((type) => [type, []]),
);
for (const star of allStars) {
  starsByType[classifySpectralType(star.x)].push(star);
}

const TEMPERATURE_DOMAIN: [number, number] = [1900, 41000];
const LUMINOSITY_DOMAIN: [number, number] = [0.0001, 1000000];
// Only the decade boundaries get a tick — d3's default log ticks (1/2/3/5/7 per
// decade) crowd into unreadable clumps once ~10 decades are compressed into one axis.
const LUMINOSITY_TICKS = [0.0001, 0.001, 0.01, 0.1, 1, 10, 100, 1000, 10000, 100000, 1000000];

const SUPERSCRIPT_DIGITS: Record<string, string> = {
  "-": "⁻",
  "0": "⁰",
  "1": "¹",
  "2": "²",
  "3": "³",
  "4": "⁴",
  "5": "⁵",
  "6": "⁶",
  "7": "⁷",
  "8": "⁸",
  "9": "⁹",
};
const toSuperscript = (n: number) =>
  String(n)
    .split("")
    .map((c) => SUPERSCRIPT_DIGITS[c] ?? c)
    .join("");

// Luminosity ticks land near powers of ten across the plotted range — format
// them as "10^n" (with "1" for 10^0) rather than long decimals.
function formatLuminosity(value: number) {
  const exponent = Math.round(Math.log10(value));
  const nearestPowerOfTen = 10 ** exponent;
  if (Math.abs(value - nearestPowerOfTen) / nearestPowerOfTen < 0.05) {
    return exponent === 0 ? "1" : `10${toSuperscript(exponent)}`;
  }
  return value < 1 ? value.toFixed(4) : Math.round(value).toLocaleString();
}

const TITLE = "scatter-hr-diagram · javascript · muix · anyplot.ai";
const TITLE_H = 64;

// Region + Sun labels are placed in data coordinates and converted to pixels
// with the chart's own scales — the only way to anchor SVG text inside the
// plotting area at an exact (temperature, luminosity) position.
const REGION_LABELS = [
  { text: "Main Sequence", x: 12500, y: 45 },
  { text: "Red Giants", x: 4450, y: 700 },
  { text: "Supergiants", x: 9500, y: 400000 },
  { text: "White Dwarfs", x: 19000, y: 0.0013 },
];

// Cluster points scatter randomly, so a label can land on top of a marker —
// a translucent page-colored backdrop keeps every label legible regardless of
// what's directly behind it, rather than hand-picking "safe" coordinates.
function LabelWithBackdrop({
  x,
  y,
  text,
  fill,
  fontSize,
  fontWeight,
}: {
  x: number;
  y: number;
  text: string;
  fill: string;
  fontSize: number;
  fontWeight: number;
}) {
  const paddingX = 10;
  const paddingY = 6;
  const boxWidth = text.length * fontSize * 0.62 + paddingX * 2;
  const boxHeight = fontSize + paddingY * 2;
  return (
    <g>
      <rect
        x={x - boxWidth / 2}
        y={y - boxHeight / 2}
        width={boxWidth}
        height={boxHeight}
        rx={6}
        fill={t.pageBg}
        fillOpacity={0.82}
      />
      <ChartsText
        x={x}
        y={y}
        text={text}
        fill={fill}
        style={{ fontSize, fontWeight, textAnchor: "middle", dominantBaseline: "central" }}
      />
    </g>
  );
}

function ChartAnnotations() {
  const xScale = useXScale();
  const yScale = useYScale();

  return (
    <g>
      {REGION_LABELS.map((label) => (
        <LabelWithBackdrop
          key={label.text}
          x={xScale(label.x)}
          y={yScale(label.y)}
          text={label.text}
          fill={t.inkSoft}
          fontSize={16}
          fontWeight={600}
        />
      ))}
      <LabelWithBackdrop
        x={xScale(sun.x)}
        y={yScale(sun.y) - 32}
        text="Sun"
        fill={t.ink}
        fontSize={15}
        fontWeight={700}
      />
      {NOTABLE_STARS.map((star) => (
        <LabelWithBackdrop
          key={star.name}
          x={xScale(star.x)}
          y={yScale(star.y) - 28}
          text={star.name}
          fill={t.inkSoft}
          fontSize={13}
          fontWeight={600}
        />
      ))}
    </g>
  );
}

// --- Chart (default-exported component — the harness mounts it) ------------

export default function Chart() {
  const { width, height } = window.ANYPLOT_SIZE;

  return (
    <Box sx={{ width, height, bgcolor: t.pageBg, display: "flex", flexDirection: "column" }}>
      <Box
        sx={{
          height: TITLE_H,
          display: "flex",
          alignItems: "center",
          justifyContent: "space-between",
          px: "40px",
          pt: "10px",
        }}
      >
        <Typography sx={{ color: t.ink, fontSize: "24px", fontWeight: 600, lineHeight: 1 }}>
          {TITLE}
        </Typography>
        <Box sx={{ display: "flex", alignItems: "center", gap: "14px" }}>
          {SPECTRAL_ORDER.map((type) => (
            <Box key={type} sx={{ display: "flex", alignItems: "center", gap: "5px" }}>
              <Box sx={{ width: 14, height: 14, borderRadius: "50%", bgcolor: SPECTRAL_COLORS[type] }} />
              <Typography sx={{ color: t.inkSoft, fontSize: "14px", fontWeight: 600 }}>{type}</Typography>
            </Box>
          ))}
        </Box>
      </Box>

      <ScatterChart
        width={width}
        height={height - TITLE_H}
        skipAnimation
        disableVoronoi
        grid={{ horizontal: true, vertical: true }}
        xAxis={[
          {
            id: "temperature",
            scaleType: "linear",
            reverse: true,
            min: TEMPERATURE_DOMAIN[0],
            max: TEMPERATURE_DOMAIN[1],
            label: "Surface Temperature (K)",
            valueFormatter: (v: number) => `${Math.round(v).toLocaleString()} K`,
            tickLabelStyle: { fontSize: 14 },
            labelStyle: { fontSize: 16 },
          },
          {
            id: "spectral",
            scaleType: "linear",
            reverse: true,
            min: TEMPERATURE_DOMAIN[0],
            max: TEMPERATURE_DOMAIN[1],
            position: "top",
            label: "Spectral Class",
            tickInterval: SPECTRAL_TICKS,
            // The 7 boundary temperatures are intentionally sparse and
            // non-overlapping — force every one to render instead of MUI X's
            // 'auto' collision skip, which misjudges spacing for a custom
            // (non-uniform) tickInterval and ends up hiding all but the first.
            tickLabelInterval: () => true,
            valueFormatter: (v: number) => SPECTRAL_LABELS[v] ?? "",
            tickLabelStyle: { fontSize: 15, fontWeight: 600 },
            labelStyle: { fontSize: 16 },
          },
        ]}
        yAxis={[
          {
            id: "luminosity",
            scaleType: "log",
            min: LUMINOSITY_DOMAIN[0],
            max: LUMINOSITY_DOMAIN[1],
            label: "Luminosity (L / L☉, log scale)",
            tickInterval: LUMINOSITY_TICKS,
            valueFormatter: (v: number) => formatLuminosity(v),
            tickFontSize: 30,
            tickLabelStyle: { fontSize: 14 },
            labelStyle: { fontSize: 16 },
          },
        ]}
        bottomAxis="temperature"
        topAxis="spectral"
        leftAxis="luminosity"
        series={[
          ...SPECTRAL_ORDER.map((type) => ({
            id: `spectral-${type}`,
            xAxisId: "temperature",
            data: starsByType[type],
            label: `Spectral Type ${type}`,
            // Alpha softens overplotting in the densest bands (hot main-sequence
            // stars, and the red-giant cluster) without changing marker size.
            color: withAlpha(SPECTRAL_COLORS[type], 0.78),
            markerSize: 7,
            valueFormatter: (v: { x: number; y: number }) =>
              `Type ${type} · ${Math.round(v.x).toLocaleString()} K · ${formatLuminosity(v.y)} L☉`,
          })),
          {
            id: "sun",
            xAxisId: "temperature",
            data: [sun],
            label: "Sun (reference)",
            color: t.ink,
            markerSize: 16,
            valueFormatter: (v) => `${Math.round(v.x).toLocaleString()} K · ${formatLuminosity(v.y)} L☉`,
          },
          ...NOTABLE_STARS.map((star) => ({
            id: `notable-${star.name.toLowerCase().replace(/\s+/g, "-")}`,
            xAxisId: "temperature",
            data: [{ x: star.x, y: star.y, id: star.name }],
            label: star.name,
            color: SPECTRAL_COLORS[classifySpectralType(star.x)],
            markerSize: 12,
            valueFormatter: (v: { x: number; y: number }) =>
              `${star.name} · ${Math.round(v.x).toLocaleString()} K · ${formatLuminosity(v.y)} L☉`,
          })),
        ]}
        margin={{ top: 100, right: 60, bottom: 90, left: 100 }}
        sx={{
          "& .MuiChartsGrid-line": { stroke: t.grid, strokeWidth: 1 },
          "& .MuiScatter-mark": { stroke: t.pageBg, strokeWidth: 1 },
        }}
        slotProps={{ legend: { hidden: true } }}
      >
        <ChartAnnotations />
      </ScatterChart>
    </Box>
  );
}
Runnable source as JSON, for any HTTP client: https://api.anyplot.ai/specs/scatter-hr-diagram/muix/code. Any spec id and library id listed in llms-full.txt fit the same URL shape; every URL below is complete and callable.
{
  "spec_id": "scatter-hr-diagram",
  "language": "javascript",
  "library": "muix",
  "page": "https://anyplot.ai/scatter-hr-diagram/javascript/muix",
  "hub": "https://anyplot.ai/scatter-hr-diagram",
  "code_json": "https://api.anyplot.ai/specs/scatter-hr-diagram/muix/code",
  "spec_json": "https://api.anyplot.ai/specs/scatter-hr-diagram",
  "render_light_png": "https://storage.googleapis.com/anyplot-images/plots/scatter-hr-diagram/javascript/muix/plot-light.png",
  "render_dark_png": "https://storage.googleapis.com/anyplot-images/plots/scatter-hr-diagram/javascript/muix/plot-dark.png",
  "interactive_light_html": "https://storage.googleapis.com/anyplot-images/plots/scatter-hr-diagram/javascript/muix/plot-light.html",
  "interactive_dark_html": "https://storage.googleapis.com/anyplot-images/plots/scatter-hr-diagram/javascript/muix/plot-dark.html",
  "quality_score": 92.0,
  "license": "MIT",
  "guide": "https://anyplot.ai/llms.txt"
}
Part of Hertzsprung-Russell Diagram on anyplot.ai.