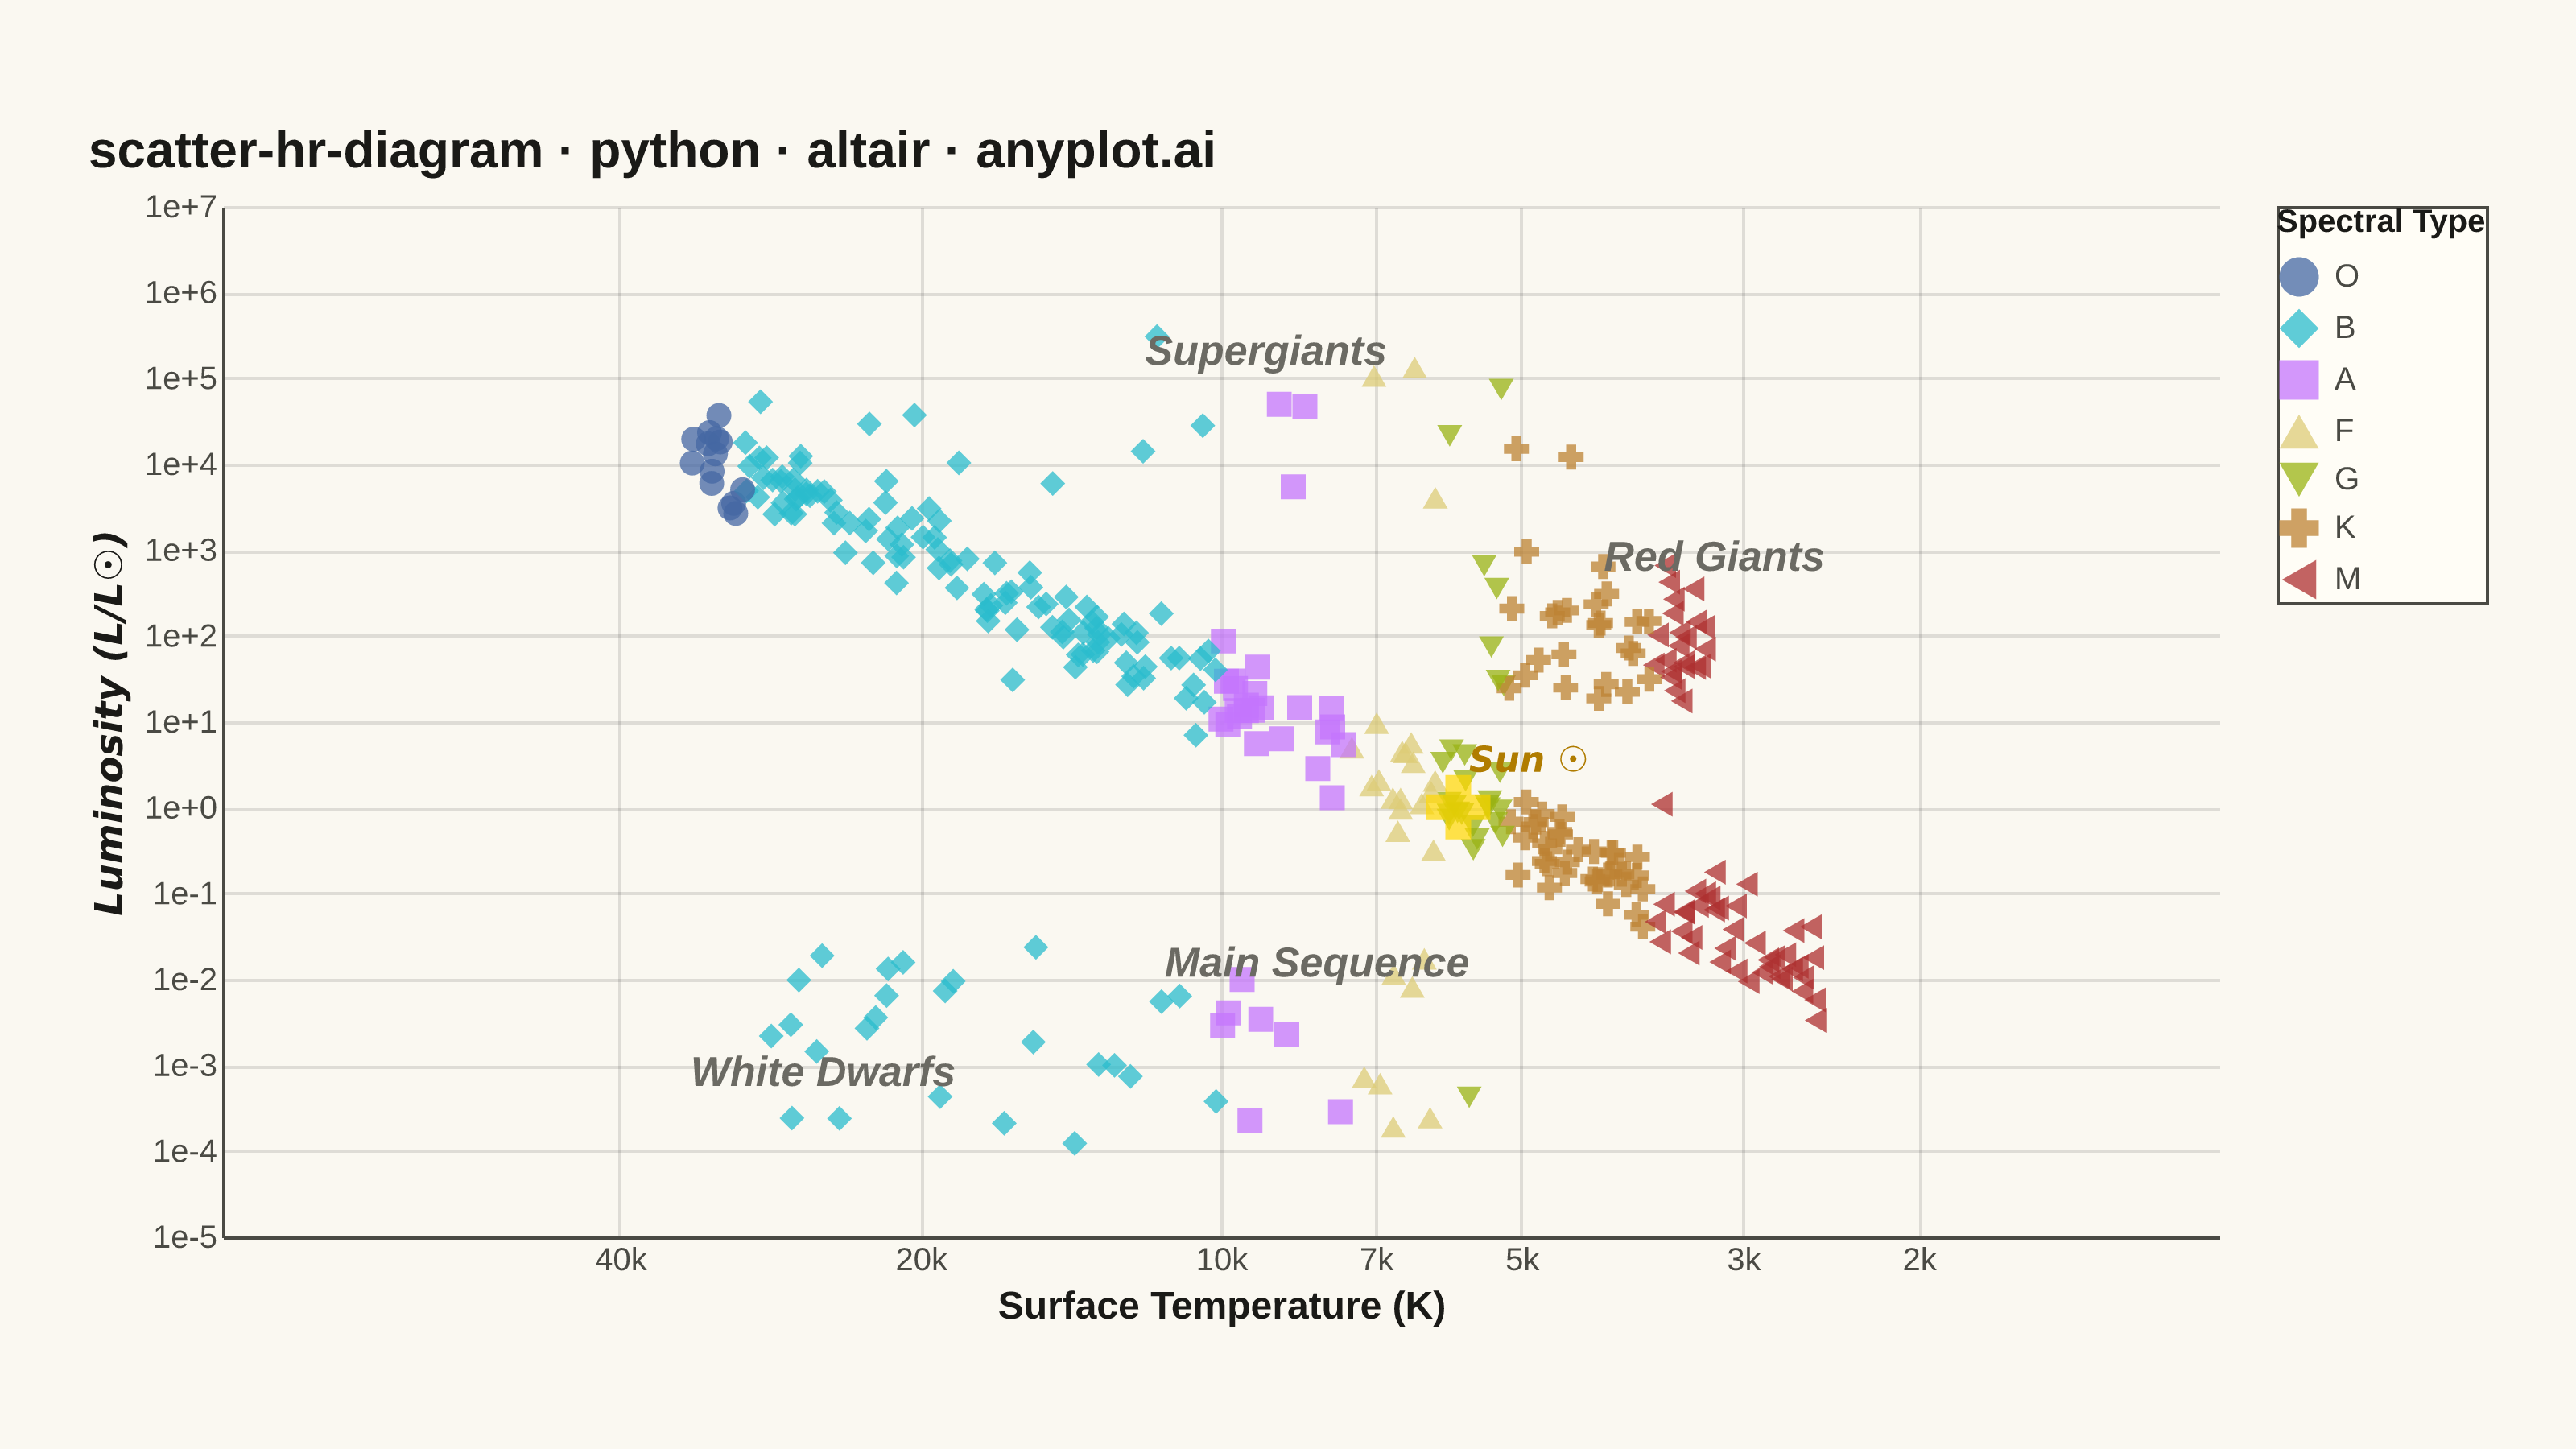
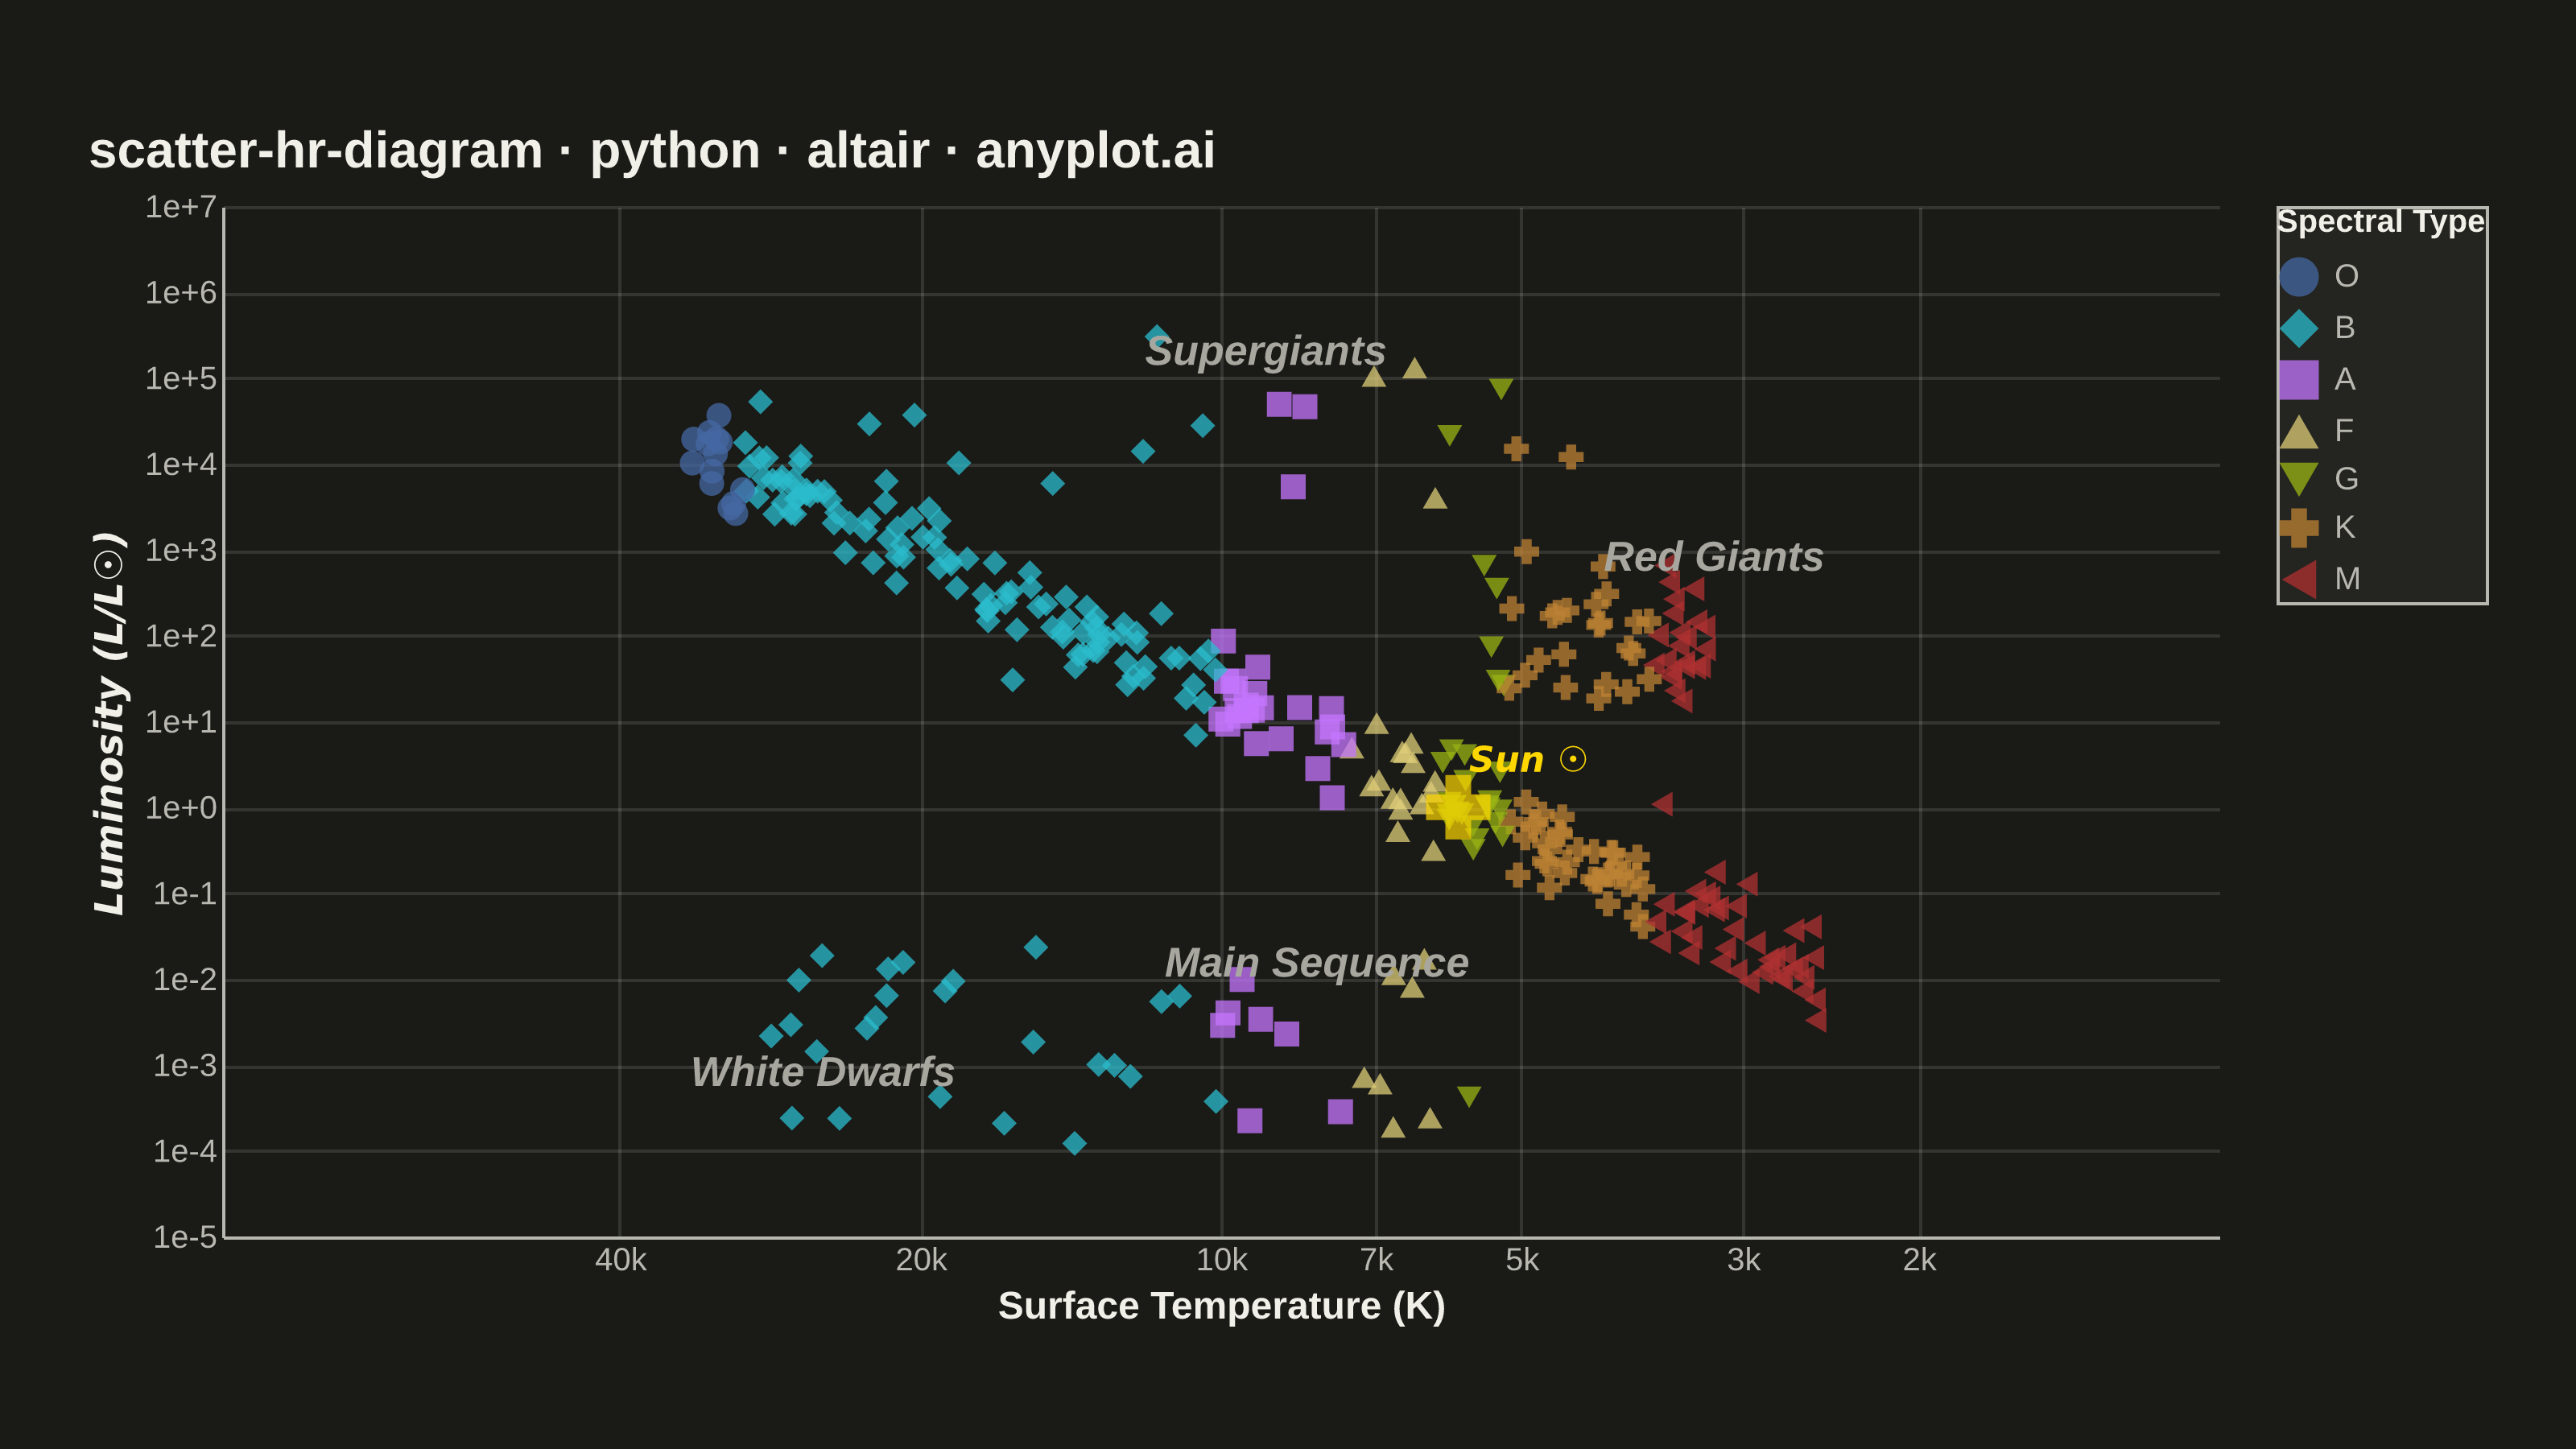
The Hertzsprung-Russell (HR) diagram is the iconic astrophysics scatter plot that shows stellar luminosity (or absolute magnitude) versus surface temperature (or spectral class). Stars naturally cluster along the main sequence diagonal, with distinct regions for red giants, supergiants, and white dwarfs, revealing the fundamental relationship between stellar temperature and brightness.
""" anyplot.ai
scatter-hr-diagram: Hertzsprung-Russell Diagram
Library: altair 6.1.0 | Python 3.13.13
Quality: 90/100 | Updated: 2026-06-02
"""

import os

import altair as alt
import numpy as np
import pandas as pd
from PIL import Image


THEME = os.getenv("ANYPLOT_THEME", "light")
PAGE_BG = "#FAF8F1" if THEME == "light" else "#1A1A17"
ELEVATED_BG = "#FFFDF6" if THEME == "light" else "#242420"
INK = "#1A1A17" if THEME == "light" else "#F0EFE8"
INK_SOFT = "#4A4A44" if THEME == "light" else "#B8B7B0"
INK_MUTED = "#6B6A63" if THEME == "light" else "#A8A79F"

np.random.seed(42)

# Main sequence stars (diagonal band from hot/bright to cool/dim)
n_main = 250
main_temp = 10 ** np.random.uniform(np.log10(2500), np.log10(35000), n_main)
main_log_lum = (np.log10(main_temp) - np.log10(5778)) * 5.5 + np.random.normal(0, 0.3, n_main)
main_lum = 10**main_log_lum

# Red giants (cool but bright)
n_giants = 50
giant_temp = 10 ** np.random.uniform(np.log10(3200), np.log10(5500), n_giants)
giant_lum = 10 ** np.random.uniform(1.2, 3.0, n_giants)

# Supergiants (very bright, wide temperature range)
n_super = 20
super_temp = 10 ** np.random.uniform(np.log10(3500), np.log10(30000), n_super)
super_lum = 10 ** np.random.uniform(3.5, 5.5, n_super)

# White dwarfs (hot but very dim)
n_wd = 40
wd_temp = 10 ** np.random.uniform(np.log10(5000), np.log10(30000), n_wd)
wd_lum = 10 ** np.random.uniform(-4, -1.5, n_wd)

temperatures = np.concatenate([main_temp, giant_temp, super_temp, wd_temp])
luminosities = np.concatenate([main_lum, giant_lum, super_lum, wd_lum])
regions = ["Main Sequence"] * n_main + ["Red Giants"] * n_giants + ["Supergiants"] * n_super + ["White Dwarfs"] * n_wd

spectral_types = np.select(
    [
        temperatures >= 30000,
        temperatures >= 10000,
        temperatures >= 7500,
        temperatures >= 6000,
        temperatures >= 5200,
        temperatures >= 3700,
    ],
    ["O", "B", "A", "F", "G", "K"],
    default="M",
)

df = pd.DataFrame(
    {
        "Temperature (K)": temperatures,
        "Luminosity (Solar)": luminosities,
        "Region": regions,
        "Spectral Type": spectral_types,
    }
)

# Sun as a reference point
sun = pd.DataFrame({"Temperature (K)": [5778], "Luminosity (Solar)": [1.0], "label": ["Sun ☉"]})

# Region labels placed in clear areas away from dense data
region_labels = pd.DataFrame(
    {
        "Temperature (K)": [8000, 3200, 9000, 25000],
        "Luminosity (Solar)": [0.015, 800, 200000, 0.0008],
        "text": ["Main Sequence", "Red Giants", "Supergiants", "White Dwarfs"],
    }
)

# Interactive selection: click legend to highlight spectral type
selection = alt.selection_point(fields=["Spectral Type"], bind="legend")

# Spectral colors mapped to nearest Imprint palette members while preserving
# hot-blue-to-cool-red astrophysical temperature sequence.
SPECTRAL_DOMAIN = ["O", "B", "A", "F", "G", "K", "M"]
SPECTRAL_RANGE = ["#4467A3", "#2ABCCD", "#C475FD", "#DDCC77", "#99B314", "#BD8233", "#AE3030"]
# Redundant shape encoding ensures CVD accessibility (deuteranopia/protanopia safe).
SPECTRAL_SHAPES = ["circle", "diamond", "square", "triangle-up", "triangle-down", "cross", "triangle-left"]

stars = (
    alt.Chart(df)
    .mark_point(strokeWidth=0, filled=True)
    .encode(
        x=alt.X(
            "Temperature (K):Q",
            scale=alt.Scale(type="log", domain=[50000, 2000]),
            axis=alt.Axis(
                title="Surface Temperature (K)", values=[2000, 3000, 5000, 7000, 10000, 20000, 40000], format="~s"
            ),
        ),
        y=alt.Y(
            "Luminosity (Solar):Q",
            scale=alt.Scale(type="log", domain=[0.00005, 2000000]),
            axis=alt.Axis(title="Luminosity (L/L☉)", format=".0e"),
        ),
        color=alt.Color(
            "Spectral Type:N",
            scale=alt.Scale(domain=SPECTRAL_DOMAIN, range=SPECTRAL_RANGE),
            sort=SPECTRAL_DOMAIN,
            legend=alt.Legend(title="Spectral Type", symbolSize=150, orient="right"),
        ),
        shape=alt.Shape(
            "Spectral Type:N",
            scale=alt.Scale(domain=SPECTRAL_DOMAIN, range=SPECTRAL_SHAPES),
            sort=SPECTRAL_DOMAIN,
            legend=alt.Legend(title="Spectral Type", symbolSize=150, orient="right"),
        ),
        size=alt.value(60),
        opacity=alt.condition(selection, alt.value(0.75), alt.value(0.08)),
        tooltip=["Temperature (K):Q", "Luminosity (Solar):Q", "Spectral Type:N", "Region:N"],
    )
    .add_params(selection)
)

sun_point = (
    alt.Chart(sun)
    .mark_point(shape="cross", size=400, color="#FFD700", strokeWidth=3, filled=True)
    .encode(x="Temperature (K):Q", y="Luminosity (Solar):Q", tooltip=alt.value("Sun (G2V, 5778 K, 1.0 L☉)"))
)

SUN_LABEL_COLOR = "#b07c00" if THEME == "light" else "#FFD700"
sun_label = (
    alt.Chart(sun)
    .mark_text(fontSize=11, fontWeight="bold", color=SUN_LABEL_COLOR, dx=22, dy=-14)
    .encode(x="Temperature (K):Q", y="Luminosity (Solar):Q", text="label:N")
)

labels = (
    alt.Chart(region_labels)
    .mark_text(fontSize=13, fontStyle="italic", color=INK_MUTED, fontWeight="bold")
    .encode(x="Temperature (K):Q", y="Luminosity (Solar):Q", text="text:N")
)

TITLE = "scatter-hr-diagram · python · altair · anyplot.ai"

chart = (
    (stars + sun_point + sun_label + labels)
    .properties(width=620, height=320, title=alt.Title(TITLE, fontSize=16, anchor="start"), background=PAGE_BG)
    .configure_view(fill=PAGE_BG, strokeWidth=0)
    .configure_axis(
        domainColor=INK_SOFT,
        tickColor=INK_SOFT,
        tickSize=0,
        gridColor=INK,
        gridOpacity=0.12,
        labelColor=INK_SOFT,
        labelFontSize=10,
        titleColor=INK,
        titleFontSize=12,
    )
    .configure_title(color=INK)
    .configure_legend(
        fillColor=ELEVATED_BG,
        strokeColor=INK_SOFT,
        labelColor=INK_SOFT,
        titleColor=INK,
        labelFontSize=10,
        titleFontSize=10,
    )
)

chart.save(f"plot-{THEME}.png", scale_factor=4.0)

# Pad to exact 3200×1800 target (vl-convert output is smaller than the inner view * scale_factor)
TW, TH = 3200, 1800
_img = Image.open(f"plot-{THEME}.png").convert("RGB")
_w, _h = _img.size
if _w > TW or _h > TH:
    raise SystemExit(
        f"altair vl-convert produced {_w}×{_h}, exceeds target {TW}×{TH}. "
        f"Shrink chart .properties(width=, height=) values and re-render."
    )
if _w < TW or _h < TH:
    _canvas = Image.new("RGB", (TW, TH), PAGE_BG)
    _canvas.paste(_img, ((TW - _w) // 2, (TH - _h) // 2))
    _canvas.save(f"plot-{THEME}.png")

chart.save(f"plot-{THEME}.html")
Runnable source as JSON, for any HTTP client: https://api.anyplot.ai/specs/scatter-hr-diagram/altair/code. Any spec id and library id listed in llms-full.txt fit the same URL shape; every URL below is complete and callable.
{
  "spec_id": "scatter-hr-diagram",
  "language": "python",
  "library": "altair",
  "page": "https://anyplot.ai/scatter-hr-diagram/python/altair",
  "hub": "https://anyplot.ai/scatter-hr-diagram",
  "code_json": "https://api.anyplot.ai/specs/scatter-hr-diagram/altair/code",
  "spec_json": "https://api.anyplot.ai/specs/scatter-hr-diagram",
  "render_light_png": "https://storage.googleapis.com/anyplot-images/plots/scatter-hr-diagram/python/altair/plot-light.png",
  "render_dark_png": "https://storage.googleapis.com/anyplot-images/plots/scatter-hr-diagram/python/altair/plot-dark.png",
  "interactive_light_html": "https://storage.googleapis.com/anyplot-images/plots/scatter-hr-diagram/python/altair/plot-light.html",
  "interactive_dark_html": "https://storage.googleapis.com/anyplot-images/plots/scatter-hr-diagram/python/altair/plot-dark.html",
  "quality_score": 90.0,
  "license": "MIT",
  "guide": "https://anyplot.ai/llms.txt"
}
Part of Hertzsprung-Russell Diagram on anyplot.ai.