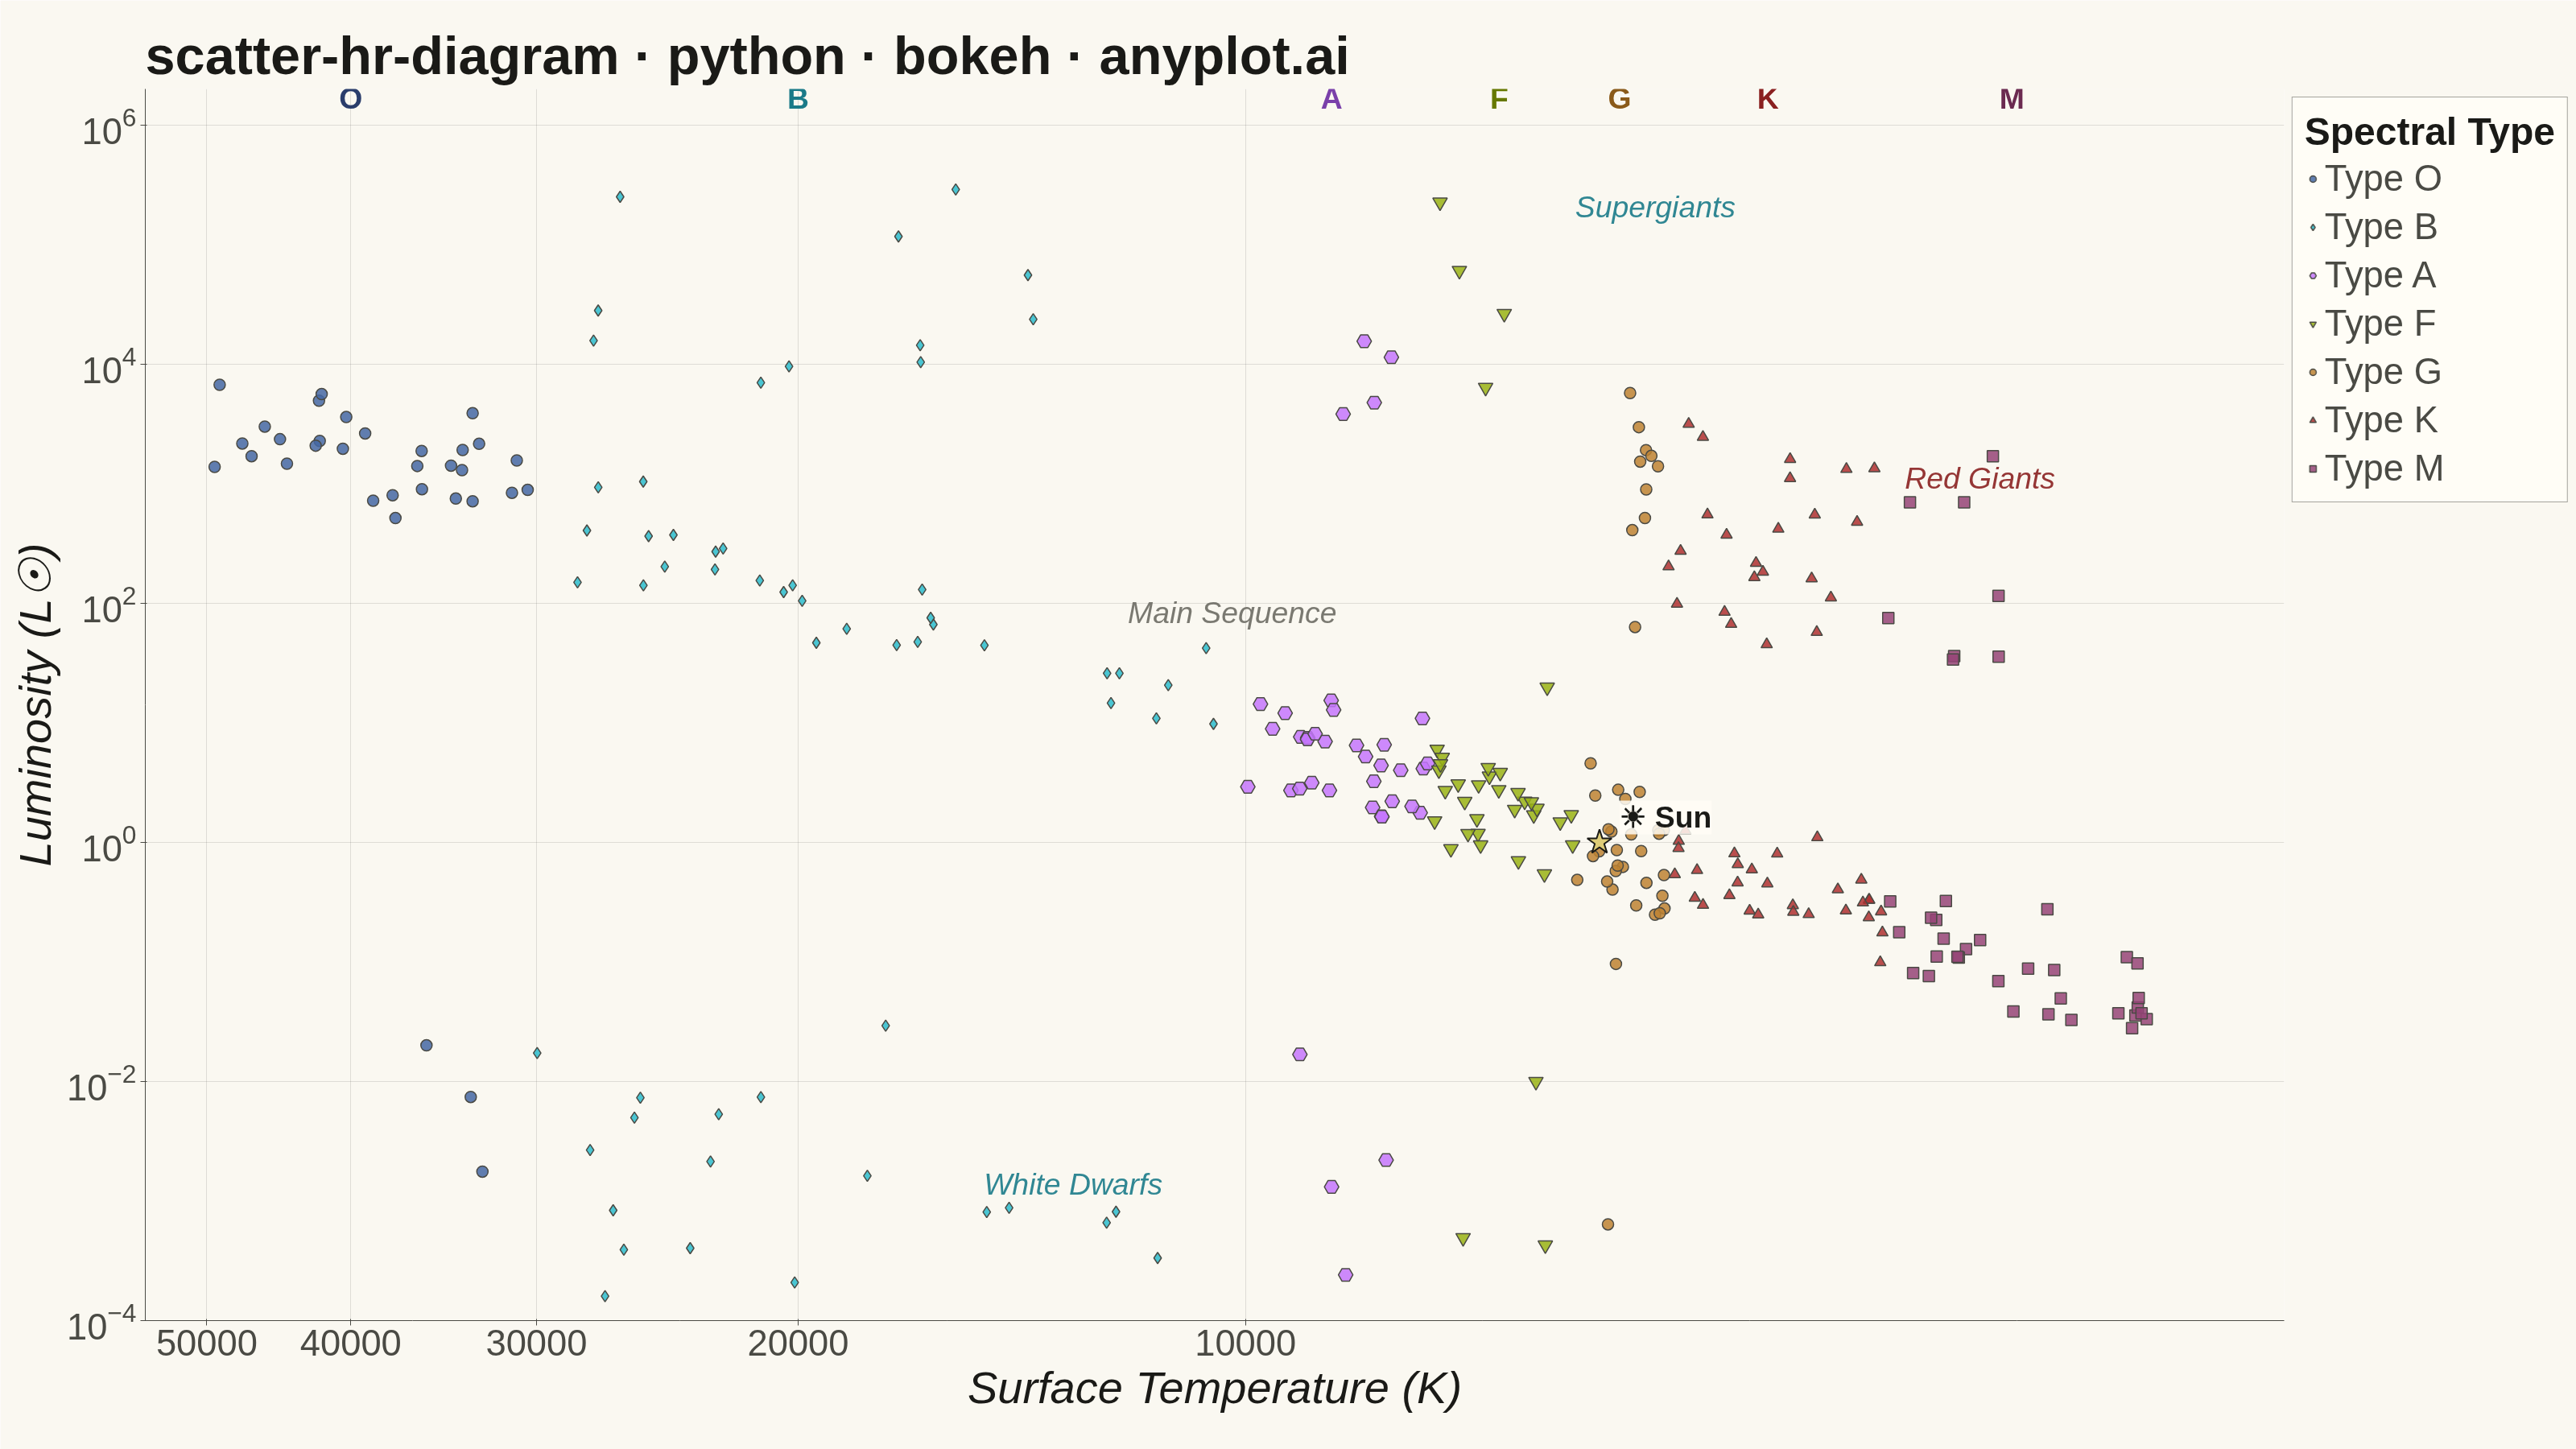
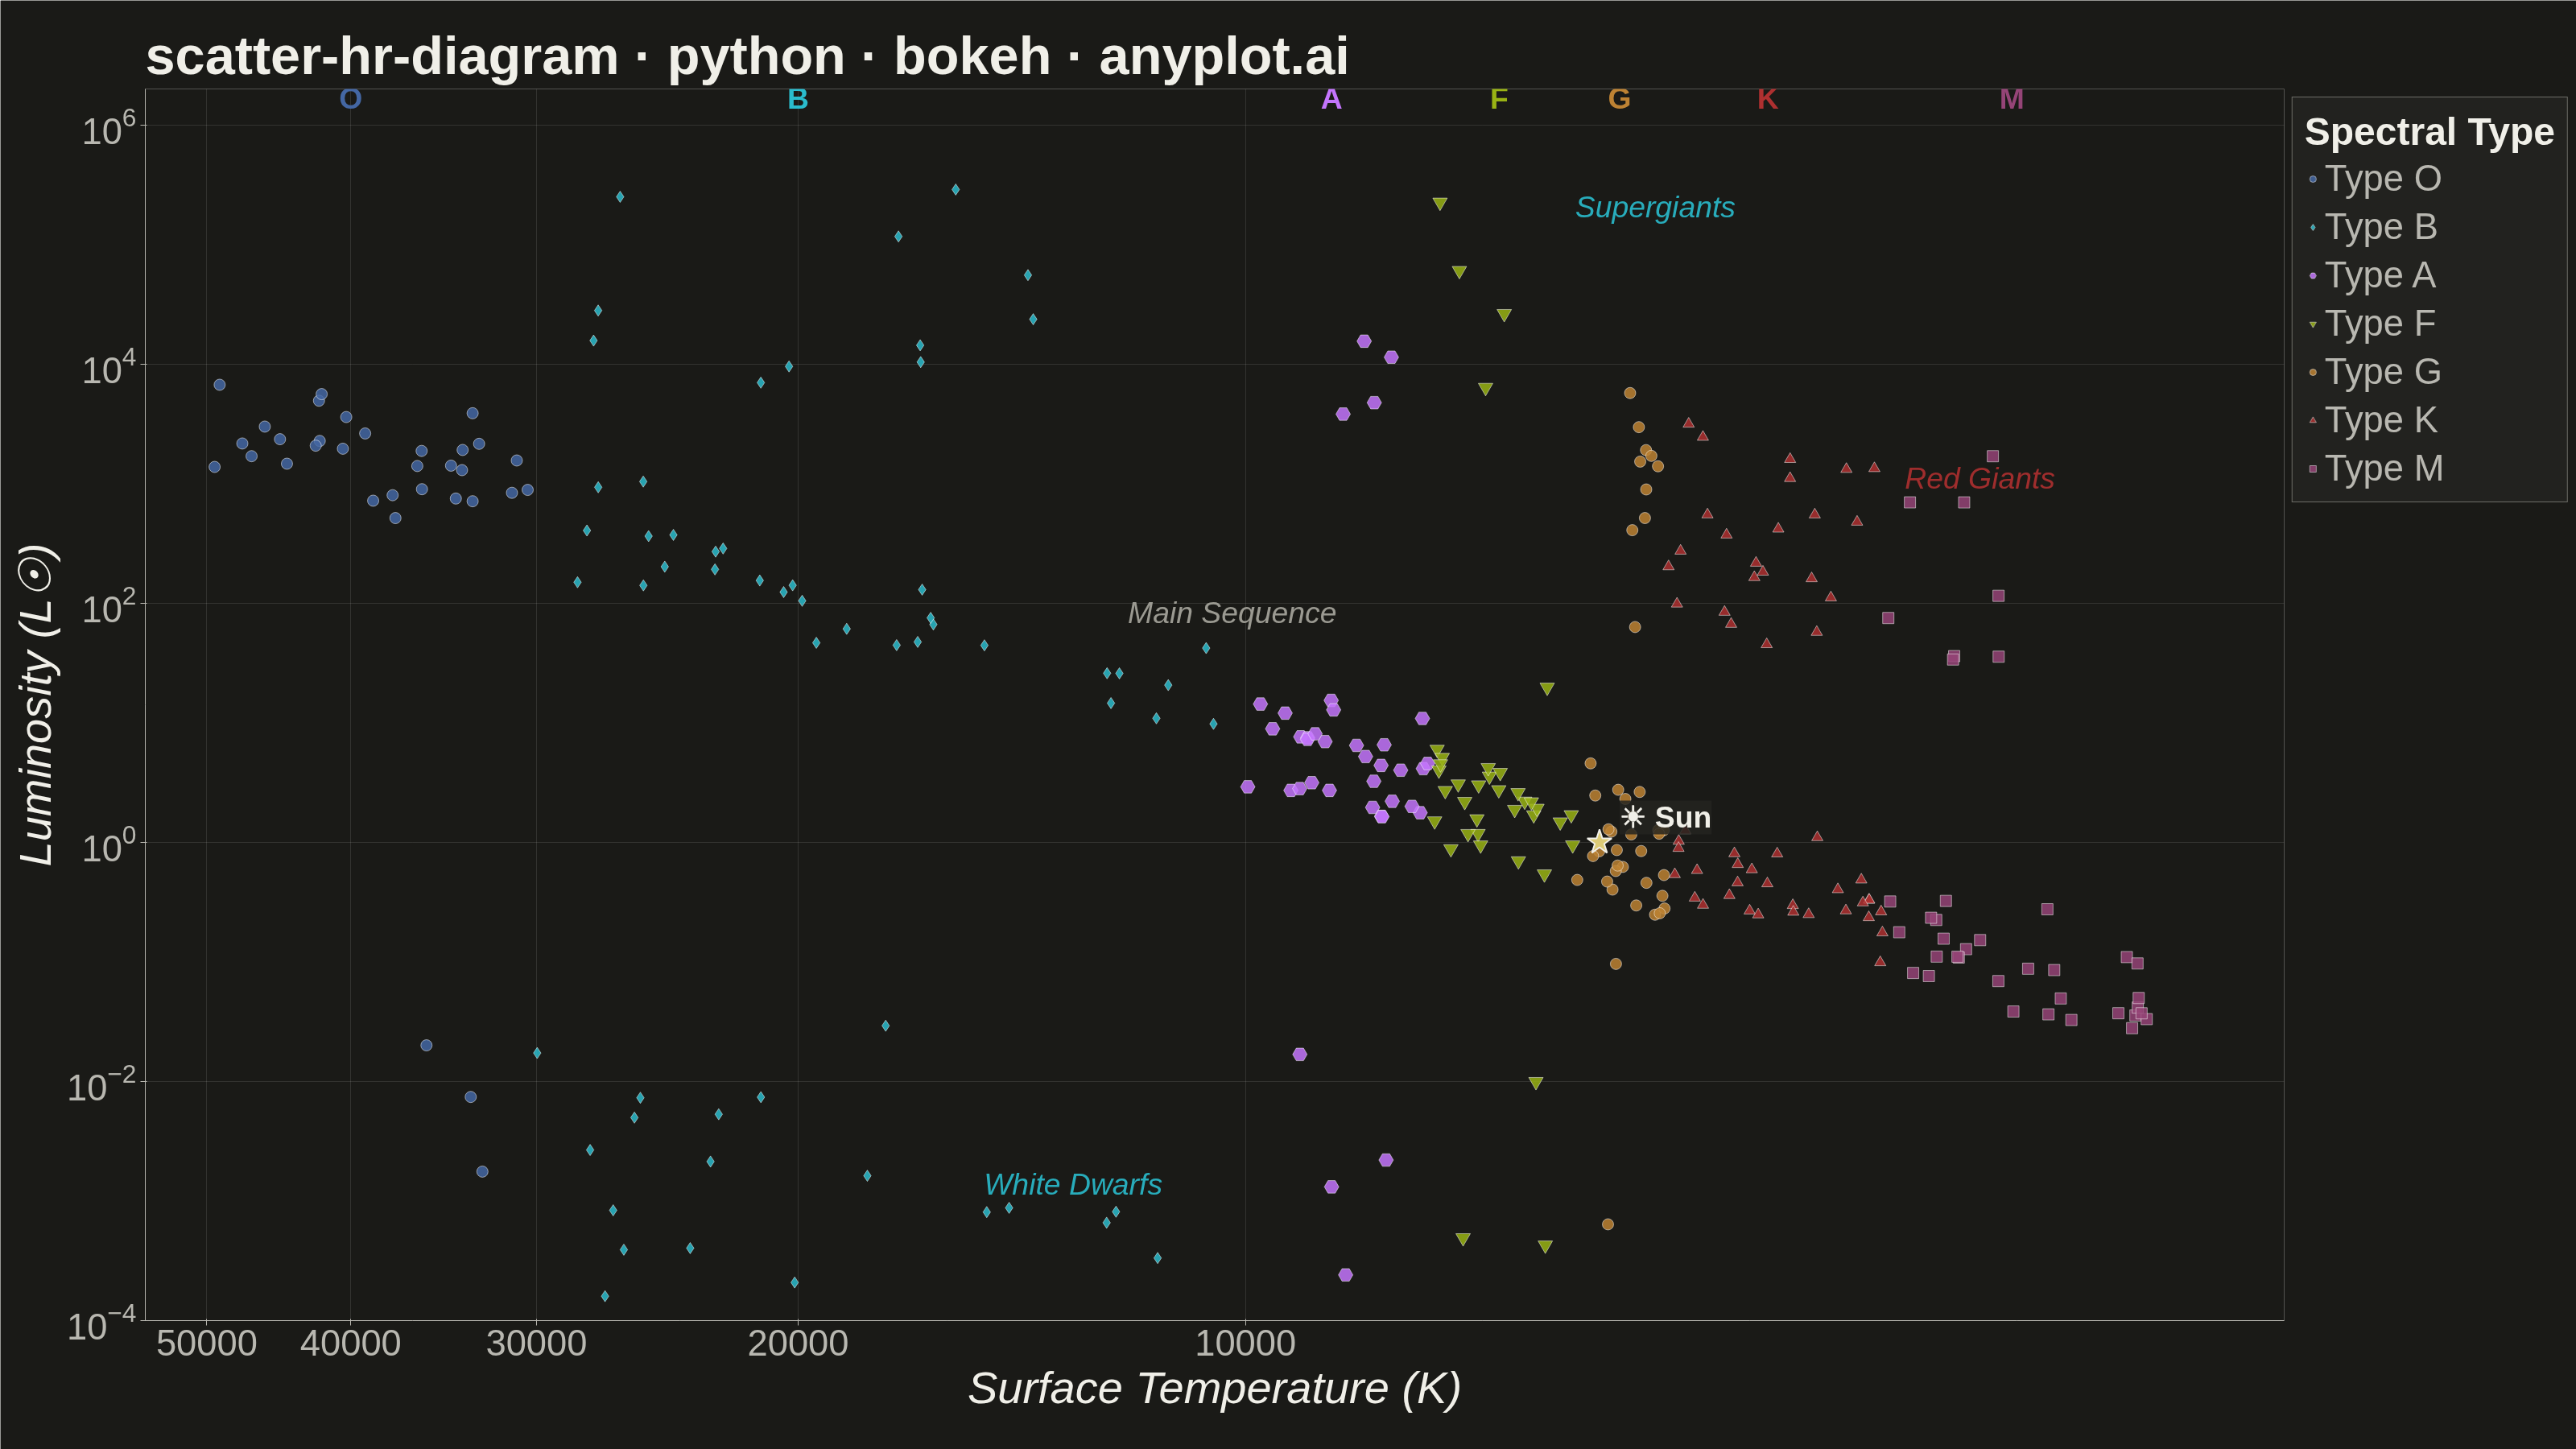
The Hertzsprung-Russell (HR) diagram is the iconic astrophysics scatter plot that shows stellar luminosity (or absolute magnitude) versus surface temperature (or spectral class). Stars naturally cluster along the main sequence diagonal, with distinct regions for red giants, supergiants, and white dwarfs, revealing the fundamental relationship between stellar temperature and brightness.
""" anyplot.ai
scatter-hr-diagram: Hertzsprung-Russell Diagram
Library: bokeh 3.9.0 | Python 3.13.13
Quality: 88/100 | Updated: 2026-06-02
"""

import os
import sys
import time
from pathlib import Path


# bokeh.py is the script name — remove its directory from sys.path so that
# `import bokeh` resolves to the installed package, not this file itself.
_here = os.path.dirname(os.path.abspath(__file__))
sys.path[:] = [p for p in sys.path if os.path.abspath(p) != _here]

import numpy as np
from bokeh.io import output_file, save
from bokeh.models import ColumnDataSource, HoverTool, Label, Legend, LegendItem, Range1d
from bokeh.plotting import figure
from selenium import webdriver
from selenium.webdriver.chrome.options import Options


# Theme tokens
THEME = os.getenv("ANYPLOT_THEME", "light")
PAGE_BG = "#FAF8F1" if THEME == "light" else "#1A1A17"
ELEVATED_BG = "#FFFDF6" if THEME == "light" else "#242420"
INK = "#1A1A17" if THEME == "light" else "#F0EFE8"
INK_SOFT = "#4A4A44" if THEME == "light" else "#B8B7B0"
INK_MUTED = "#6B6A63" if THEME == "light" else "#A8A79F"

# Spectral type colors — closest Imprint palette members (blue=hot, red=cool)
# O/B hot blue → cyan → lavender transition → ochre warm → matte red/rose cool
SPECTRAL_COLORS = {
    "O": "#4467A3",  # Imprint blue — hot blue-type stars
    "B": "#2ABCCD",  # Imprint cyan — slightly cooler blue
    "A": "#C475FD",  # Imprint lavender — blue-white transition
    "F": "#99B314",  # Imprint lime — warm-ish transition
    "G": "#BD8233",  # Imprint ochre — warm yellow, Sun-like
    "K": "#AE3030",  # Imprint matte red — orange-red
    "M": "#954477",  # Imprint rose — cool dark red
}

# Label colors for light theme — #2ABCCD and #C475FD need darkening on cream bg
SPECTRAL_LABEL_COLORS = (
    {"O": "#2A3D6B", "B": "#1A7A88", "A": "#7A40AA", "F": "#667800", "G": "#8A5A1A", "K": "#8A2020", "M": "#6B2A50"}
    if THEME == "light"
    else SPECTRAL_COLORS
)

# Distinct marker shapes per spectral type — redundant encoding for colorblind accessibility
SPECTRAL_MARKERS = {
    "O": "circle",
    "B": "diamond",
    "A": "hex",
    "F": "inverted_triangle",
    "G": "circle",
    "K": "triangle",
    "M": "square",
}

# Dark edge on light theme keeps near-white A/F stars visible on cream background
MARKER_EDGE = INK_SOFT if THEME == "light" else "#FFFFFF"
MARKER_EDGE_WIDTH = 1.5 if THEME == "light" else 0.5

# Data
np.random.seed(42)

spectral_temp_ranges = {
    "O": (30000, 50000),
    "B": (10000, 30000),
    "A": (7500, 10000),
    "F": (6000, 7500),
    "G": (5200, 6000),
    "K": (3700, 5200),
    "M": (2400, 3700),
}

temperatures = []
luminosities = []
spectral_types = []
regions = []

# Main sequence (~210 stars — L proportional to T^4 with observational scatter)
for spec_type, (t_min, t_max) in spectral_temp_ranges.items():
    temps = np.random.uniform(t_min, t_max, 30)
    for t in temps:
        temperatures.append(t)
        log_lum = 4.0 * np.log10(t / 5778) + np.random.normal(0, 0.3)
        luminosities.append(10**log_lum)
        spectral_types.append(spec_type)
        regions.append("Main Sequence")

# Red giants (~40 stars)
for _ in range(40):
    t = np.random.uniform(3000, 5500)
    lum = 10 ** np.random.uniform(1.5, 3.5)
    temperatures.append(t)
    luminosities.append(lum)
    spec = "M" if t < 3700 else ("K" if t < 5200 else "G")
    spectral_types.append(spec)
    regions.append("Red Giants")

# Supergiants (~20 stars)
for _ in range(20):
    t = np.random.uniform(3500, 30000)
    lum = 10 ** np.random.uniform(3.5, 5.5)
    temperatures.append(t)
    luminosities.append(lum)
    if t > 10000:
        spec = "B"
    elif t > 7500:
        spec = "A"
    elif t > 6000:
        spec = "F"
    elif t > 5200:
        spec = "G"
    elif t > 3700:
        spec = "K"
    else:
        spec = "M"
    spectral_types.append(spec)
    regions.append("Supergiants")

# White dwarfs (~30 stars)
for _ in range(30):
    t = np.random.uniform(5000, 40000)
    lum = 10 ** np.random.uniform(-4, -1.5)
    temperatures.append(t)
    luminosities.append(lum)
    if t > 30000:
        spec = "O"
    elif t > 10000:
        spec = "B"
    elif t > 7500:
        spec = "A"
    elif t > 6000:
        spec = "F"
    else:
        spec = "G"
    spectral_types.append(spec)
    regions.append("White Dwarfs")

temperatures = np.array(temperatures)
luminosities = np.array(luminosities)
spectral_types = np.array(spectral_types)
regions = np.array(regions)

# Plot
title_str = "scatter-hr-diagram · python · bokeh · anyplot.ai"

hover = HoverTool(
    tooltips=[
        ("Temperature", "@temperature{0,0} K"),
        ("Luminosity", "@luminosity{0.00e+0} L☉"),
        ("Spectral Type", "@spectral_type"),
        ("Region", "@region"),
    ]
)

p = figure(
    width=3200,
    height=1800,
    title=title_str,
    x_axis_type="log",
    y_axis_type="log",
    x_range=Range1d(55000, 2000),
    y_range=Range1d(1e-4, 2e6),
    x_axis_label="Surface Temperature (K)",
    y_axis_label="Luminosity (L☉)",
    toolbar_location=None,
    min_border_bottom=160,
    min_border_left=180,
    min_border_top=110,
    min_border_right=80,
    tools=[hover],
)

# One scatter series per spectral type for individual legend entries
legend_items = []
spectral_order = ["O", "B", "A", "F", "G", "K", "M"]

for spec_type in spectral_order:
    mask = spectral_types == spec_type
    if not np.any(mask):
        continue
    src = ColumnDataSource(
        data={
            "temperature": temperatures[mask].tolist(),
            "luminosity": luminosities[mask].tolist(),
            "spectral_type": spectral_types[mask].tolist(),
            "region": regions[mask].tolist(),
        }
    )
    # A and F types use larger markers — previously near-invisible on cream bg
    marker_size = 18 if spec_type in ("A", "F") else 14
    renderer = p.scatter(
        x="temperature",
        y="luminosity",
        source=src,
        size=marker_size,
        marker=SPECTRAL_MARKERS[spec_type],
        fill_color=SPECTRAL_COLORS[spec_type],
        line_color=MARKER_EDGE,
        line_width=MARKER_EDGE_WIDTH,
        fill_alpha=0.85,
    )
    legend_items.append(LegendItem(label=f"Type {spec_type}", renderers=[renderer]))

# Legend — 34pt text is readable at 3200×1800
legend = Legend(
    items=legend_items,
    label_text_color=INK_SOFT,
    label_text_font_size="34pt",
    background_fill_color=ELEVATED_BG,
    background_fill_alpha=0.9,
    border_line_color=INK_SOFT,
    border_line_width=1,
    click_policy="hide",
    title="Spectral Type",
    title_text_color=INK,
    title_text_font_size="36pt",
    title_text_font_style="bold",
    spacing=8,
    padding=15,
)
p.add_layout(legend, "right")

# Sun reference marker (G-type, T=5778 K, L=1.0 L☉)
sun_src = ColumnDataSource(data={"temperature": [5778], "luminosity": [1.0]})
p.scatter(
    x="temperature",
    y="luminosity",
    source=sun_src,
    size=32,
    fill_color="#DDCC77",  # amber anchor — distinctive golden reference for the Sun
    line_color=INK,
    line_width=2,
    marker="star",
    fill_alpha=1.0,
)
p.add_layout(
    Label(
        x=5778,
        y=1.0,
        text="☀ Sun",
        x_offset=25,
        y_offset=10,
        text_font_size="28pt",
        text_font_style="bold",
        text_color=INK,
        background_fill_color=ELEVATED_BG,
        background_fill_alpha=0.85,
        x_units="data",
        y_units="data",
    )
)

# Region labels — Main Sequence repositioned above dense data cloud
region_labels = [
    ("Main Sequence", 12000, 60, INK_MUTED),
    ("Red Giants", 3600, 800, SPECTRAL_LABEL_COLORS["K"]),
    ("Supergiants", 6000, 150000, SPECTRAL_LABEL_COLORS["B"]),
    ("White Dwarfs", 15000, 0.001, SPECTRAL_LABEL_COLORS["B"]),
]
for label_text, lx, ly, lcolor in region_labels:
    p.add_layout(
        Label(
            x=lx,
            y=ly,
            text=label_text,
            text_font_size="28pt",
            text_font_style="italic",
            text_color=lcolor,
            text_alpha=0.9,
            x_units="data",
            y_units="data",
        )
    )

# Spectral class letters along the top
spectral_boundaries = [("O", 40000), ("B", 20000), ("A", 8750), ("F", 6750), ("G", 5600), ("K", 4450), ("M", 3050)]
for spec_label, spec_temp in spectral_boundaries:
    p.add_layout(
        Label(
            x=spec_temp,
            y=1.2e6,
            text=spec_label,
            text_font_size="28pt",
            text_font_style="bold",
            text_color=SPECTRAL_LABEL_COLORS[spec_label],
            text_align="center",
            x_units="data",
            y_units="data",
        )
    )

# Style — theme-adaptive chrome
p.title.text_font_size = "50pt"
p.title.text_color = INK
p.title.text_font_style = "bold"

p.background_fill_color = PAGE_BG
p.border_fill_color = PAGE_BG
p.outline_line_color = None  # remove full box outline — L-shaped spine (left+bottom) via axis lines

p.xaxis.axis_label_text_font_size = "42pt"
p.yaxis.axis_label_text_font_size = "42pt"
p.xaxis.major_label_text_font_size = "34pt"
p.yaxis.major_label_text_font_size = "34pt"
p.xaxis.axis_label_text_color = INK
p.yaxis.axis_label_text_color = INK
p.xaxis.major_label_text_color = INK_SOFT
p.yaxis.major_label_text_color = INK_SOFT
p.xaxis.axis_line_color = INK_SOFT
p.yaxis.axis_line_color = INK_SOFT
p.xaxis.major_tick_line_color = INK_SOFT
p.yaxis.major_tick_line_color = INK_SOFT
p.xaxis.minor_tick_line_color = None
p.yaxis.minor_tick_line_color = None

p.xgrid.grid_line_color = INK
p.ygrid.grid_line_color = INK
p.xgrid.grid_line_alpha = 0.12
p.ygrid.grid_line_alpha = 0.12

# Save HTML then screenshot via headless Chrome
output_file(f"plot-{THEME}.html", title="Hertzsprung-Russell Diagram")
save(p)

# Use CDP setDeviceMetricsOverride — --window-size alone gives 1661 instead of 1800
# in headless=new Chrome because the browser chrome eats part of the requested height.
W, H = 3200, 1800
opts = Options()
for arg in (
    "--headless=new",
    "--no-sandbox",
    "--disable-dev-shm-usage",
    "--disable-gpu",
    f"--window-size={W},{H}",
    "--hide-scrollbars",
):
    opts.add_argument(arg)
driver = webdriver.Chrome(options=opts)
driver.execute_cdp_cmd(
    "Emulation.setDeviceMetricsOverride", {"width": W, "height": H, "deviceScaleFactor": 1, "mobile": False}
)
driver.get(f"file://{Path(f'plot-{THEME}.html').resolve()}")
time.sleep(3)
driver.save_screenshot(f"plot-{THEME}.png")
driver.quit()

# Pin PNG to exact dims so the post-render gate passes
from PIL import Image as _PILImage


_img = _PILImage.open(f"plot-{THEME}.png").convert("RGB")
if _img.size != (W, H):
    _norm = _PILImage.new("RGB", (W, H), PAGE_BG)
    _norm.paste(_img, ((W - _img.size[0]) // 2, (H - _img.size[1]) // 2))
    _norm.save(f"plot-{THEME}.png")
Runnable source as JSON, for any HTTP client: https://api.anyplot.ai/specs/scatter-hr-diagram/bokeh/code. Any spec id and library id listed in llms-full.txt fit the same URL shape; every URL below is complete and callable.
{
  "spec_id": "scatter-hr-diagram",
  "language": "python",
  "library": "bokeh",
  "page": "https://anyplot.ai/scatter-hr-diagram/python/bokeh",
  "hub": "https://anyplot.ai/scatter-hr-diagram",
  "code_json": "https://api.anyplot.ai/specs/scatter-hr-diagram/bokeh/code",
  "spec_json": "https://api.anyplot.ai/specs/scatter-hr-diagram",
  "render_light_png": "https://storage.googleapis.com/anyplot-images/plots/scatter-hr-diagram/python/bokeh/plot-light.png",
  "render_dark_png": "https://storage.googleapis.com/anyplot-images/plots/scatter-hr-diagram/python/bokeh/plot-dark.png",
  "interactive_light_html": "https://storage.googleapis.com/anyplot-images/plots/scatter-hr-diagram/python/bokeh/plot-light.html",
  "interactive_dark_html": "https://storage.googleapis.com/anyplot-images/plots/scatter-hr-diagram/python/bokeh/plot-dark.html",
  "quality_score": 88.0,
  "license": "MIT",
  "guide": "https://anyplot.ai/llms.txt"
}
Part of Hertzsprung-Russell Diagram on anyplot.ai.