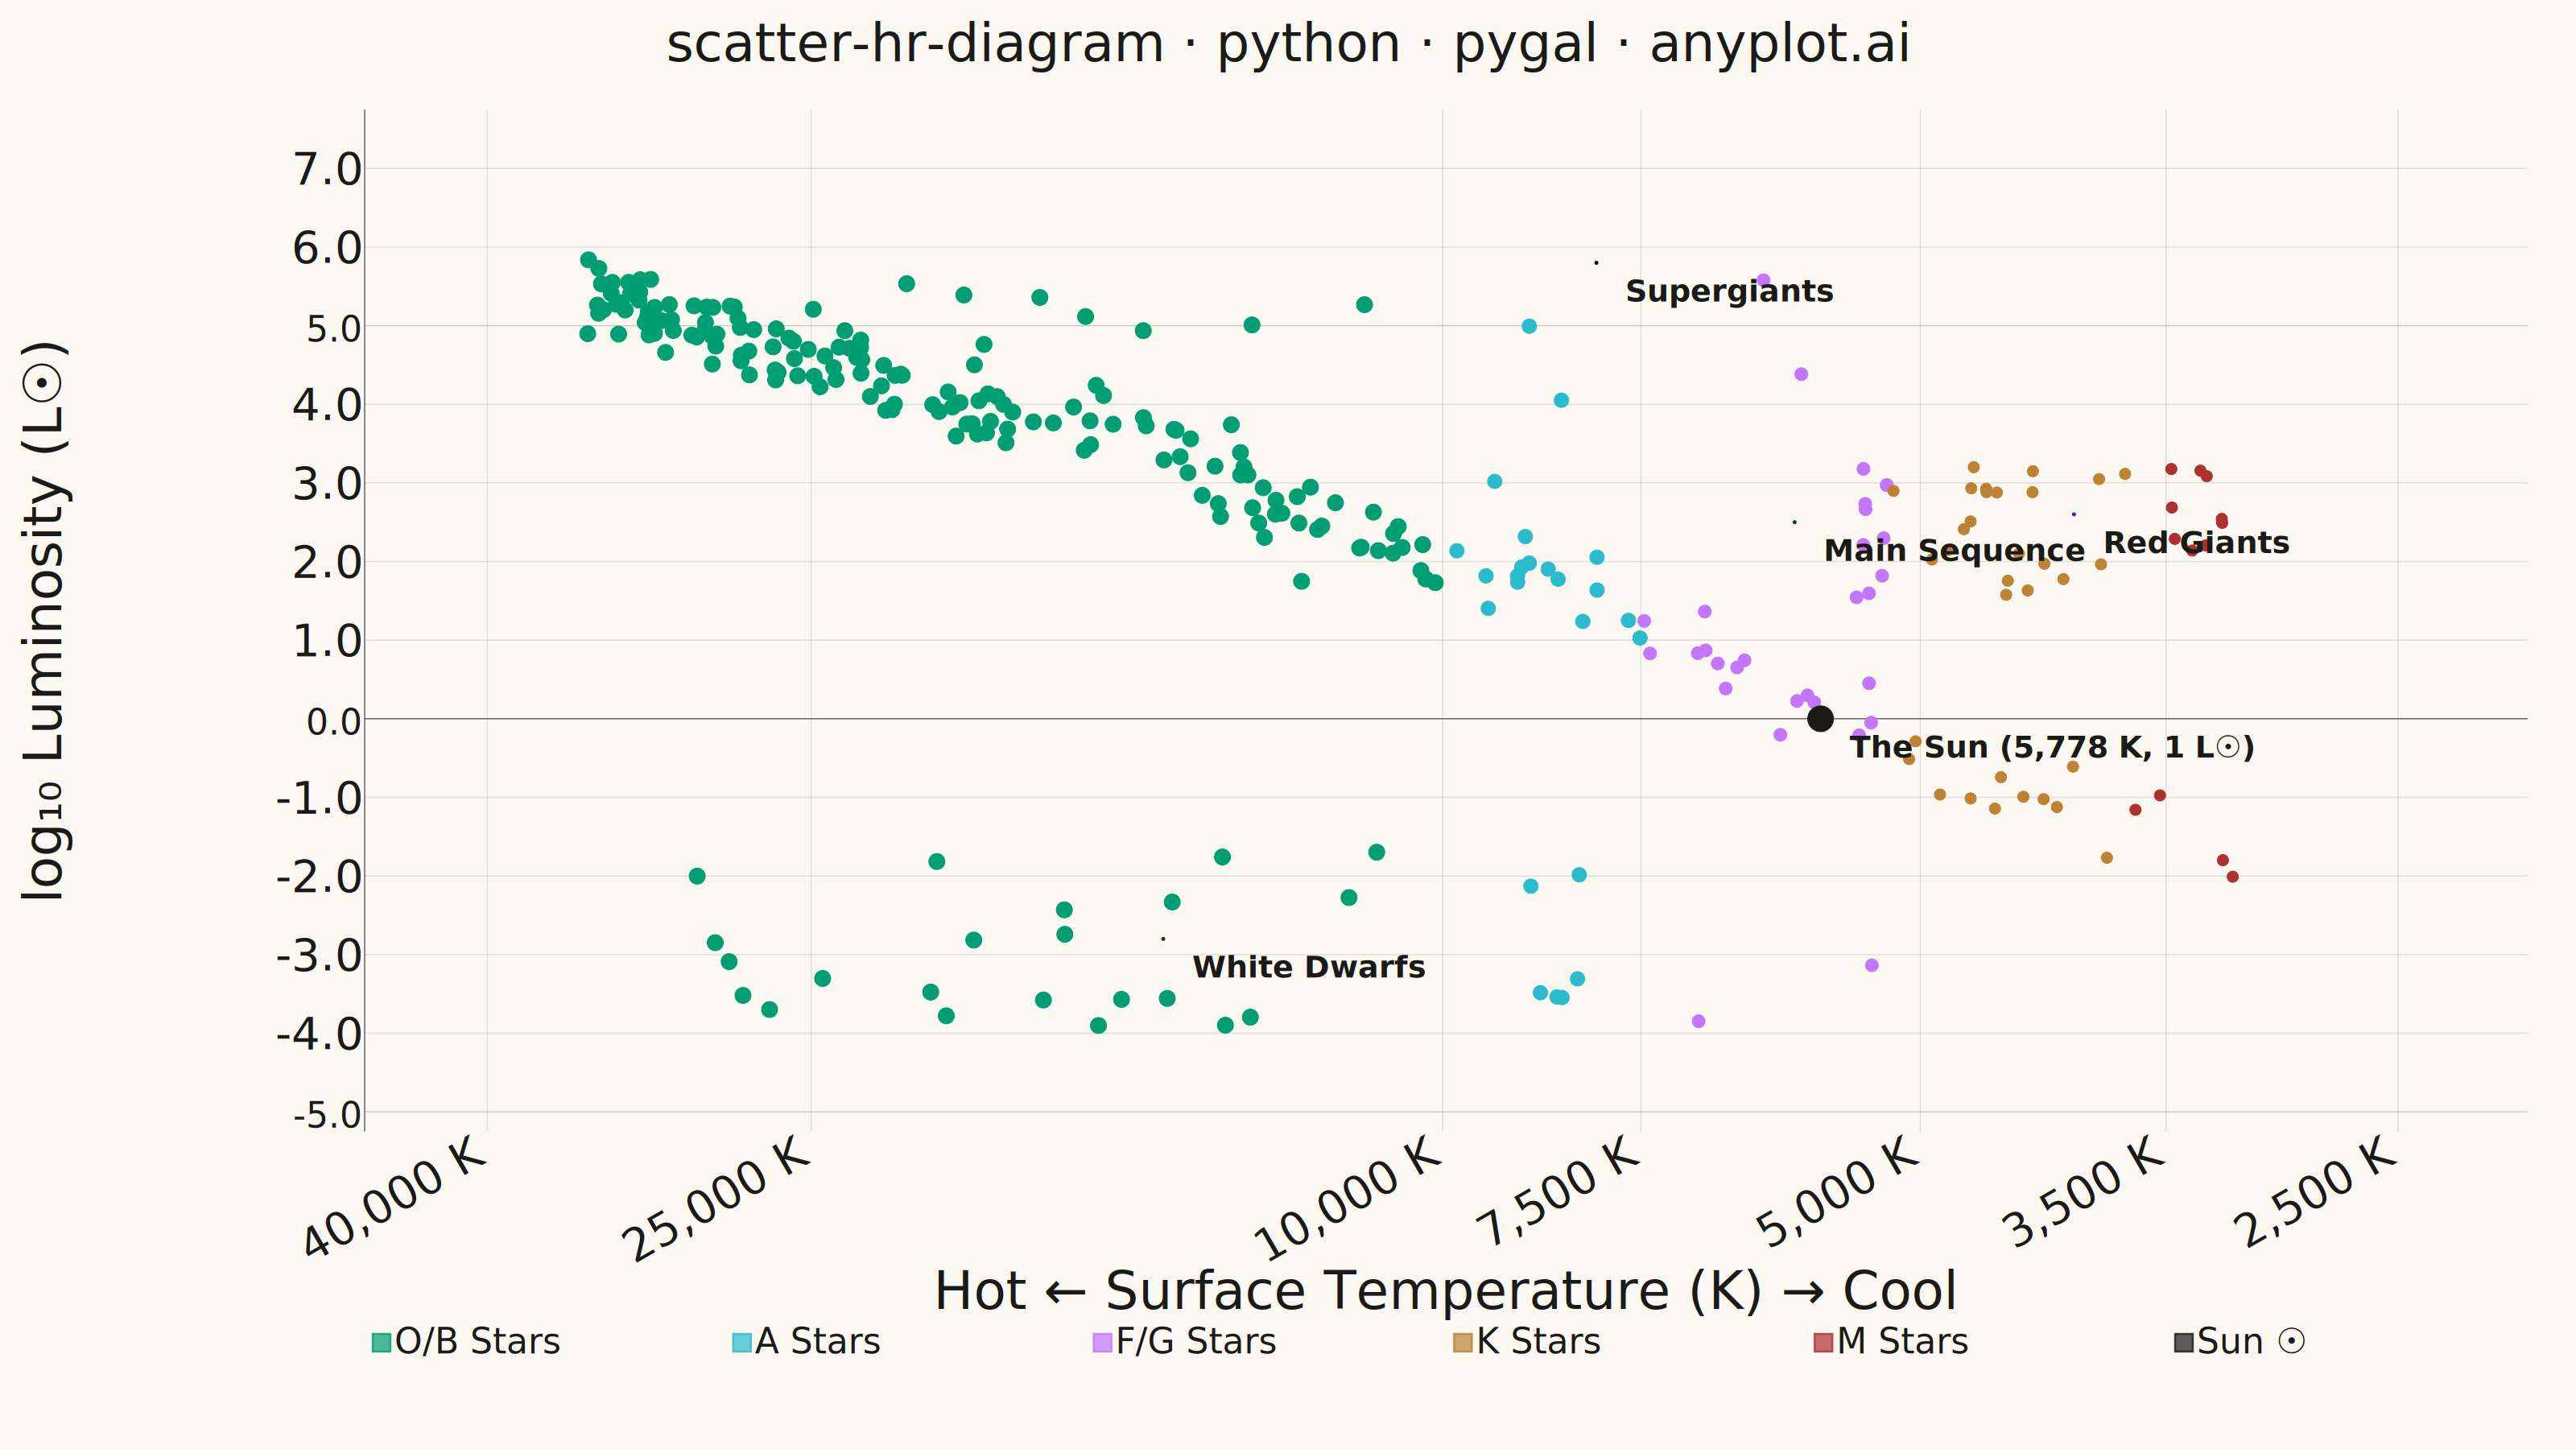
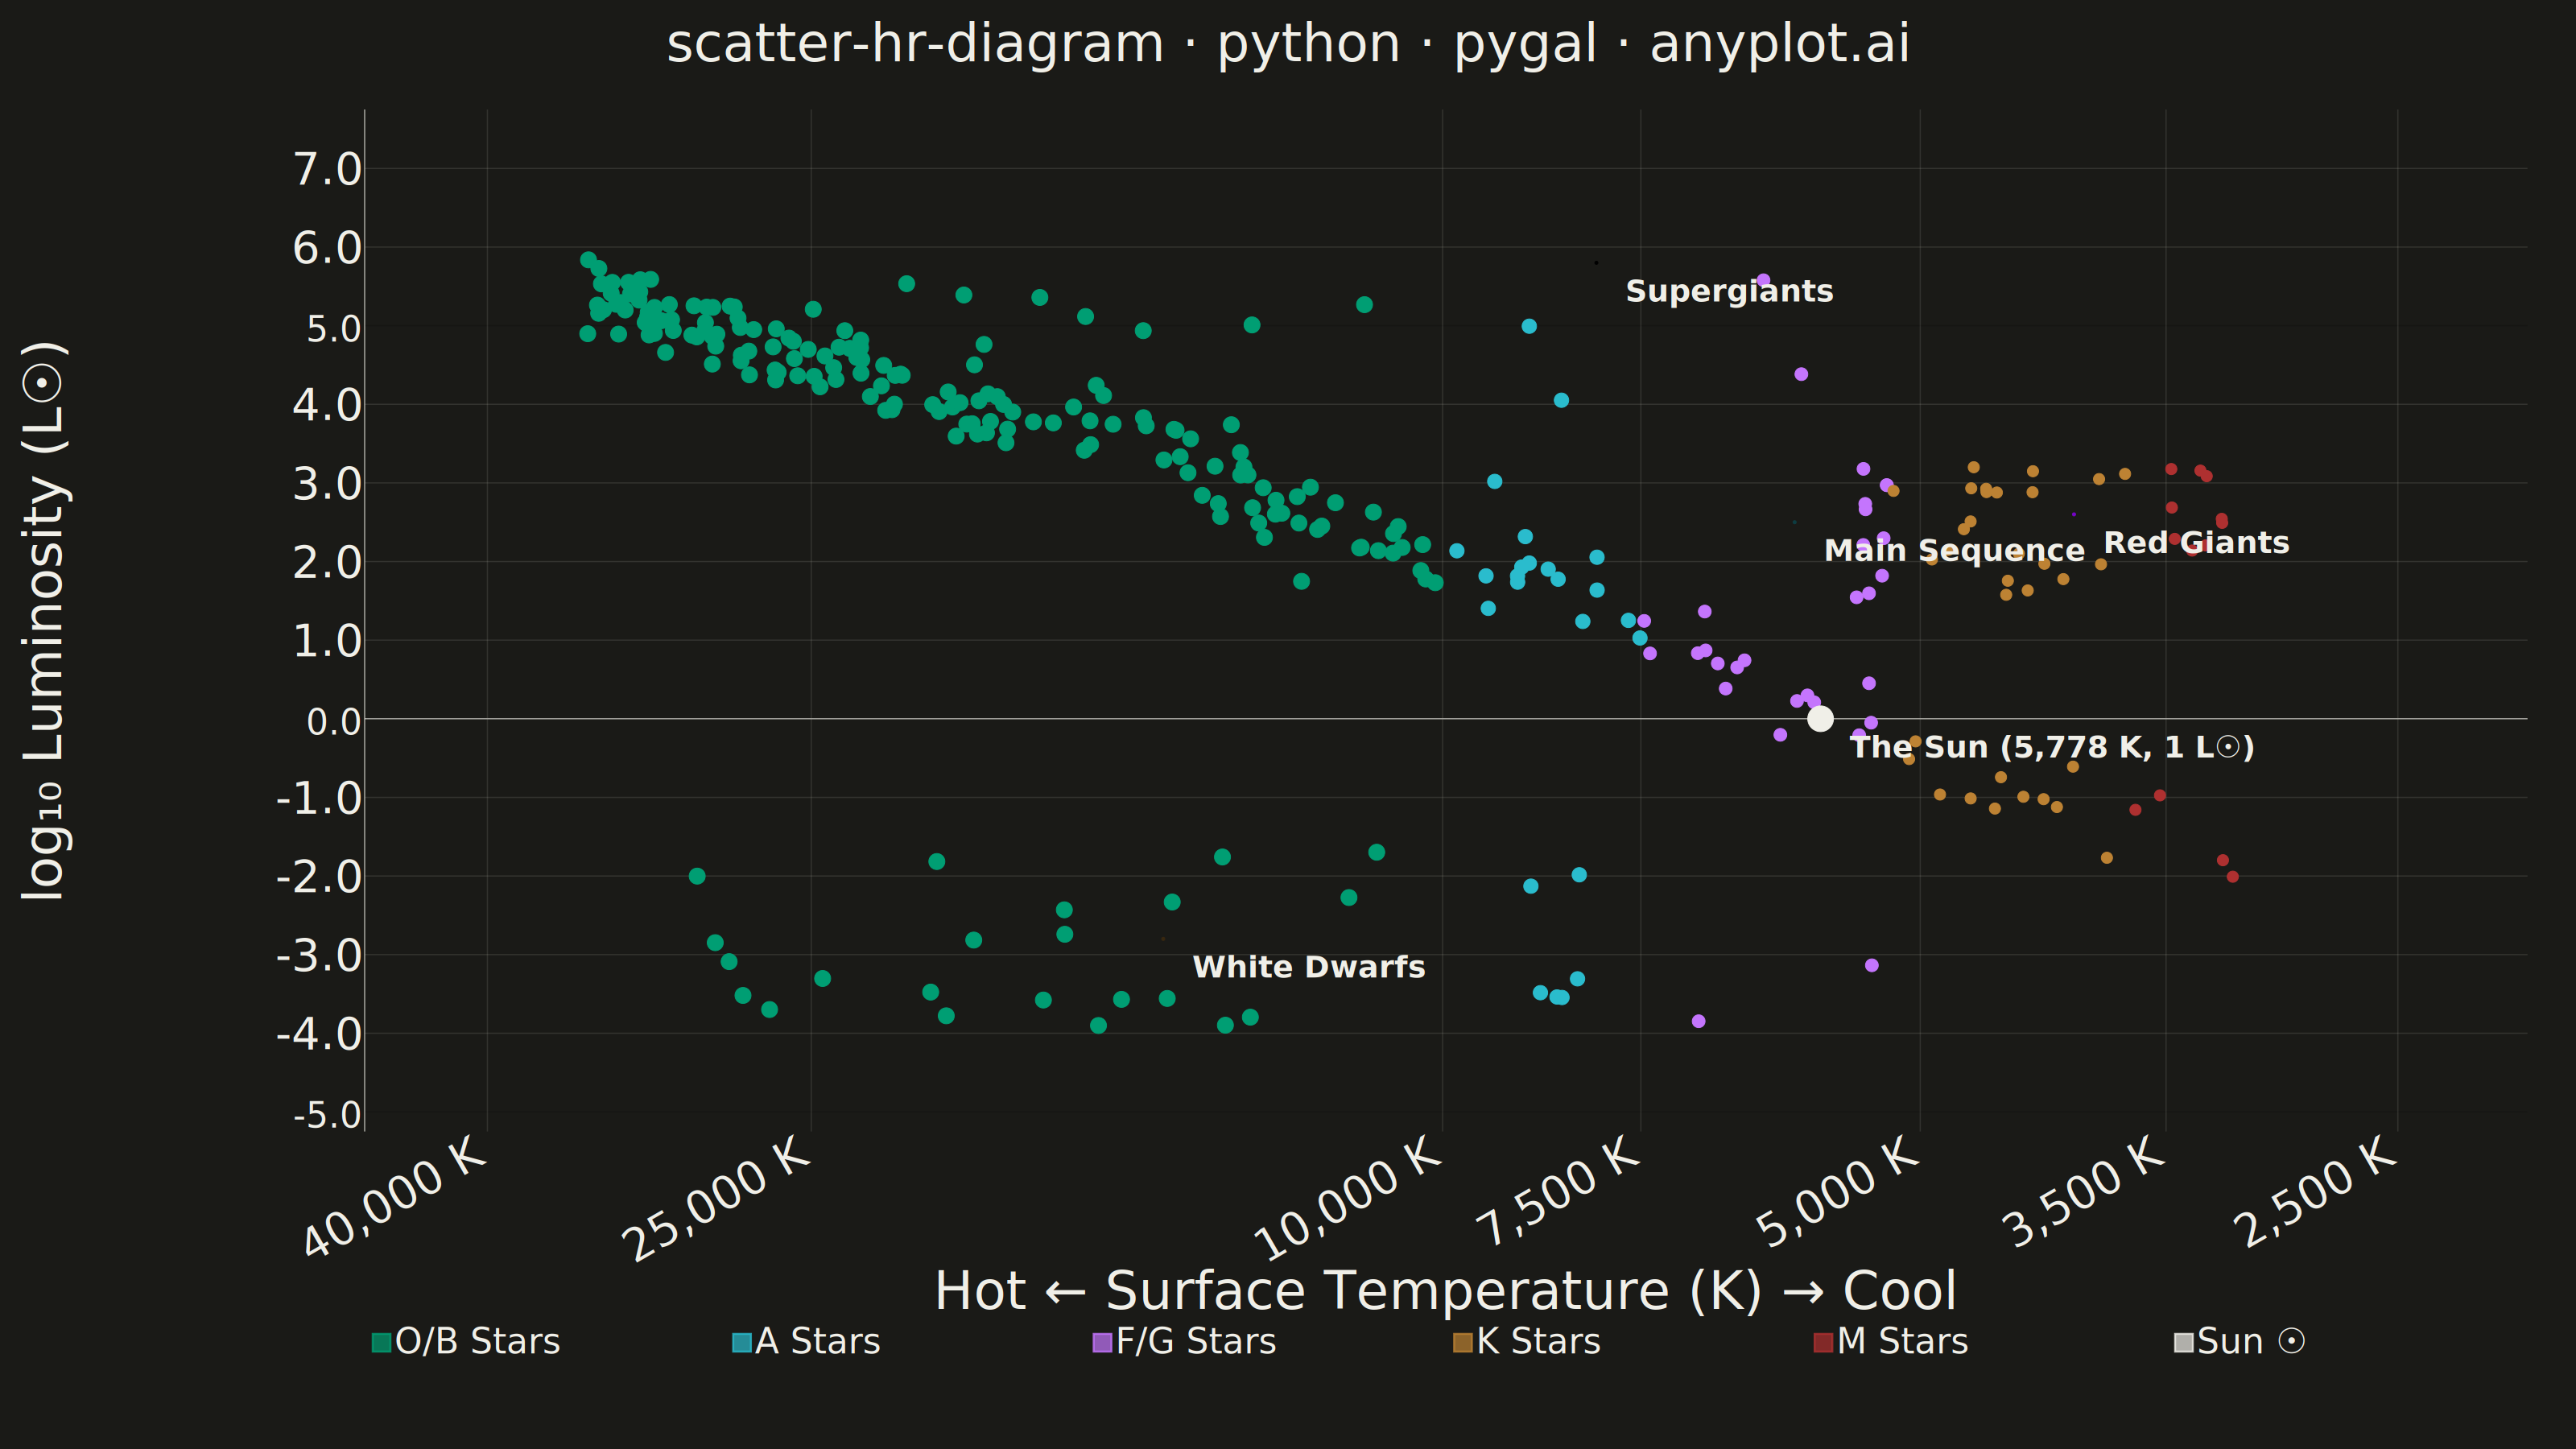
The Hertzsprung-Russell (HR) diagram is the iconic astrophysics scatter plot that shows stellar luminosity (or absolute magnitude) versus surface temperature (or spectral class). Stars naturally cluster along the main sequence diagonal, with distinct regions for red giants, supergiants, and white dwarfs, revealing the fundamental relationship between stellar temperature and brightness.
""" anyplot.ai
scatter-hr-diagram: Hertzsprung-Russell Diagram
Library: pygal 3.1.0 | Python 3.13.13
Quality: 85/100 | Updated: 2026-06-02
"""

import os
import sys


# Remove this file's own directory from sys.path before importing pygal,
# so the installed package is found rather than this script itself.
_here = os.path.dirname(os.path.abspath(__file__))
sys.path = [p for p in sys.path if os.path.abspath(p or ".") != _here]

import numpy as np
import pygal
from pygal.style import Style


# Theme
THEME = os.getenv("ANYPLOT_THEME", "light")
PAGE_BG = "#FAF8F1" if THEME == "light" else "#1A1A17"
INK = "#1A1A17" if THEME == "light" else "#F0EFE8"
INK_MUTED = "#6B6A63" if THEME == "light" else "#A8A79F"

# Imprint categorical palette — first series must be brand green per Imprint rule.
# F/G Stars: lavender replaces amber #DDCC77 (reserved for warning/caution only).
SPECTRAL_COLORS = (
    "#009E73",  # O/B Stars — brand green (Imprint first-series rule)
    "#2ABCCD",  # A Stars — Imprint cyan
    "#C475FD",  # F/G Stars — Imprint lavender (replaces out-of-pool #DDCC77)
    "#BD8233",  # K Stars — Imprint ochre (orange-cool)
    "#AE3030",  # M Stars — Imprint matte red (cool, red)
    INK,  # Sun ☉ — theme-adaptive ink (distinct reference marker)
)

# Data — synthetic stellar populations for the HR diagram
np.random.seed(42)

# Main sequence stars (diagonal band: hot/bright to cool/dim)
n_main = 200
main_temp = np.random.uniform(3000, 35000, n_main)
main_log_lum = np.interp(main_temp, [3000, 5000, 8000, 15000, 35000], [-2, -0.5, 1.5, 3.5, 5.5])
main_log_lum += np.random.normal(0, 0.3, n_main)

# Red giants (cool but luminous)
n_giants = 40
giant_temp = np.random.uniform(3200, 5500, n_giants)
giant_log_lum = np.random.uniform(1.5, 3.2, n_giants)

# Supergiants (very luminous, range of temperatures)
n_super = 15
super_temp = np.random.uniform(3500, 25000, n_super)
super_log_lum = np.random.uniform(4.0, 5.8, n_super)

# White dwarfs (hot but very dim)
n_wd = 30
wd_temp = np.random.uniform(5000, 30000, n_wd)
wd_log_lum = np.random.uniform(-4, -1.5, n_wd)

# Sun as reference
sun_temp = 5778.0
sun_log_lum = 0.0

# Combine all stars
all_temps = np.concatenate([main_temp, giant_temp, super_temp, wd_temp])
all_log_lums = np.concatenate([main_log_lum, giant_log_lum, super_log_lum, wd_log_lum])

# Spectral type classification based on temperature
spectral_bounds = [
    ("O/B Stars", 10000, 50000),
    ("A Stars", 7500, 10000),
    ("F/G Stars", 5200, 7500),
    ("K Stars", 3700, 5200),
    ("M Stars", 2000, 3700),
]

groups = {name: [] for name, _, _ in spectral_bounds}
for t, log_l in zip(all_temps, all_log_lums, strict=True):
    for name, lo, hi in spectral_bounds:
        if lo <= t < hi or (name == "O/B Stars" and t >= hi):
            groups[name].append((-np.log10(float(t)), float(log_l)))
            break

# Style — Imprint palette with theme-adaptive chrome
font = "DejaVu Sans, Helvetica, Arial, sans-serif"
custom_style = Style(
    background=PAGE_BG,
    plot_background=PAGE_BG,
    foreground=INK,
    foreground_strong=INK,
    foreground_subtle=INK_MUTED,
    guide_stroke_color=INK_MUTED,
    colors=SPECTRAL_COLORS,
    font_family=font,
    title_font_family=font,
    title_font_size=66,
    label_font_size=56,
    major_label_font_size=44,
    legend_font_size=44,
    legend_font_family=font,
    value_font_size=36,
    stroke_width=2.5,
    tooltip_font_size=28,
    tooltip_font_family=font,
    opacity=0.70,
    opacity_hover=0.95,
)

# Custom x-axis labels: map -log10(T) values to human-readable temperatures
x_label_temps = [40000, 25000, 10000, 7500, 5000, 3500, 2500]
x_labels = [{"value": -np.log10(t), "label": f"{t:,} K"} for t in x_label_temps]

# Dot sizes per spectral group (M Stars increased from 5→7 for better visibility)
dot_sizes = {"O/B Stars": 10, "A Stars": 9, "F/G Stars": 8, "K Stars": 7, "M Stars": 7}

# Chart — XY scatter; -log10(T) x-axis reverses direction and spreads cool stars
chart = pygal.XY(
    width=3200,
    height=1800,
    style=custom_style,
    title="scatter-hr-diagram · python · pygal · anyplot.ai",
    x_title="Hot  ←  Surface Temperature (K)  →  Cool",
    y_title="log₁₀ Luminosity (L☉)",
    show_legend=True,
    legend_at_bottom=True,
    legend_at_bottom_columns=6,
    legend_box_size=22,
    stroke=False,
    dots_size=8,
    show_x_guides=True,
    show_y_guides=True,
    x_labels=x_labels,
    x_label_rotation=-30,
    xrange=(-np.log10(45000), -np.log10(2200)),
    range=(-5, 7.5),
    x_value_formatter=lambda x: f"{10 ** abs(x):,.0f} K",
    value_formatter=lambda y: f"{y:.1f}",
    margin_bottom=120,
    margin_left=90,
    margin_right=60,
    margin_top=60,
    truncate_legend=-1,
    print_labels=True,
    print_values=False,
    css=[
        "file://style.css",
        "file://graph.css",
        (
            f"inline:"
            f".label{{font-size:38px !important; font-weight:bold !important;"
            f" font-family:DejaVu Sans, sans-serif !important;"
            f" fill:{INK} !important; paint-order:stroke fill;"
            f" stroke:{PAGE_BG} !important; stroke-width:5px !important;}}"
        ),
        # Soften grid: solid thin lines, low opacity; remove full box frame.
        (
            "inline:"
            ".guide{stroke-dasharray:none !important;"
            " stroke-width:1.5px !important;"
            " stroke-opacity:0.18 !important;}"
            ".background,.chart-background"
            "{stroke:none !important;}"
        ),
    ],
    js=[],
)

# Add each spectral group as a separate series
series_order = ["O/B Stars", "A Stars", "F/G Stars", "K Stars", "M Stars"]
for stype in series_order:
    pts = groups.get(stype, [])
    chart.add(stype, pts, stroke=False, dots_size=dot_sizes[stype])

# Add the Sun as a distinct reference point (6th color = INK, theme-adaptive)
chart.add(
    "Sun ☉",
    [{"value": (-np.log10(sun_temp), sun_log_lum), "label": "The Sun (5,778 K, 1 L☉)"}],
    stroke=False,
    dots_size=16,
)

# Region labels placed in low-density zones to minimise data overlap
region_labels = [
    ("Supergiants", -np.log10(8000), 5.8),
    ("Main Sequence", -np.log10(6000), 2.5),
    ("Red Giants", -np.log10(4000), 2.6),
    ("White Dwarfs", -np.log10(15000), -2.8),
]
for region_name, rx, ry in region_labels:
    chart.add(None, [{"value": (rx, ry), "label": region_name}], stroke=False, dots_size=2, show_dots=True)

# Save — theme-suffixed output files (always in this script's directory)
chart.render_to_png(os.path.join(_here, f"plot-{THEME}.png"))
with open(os.path.join(_here, f"plot-{THEME}.html"), "wb") as f:
    f.write(chart.render())
Runnable source as JSON, for any HTTP client: https://api.anyplot.ai/specs/scatter-hr-diagram/pygal/code. Any spec id and library id listed in llms-full.txt fit the same URL shape; every URL below is complete and callable.
{
  "spec_id": "scatter-hr-diagram",
  "language": "python",
  "library": "pygal",
  "page": "https://anyplot.ai/scatter-hr-diagram/python/pygal",
  "hub": "https://anyplot.ai/scatter-hr-diagram",
  "code_json": "https://api.anyplot.ai/specs/scatter-hr-diagram/pygal/code",
  "spec_json": "https://api.anyplot.ai/specs/scatter-hr-diagram",
  "render_light_png": "https://storage.googleapis.com/anyplot-images/plots/scatter-hr-diagram/python/pygal/plot-light.png",
  "render_dark_png": "https://storage.googleapis.com/anyplot-images/plots/scatter-hr-diagram/python/pygal/plot-dark.png",
  "interactive_light_html": "https://storage.googleapis.com/anyplot-images/plots/scatter-hr-diagram/python/pygal/plot-light.html",
  "interactive_dark_html": "https://storage.googleapis.com/anyplot-images/plots/scatter-hr-diagram/python/pygal/plot-dark.html",
  "quality_score": 85.0,
  "license": "MIT",
  "guide": "https://anyplot.ai/llms.txt"
}
Part of Hertzsprung-Russell Diagram on anyplot.ai.