The same plot in 14 other libraries — Python: Altair, Bokeh, lets-plot, Matplotlib, Plotly, plotnine, Pygal, Seaborn; R: ggplot2; JavaScript: Chart.js, D3.js, Apache ECharts, Highcharts, MUI X Charts. Compare all 15 side by side: Hertzsprung-Russell Diagram in Python, R, Julia and JavaScript.
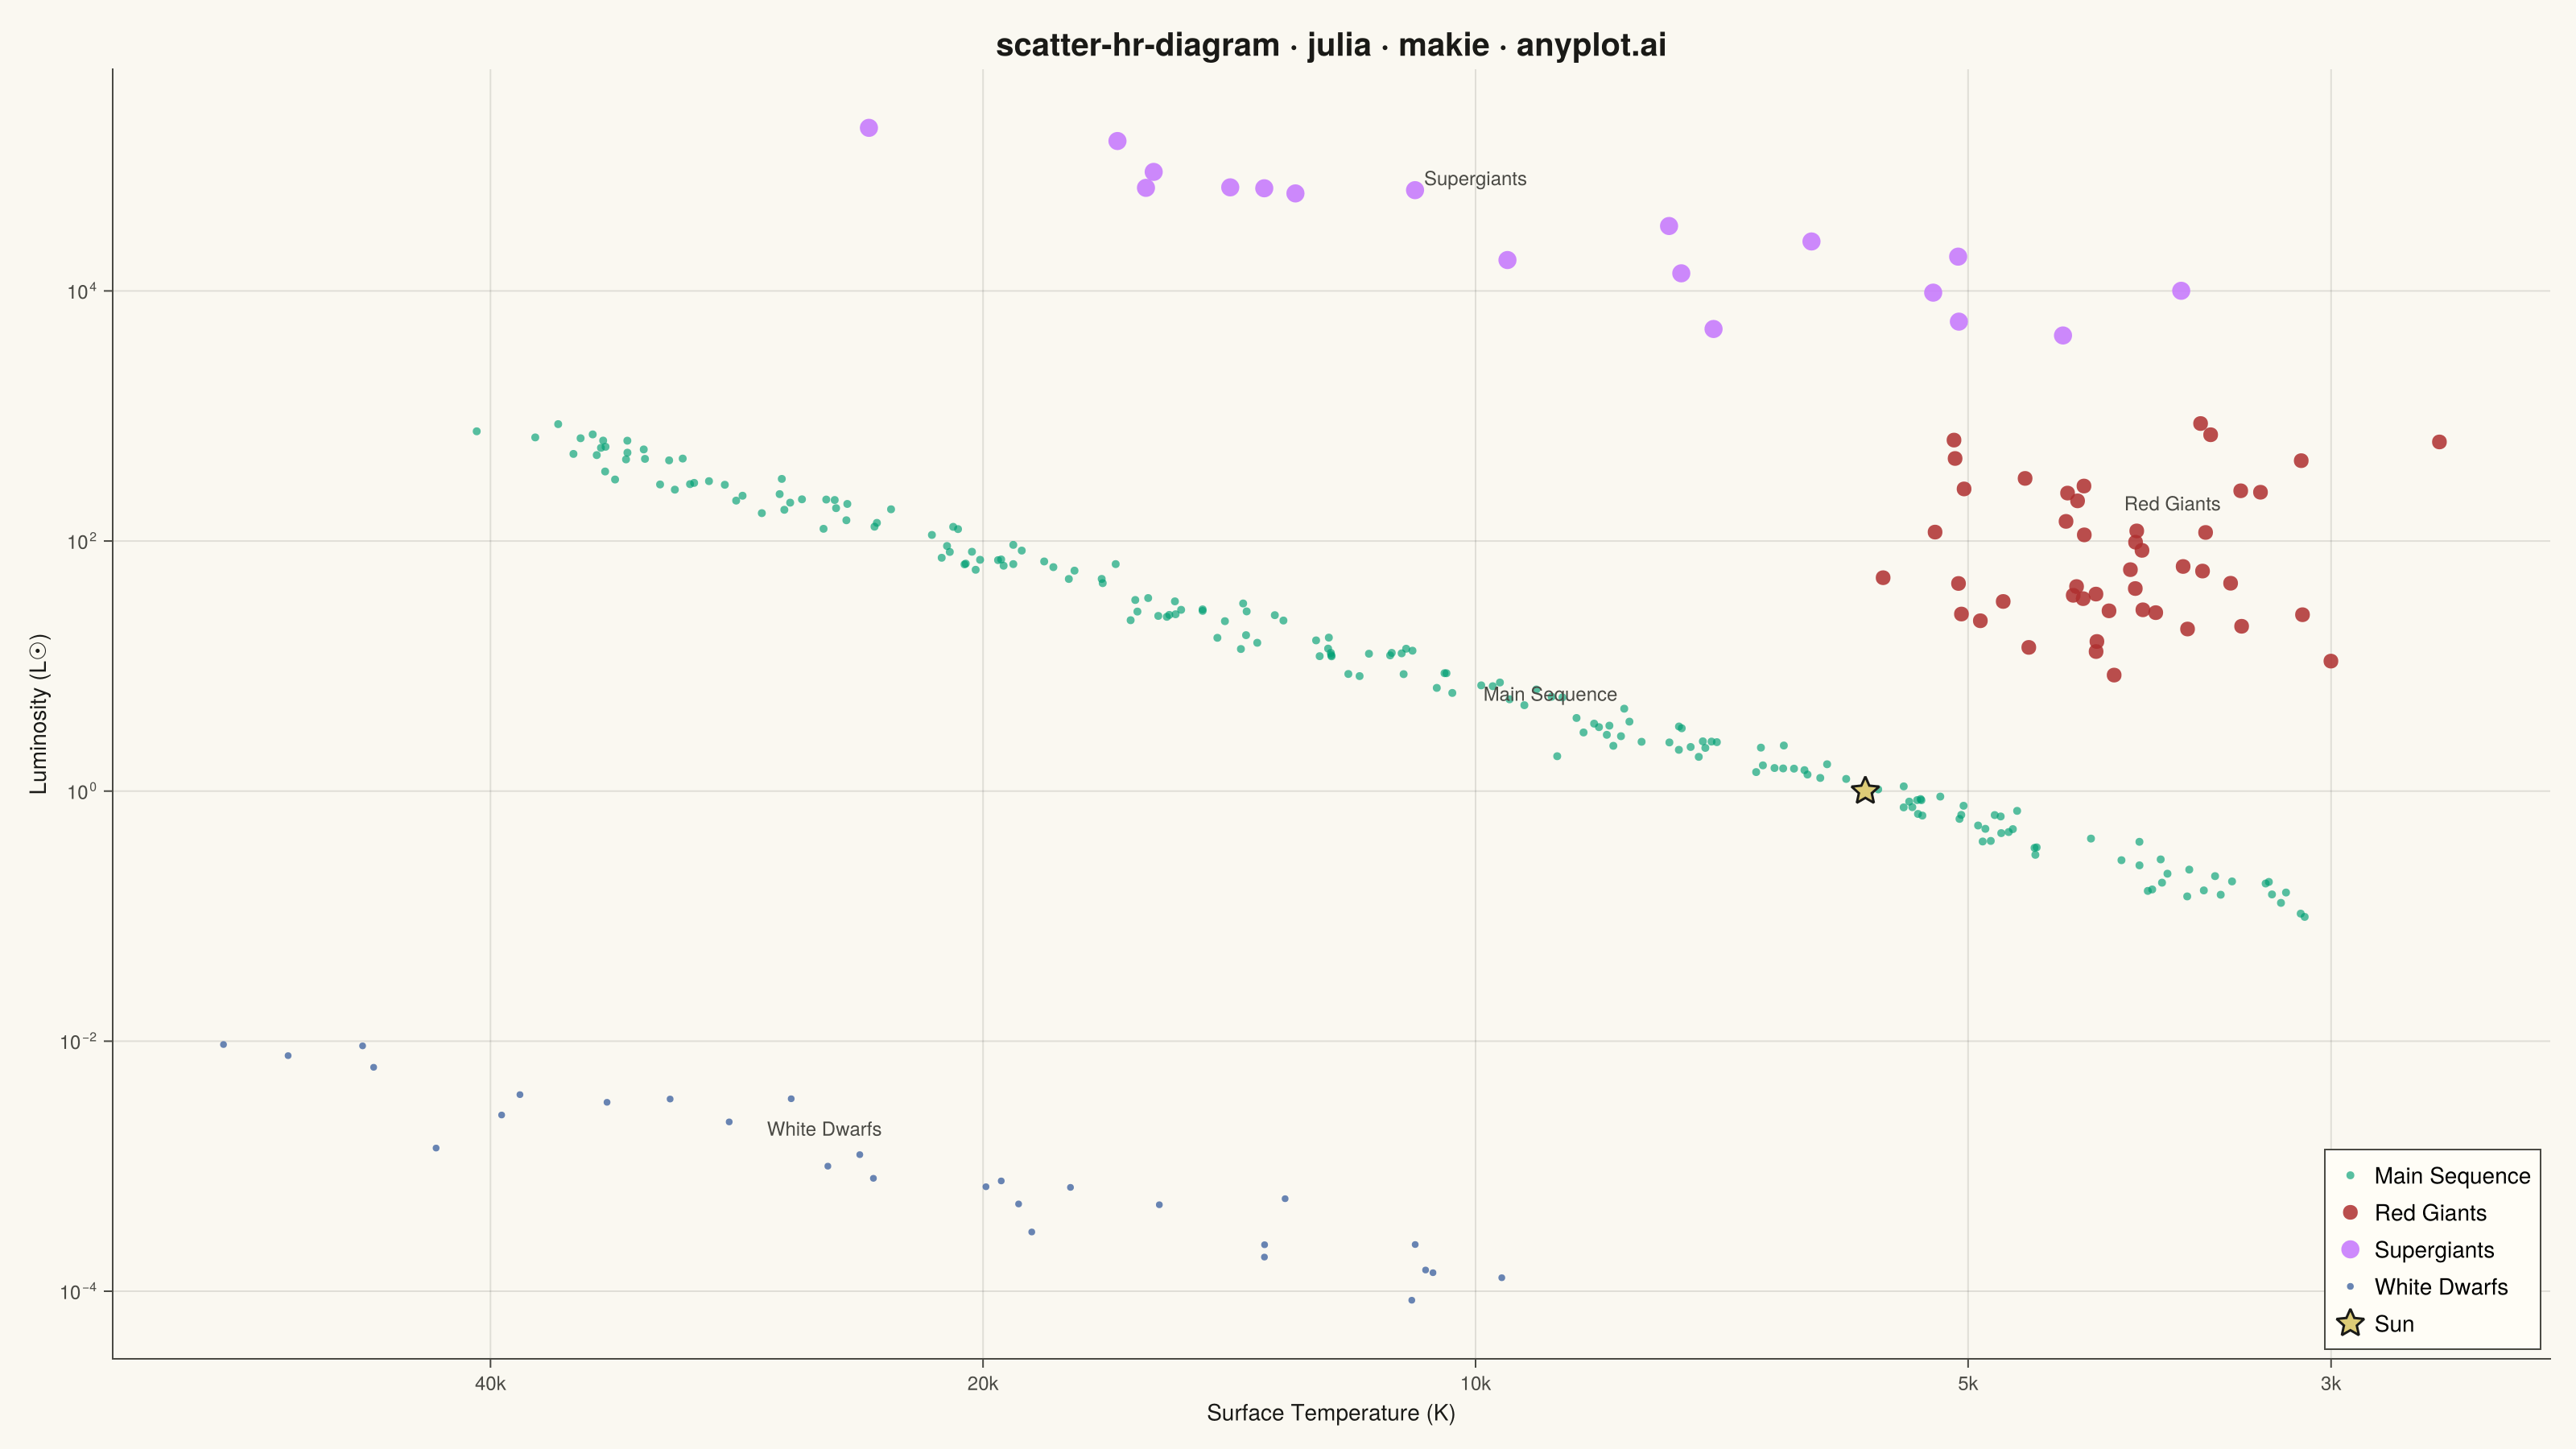
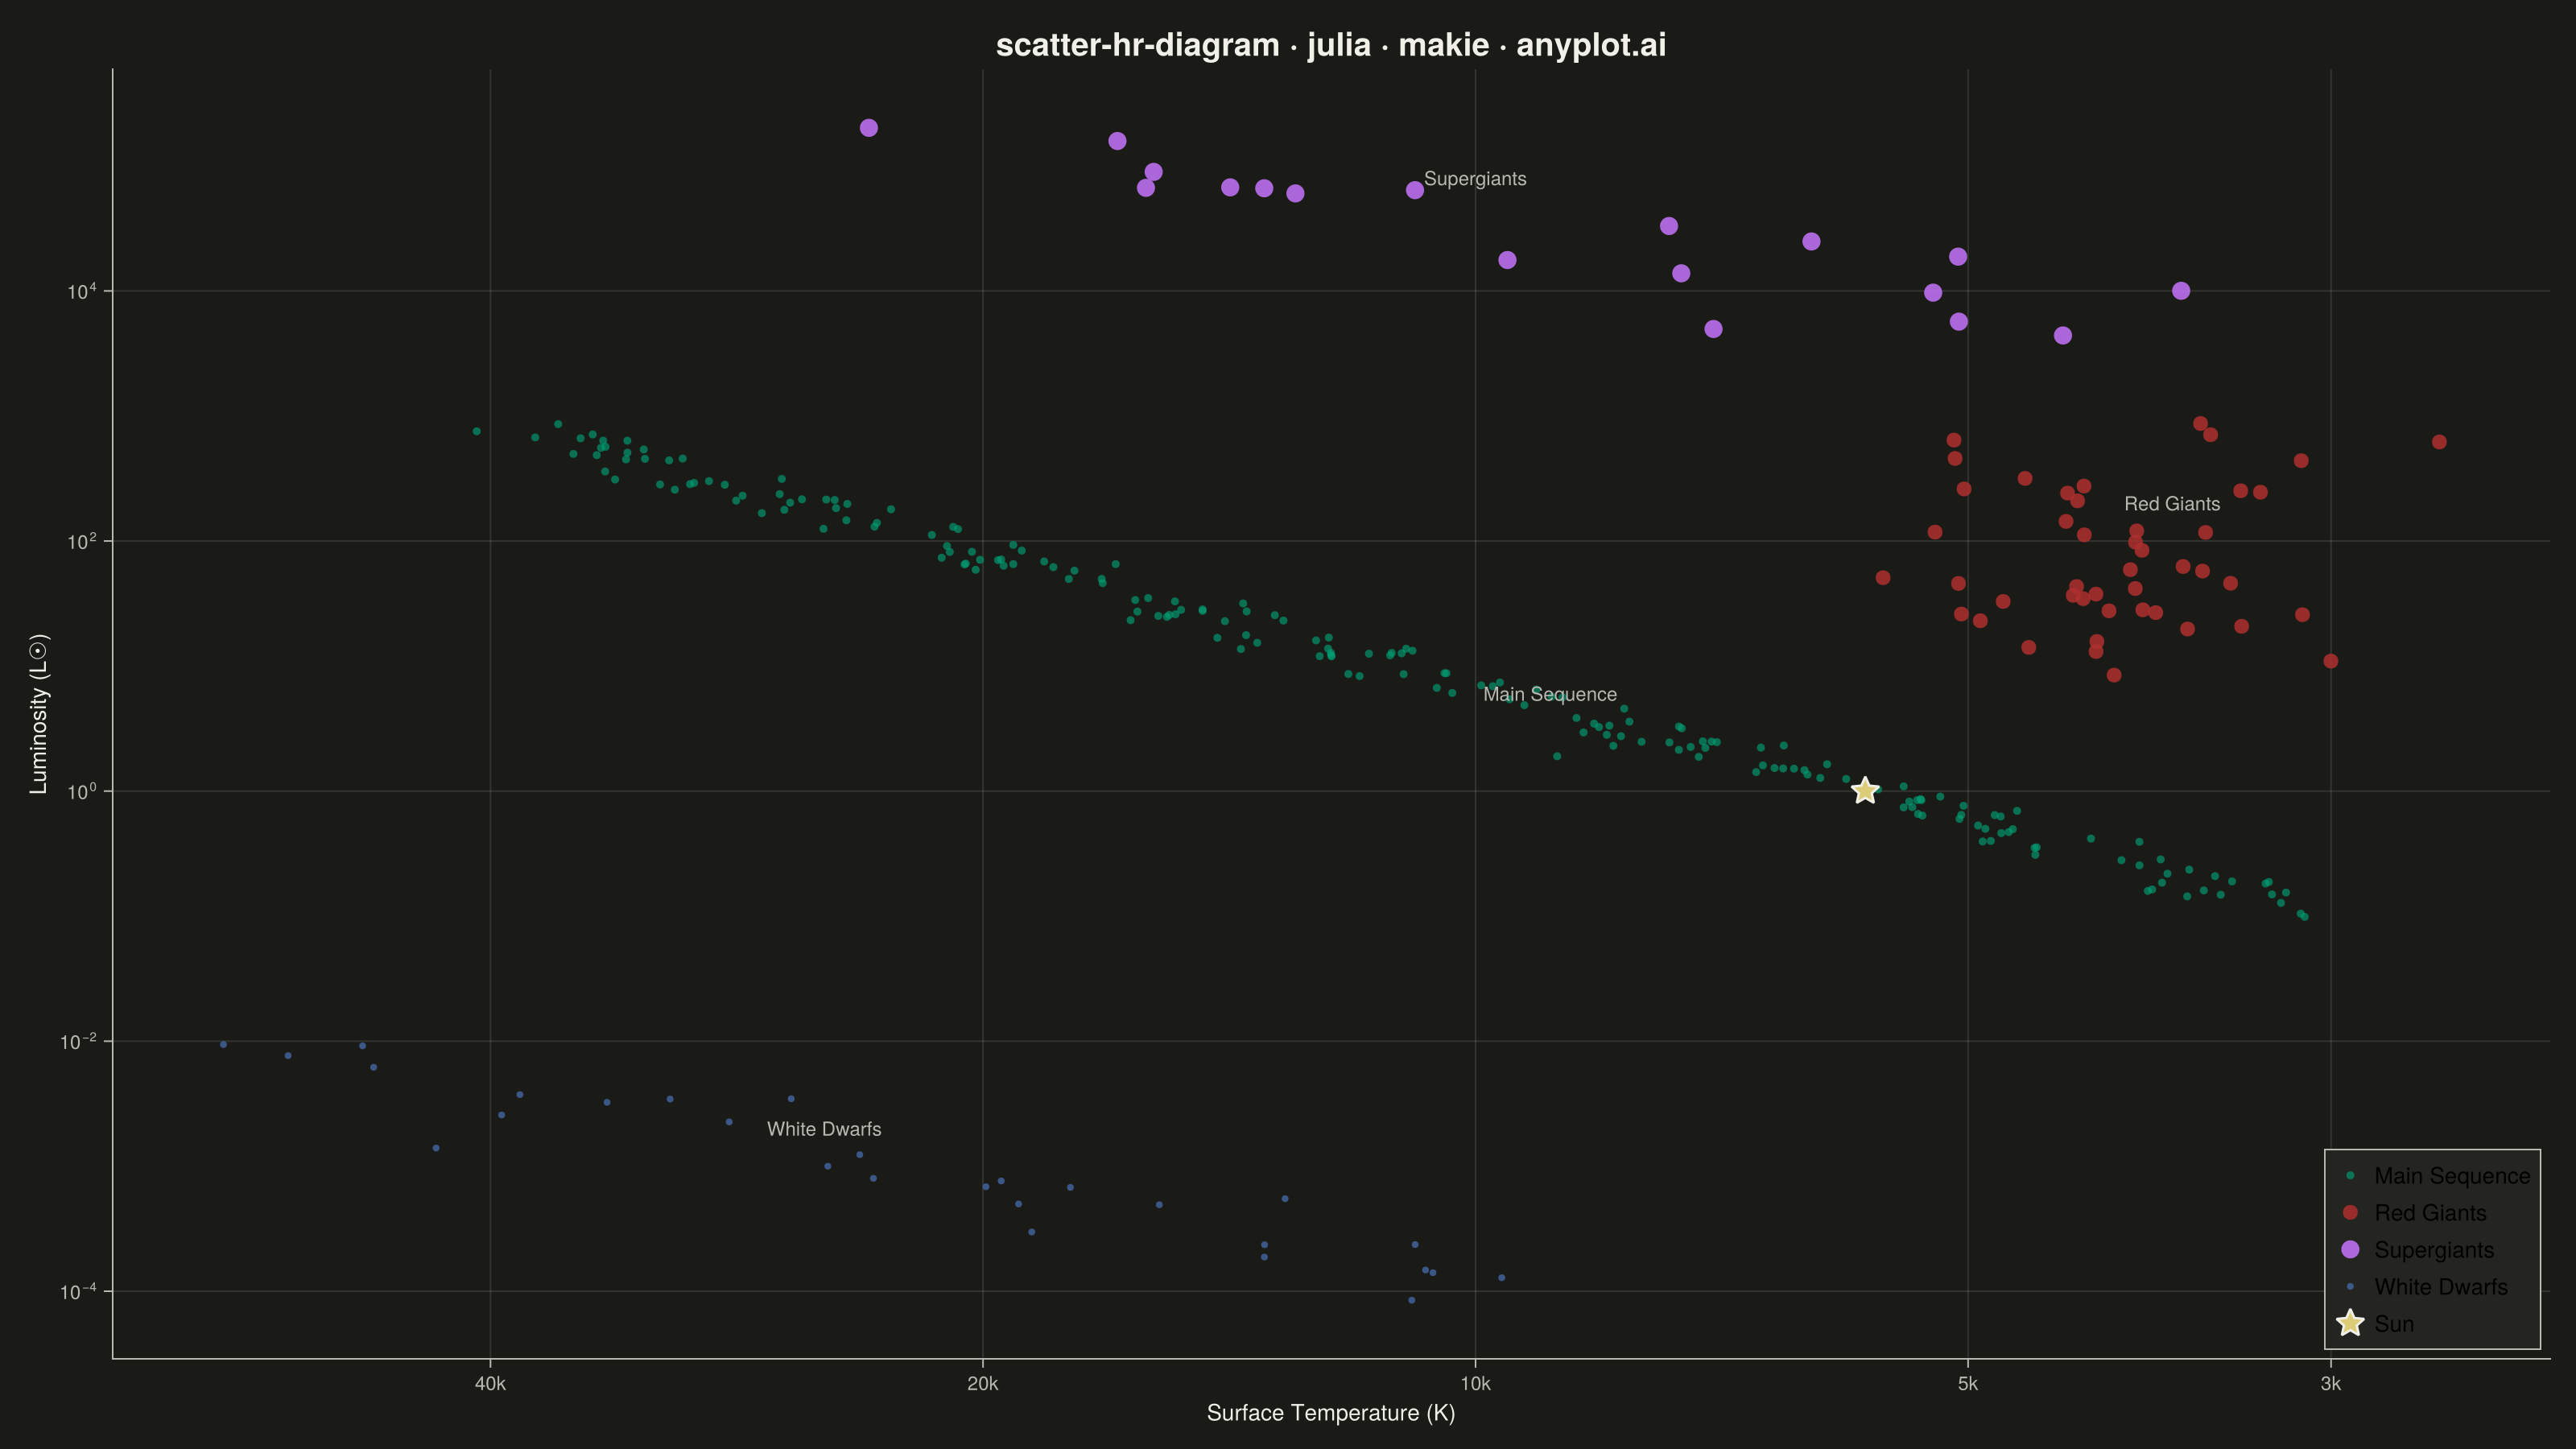
The Hertzsprung-Russell (HR) diagram is the iconic astrophysics scatter plot that shows stellar luminosity (or absolute magnitude) versus surface temperature (or spectral class). Stars naturally cluster along the main sequence diagonal, with distinct regions for red giants, supergiants, and white dwarfs, revealing the fundamental relationship between stellar temperature and brightness.
# anyplot.ai
# scatter-hr-diagram: Hertzsprung-Russell Diagram
# Library: makie 0.22.10 | Julia 1.11.9
# Quality: 84/100 | Created: 2026-06-02

using CairoMakie
using Colors
using Random

Random.seed!(42)

# Theme tokens
const THEME       = get(ENV, "ANYPLOT_THEME", "light")
const PAGE_BG     = THEME == "light" ? colorant"#FAF8F1" : colorant"#1A1A17"
const ELEVATED_BG = THEME == "light" ? colorant"#FFFDF6" : colorant"#242420"
const INK         = THEME == "light" ? colorant"#1A1A17" : colorant"#F0EFE8"
const INK_SOFT    = THEME == "light" ? colorant"#4A4A44" : colorant"#B8B7B0"

# Imprint palette — 8 hues, hybrid-v3 sort, theme-independent
const IMPRINT_PALETTE = [
    colorant"#009E73",  # 1 — brand green (first series)
    colorant"#C475FD",  # 2 — lavender
    colorant"#4467A3",  # 3 — blue
    colorant"#BD8233",  # 4 — ochre
    colorant"#AE3030",  # 5 — matte red
    colorant"#2ABCCD",  # 6 — cyan
    colorant"#954477",  # 7 — rose
    colorant"#99B314",  # 8 — lime
]

# Spectral type color assignments — G first so brand green (#009E73) leads the legend.
# Colors approximate the conventional O(blue)→M(red) spectral temperature sequence.
const SPECTRAL_ORDER = ["G", "K", "M", "F", "A", "B", "O"]
const SPECTRAL_COLORS = Dict{String, typeof(IMPRINT_PALETTE[1])}(
    "G" => IMPRINT_PALETTE[1],   # #009E73 brand green  (G-type solar, most recognisable)
    "K" => IMPRINT_PALETTE[4],   # #BD8233 ochre        (K-type orange)
    "M" => IMPRINT_PALETTE[5],   # #AE3030 matte red    (M-type conventional red)
    "F" => IMPRINT_PALETTE[8],   # #99B314 lime         (F-type yellow-white)
    "A" => IMPRINT_PALETTE[2],   # #C475FD lavender     (A-type white)
    "B" => IMPRINT_PALETTE[6],   # #2ABCCD cyan         (B-type blue-white)
    "O" => IMPRINT_PALETTE[3],   # #4467A3 blue         (O-type conventional deep blue)
)

# Assign spectral type by surface temperature (standard Harvard classification)
function spectral_type(T::Float64)
    T < 3700  && return "M"
    T < 5200  && return "K"
    T < 6000  && return "G"
    T < 7500  && return "F"
    T < 10000 && return "A"
    T < 30000 && return "B"
    return "O"
end

# Data — synthetic stellar populations for HR diagram
n_ms = 200
ms_temp = exp.(range(log(3200.0), log(38000.0), length=n_ms) .+ randn(n_ms) .* 0.06)
ms_lum  = (ms_temp ./ 5778.0) .^ 3.5 .* exp.(randn(n_ms) .* 0.22)

n_rg = 45
rg_temp = exp.(log(3900.0) .+ randn(n_rg) .* 0.16)
rg_lum  = exp.(range(log(10.0), log(600.0), length=n_rg) .+ randn(n_rg) .* 0.35)

n_sg = 18
sg_temp = exp.(range(log(3500.0), log(22000.0), length=n_sg) .+ randn(n_sg) .* 0.18)
sg_lum  = exp.(range(log(4000.0), log(180000.0), length=n_sg) .+ randn(n_sg) .* 0.30)

n_wd = 28
wd_temp = exp.(range(log(9000.0), log(55000.0), length=n_wd) .+ randn(n_wd) .* 0.12)
wd_lum  = exp.(range(log(0.0001), log(0.008), length=n_wd) .+ randn(n_wd) .* 0.30)

# Merge all populations; assign spectral types by temperature
all_temp  = vcat(ms_temp, rg_temp, sg_temp, wd_temp)
all_lum   = vcat(ms_lum,  rg_lum,  sg_lum,  wd_lum)
all_stype = spectral_type.(all_temp)

# Figure
fig = Figure(
    size            = (1600, 900),
    fontsize        = 14,
    backgroundcolor = PAGE_BG,
)

ax = Axis(
    fig[1, 1];
    title              = "scatter-hr-diagram · julia · makie · anyplot.ai",
    titlesize          = 20,
    titlecolor         = INK,
    xlabel             = "Surface Temperature (K)",
    ylabel             = "Luminosity (L☉)",
    xlabelsize         = 14,
    ylabelsize         = 14,
    xlabelcolor        = INK,
    ylabelcolor        = INK,
    xticklabelsize     = 12,
    yticklabelsize     = 12,
    xticklabelcolor    = INK_SOFT,
    yticklabelcolor    = INK_SOFT,
    xtickcolor         = INK_SOFT,
    ytickcolor         = INK_SOFT,
    backgroundcolor    = PAGE_BG,
    topspinevisible    = false,
    rightspinevisible  = false,
    leftspinecolor     = INK_SOFT,
    bottomspinecolor   = INK_SOFT,
    xgridvisible       = false,                  # y-only grid reduces clutter on scatter
    ygridcolor         = RGBAf(Float32(INK.r), Float32(INK.g), Float32(INK.b), 0.12f0),
    xscale             = log10,
    yscale             = log10,
    xreversed          = true,
    xticks             = ([3000, 5000, 10000, 20000, 40000],
                          ["3k", "5k", "10k", "20k", "40k"]),
)

# Faint main-sequence reference spine highlights the diagonal trend
ms_T_spine = collect(range(3000.0, 40000.0, length=120))
ms_L_spine = (ms_T_spine ./ 5778.0) .^ 3.5
lines!(ax, ms_T_spine, ms_L_spine;
    color = (INK_SOFT, 0.30), linewidth = 1.5, linestyle = :dash)

# Scatter by spectral type — G first so brand green leads as first series
for stype in SPECTRAL_ORDER
    idx = findall(==(stype), all_stype)
    isempty(idx) && continue
    scatter!(ax, all_temp[idx], all_lum[idx];
        color       = (SPECTRAL_COLORS[stype], 0.70),
        markersize  = 8,
        strokewidth = 0,
        label       = stype * "-type")
end

# Sun reference — G2V, gold star5 marker
scatter!(ax, [5778.0], [1.0];
    color       = colorant"#DDCC77",
    markersize  = 20,
    marker      = :star5,
    strokewidth = 1.5,
    strokecolor = INK,
    label       = "Sun (G2V)")

# Region labels — placed in whitespace away from dense populations
text!(ax, 7000.0, 25.0;
    text = "Main Sequence", fontsize = 12, color = INK_SOFT, align = (:center, :center))
text!(ax, 3750.0, 200.0;
    text = "Red Giants",    fontsize = 12, color = INK_SOFT, align = (:center, :center))
text!(ax, 10000.0, 80000.0;
    text = "Supergiants",   fontsize = 12, color = INK_SOFT, align = (:center, :center))
text!(ax, 25000.0, 0.002;
    text = "White Dwarfs",  fontsize = 12, color = INK_SOFT, align = (:center, :center))

# Legend
axislegend(ax;
    position        = :rb,
    backgroundcolor = ELEVATED_BG,
    framecolor      = INK_SOFT,
    fontsize        = 10,
)

# Save
save("plot-$(THEME).png", fig; px_per_unit = 2)
Runnable source as JSON, for any HTTP client: https://api.anyplot.ai/specs/scatter-hr-diagram/makie/code. Any spec id and library id listed in llms-full.txt fit the same URL shape; every URL below is complete and callable.
{
  "spec_id": "scatter-hr-diagram",
  "language": "julia",
  "library": "makie",
  "page": "https://anyplot.ai/scatter-hr-diagram/julia/makie",
  "hub": "https://anyplot.ai/scatter-hr-diagram",
  "code_json": "https://api.anyplot.ai/specs/scatter-hr-diagram/makie/code",
  "spec_json": "https://api.anyplot.ai/specs/scatter-hr-diagram",
  "render_light_png": "https://storage.googleapis.com/anyplot-images/plots/scatter-hr-diagram/julia/makie/plot-light.png",
  "render_dark_png": "https://storage.googleapis.com/anyplot-images/plots/scatter-hr-diagram/julia/makie/plot-dark.png",
  "quality_score": 84.0,
  "license": "MIT",
  "guide": "https://anyplot.ai/llms.txt"
}
Part of Hertzsprung-Russell Diagram on anyplot.ai.