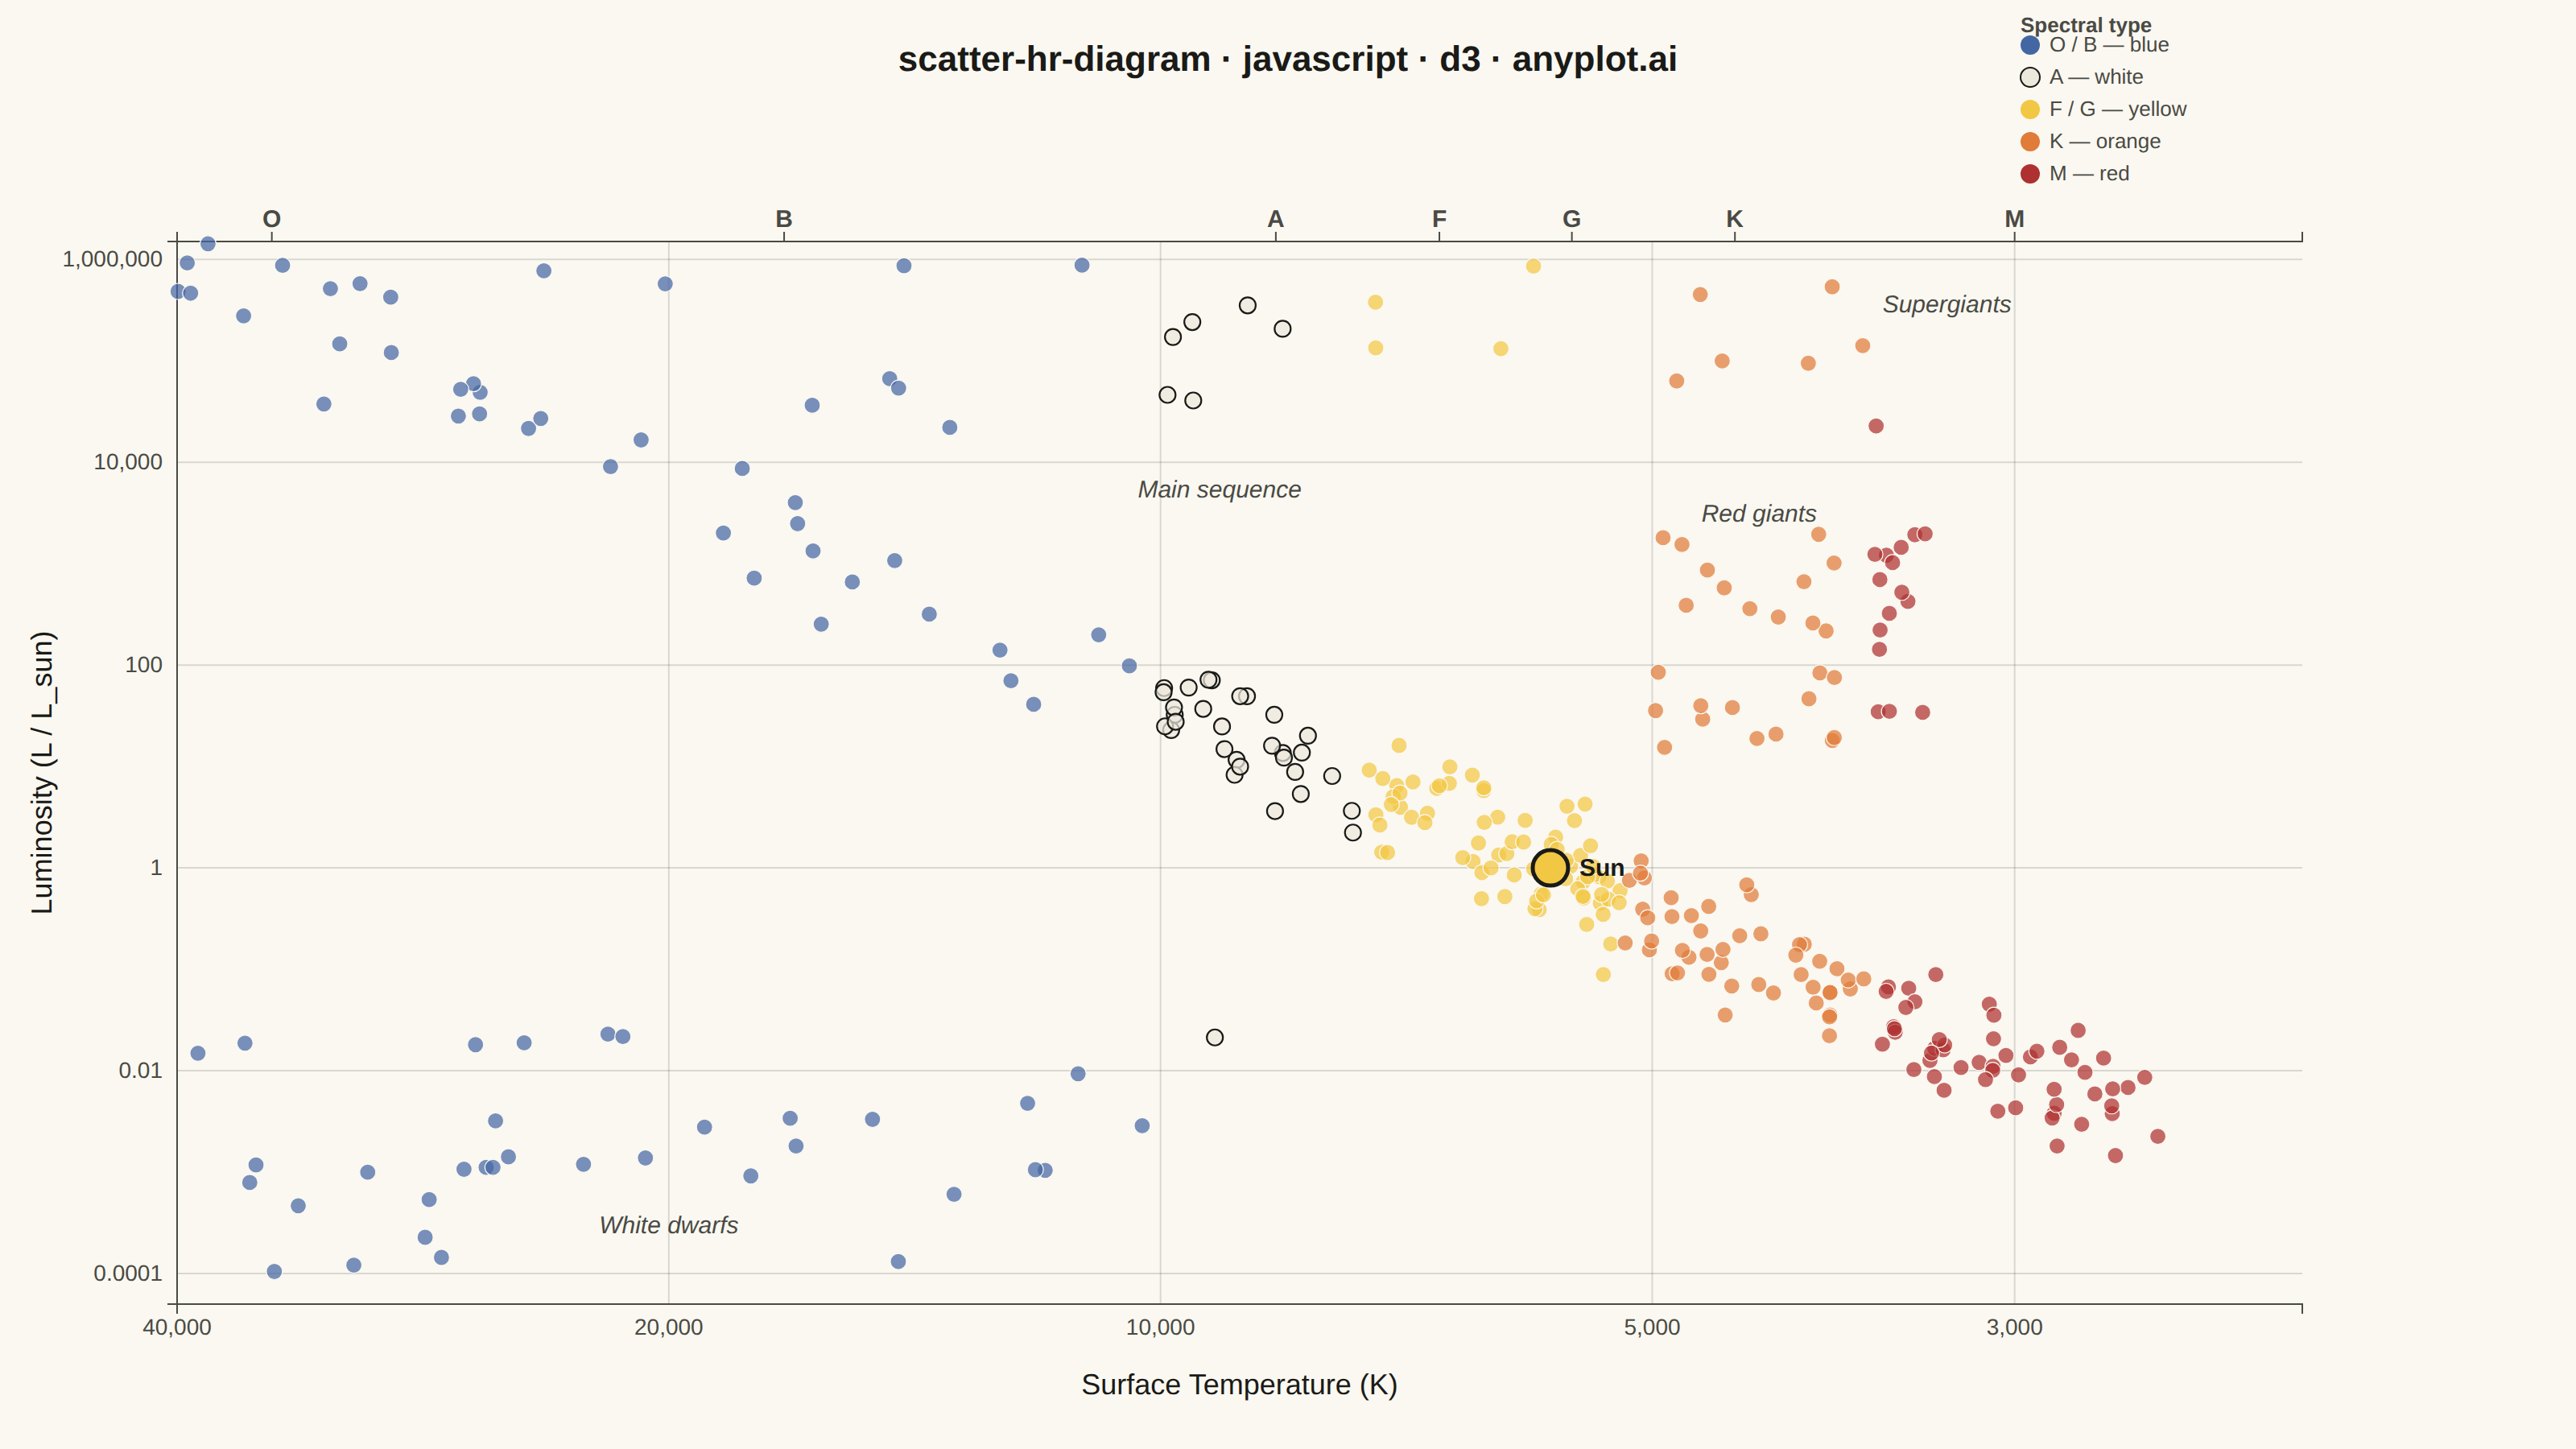
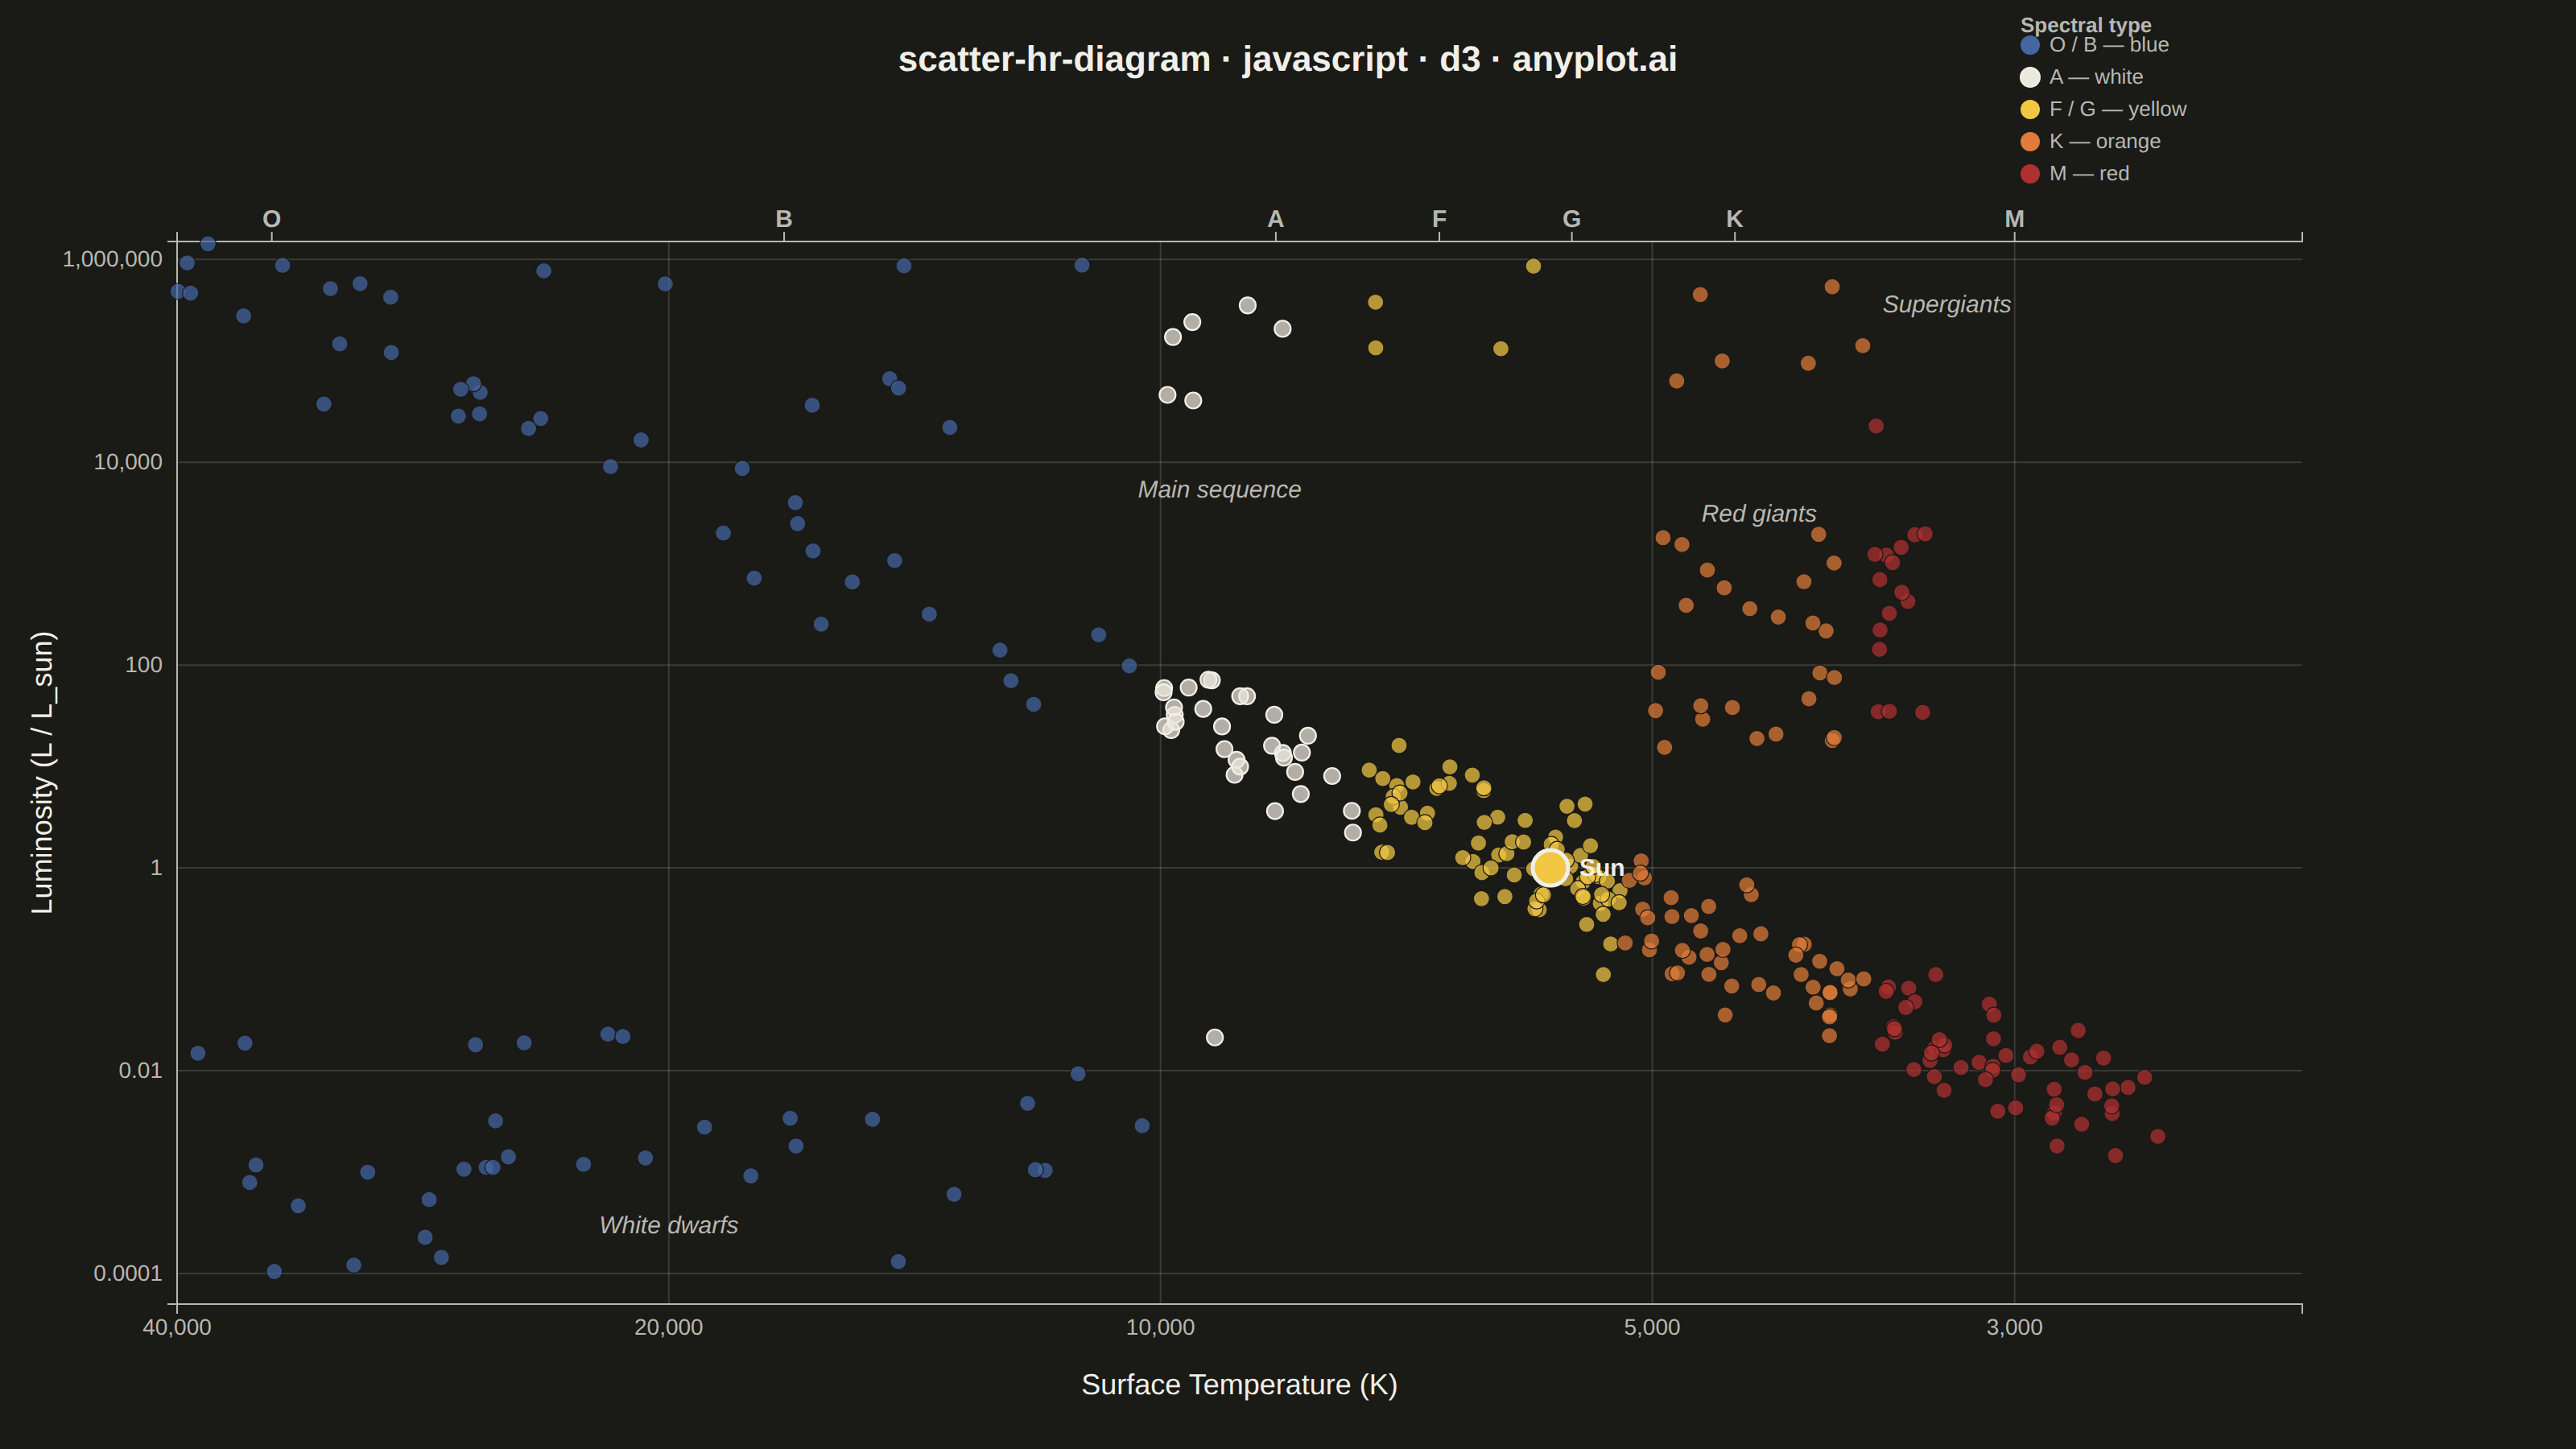
The same plot in 14 other libraries — JavaScript: Chart.js, Apache ECharts, Highcharts, MUI X Charts; Python: Altair, Bokeh, lets-plot, Matplotlib, Plotly, plotnine, Pygal, Seaborn; R: ggplot2; Julia: Makie.jl. Compare all 15 side by side: Hertzsprung-Russell Diagram in Python, R, Julia and JavaScript.
The Hertzsprung-Russell (HR) diagram is the iconic astrophysics scatter plot that shows stellar luminosity (or absolute magnitude) versus surface temperature (or spectral class). Stars naturally cluster along the main sequence diagonal, with distinct regions for red giants, supergiants, and white dwarfs, revealing the fundamental relationship between stellar temperature and brightness.
// anyplot.ai
// scatter-hr-diagram: Hertzsprung-Russell Diagram
// Library: d3 7.9.0 | JavaScript 22.23.2
// Quality: 90/100 | Created: 2026-08-26

//# anyplot-orientation: landscape
const t = window.ANYPLOT_TOKENS;
const { width, height } = window.ANYPLOT_SIZE;
const margin = { top: 150, right: 170, bottom: 90, left: 110 };
const iw = width - margin.left - margin.right;
const ih = height - margin.top - margin.bottom;

// --- Deterministic PRNG (fixed-seed LCG + Box-Muller) -----------------------
let seed = 42;
const rand = () => {
  seed = (seed * 1664525 + 1013904223) % 4294967296;
  return seed / 4294967296;
};
const gauss = () => Math.sqrt(-2 * Math.log(rand())) * Math.cos(2 * Math.PI * rand());
const uniform = (lo, hi) => lo + rand() * (hi - lo);
const logUniform = (lo, hi) => Math.exp(uniform(Math.log(lo), Math.log(hi)));

// --- Data: synthetic stellar population, one PRNG draw per star ------------
// Main sequence: logL scales with logT around the Sun (T=5772K, L=1 Lsun).
const logTSun = Math.log10(5772);
const spectralRanges = [
  { type: "O", lo: 30000, hi: 40000, count: 10 },
  { type: "B", lo: 10000, hi: 30000, count: 26 },
  { type: "A", lo: 7500, hi: 10000, count: 30 },
  { type: "F", lo: 6000, hi: 7500, count: 36 },
  { type: "G", lo: 5200, hi: 6000, count: 40 },
  { type: "K", lo: 3700, hi: 5200, count: 46 },
  { type: "M", lo: 2400, hi: 3700, count: 52 },
];

// Spectral type is always derived from actual temperature (never hardcoded per
// region) so the conventional per-type color always matches the star's real temperature.
function spectralTypeFromTemp(temp) {
  if (temp >= 30000) return "O";
  if (temp >= 10000) return "B";
  if (temp >= 7500) return "A";
  if (temp >= 6000) return "F";
  if (temp >= 5200) return "G";
  if (temp >= 3700) return "K";
  return "M";
}

const stars = [];
for (const range of spectralRanges) {
  for (let i = 0; i < range.count; i++) {
    const temperature = uniform(range.lo, range.hi);
    const logL = 7 * (Math.log10(temperature) - logTSun) + gauss() * 0.35;
    stars.push({
      temperature,
      luminosity: 10 ** logL,
      spectralType: range.type,
      region: "main sequence",
    });
  }
}
for (let i = 0; i < 40; i++) {
  const temperature = uniform(3400, 5000);
  stars.push({
    temperature,
    luminosity: 10 ** uniform(1, 3.3),
    spectralType: spectralTypeFromTemp(temperature),
    region: "red giants",
  });
}
for (let i = 0; i < 25; i++) {
  const temperature = logUniform(3000, 25000);
  stars.push({
    temperature,
    luminosity: 10 ** uniform(4.3, 6),
    spectralType: spectralTypeFromTemp(temperature),
    region: "supergiants",
  });
}
for (let i = 0; i < 35; i++) {
  const temperature = uniform(8000, 40000);
  stars.push({
    temperature,
    luminosity: 10 ** uniform(-4, -1.5),
    spectralType: spectralTypeFromTemp(temperature),
    region: "white dwarfs",
  });
}
const sun = { temperature: 5772, luminosity: 1, spectralType: "G", region: "main sequence", name: "Sun" };

// --- Scales -------------------------------------------------------------
// X reversed: hot/blue stars on the left, following astrophysical convention.
const x = d3.scaleLog().domain([40000, 2000]).range([0, iw]).clamp(true);
const y = d3.scaleLog().domain([0.00005, 1500000]).range([ih, 0]).clamp(true);
// Semantic exception (per style guide "domain conventions"): spectral type has a
// widely-recognized discrete color convention, so this uses an ordinal scale with
// those conventional hues rather than a continuous Imprint colormap.
const spectralColor = d3
  .scaleOrdinal()
  .domain(["O", "B", "A", "F", "G", "K", "M"])
  .range(["#4467A3", "#4467A3", "#EDE8DC", "#F2C744", "#F2C744", "#E07B39", "#AE3030"]);

// --- SVG mount ------------------------------------------------------------
const svg = d3.select("#container").append("svg").attr("width", width).attr("height", height);
const g = svg.append("g").attr("transform", `translate(${margin.left},${margin.top})`);

// --- Gridlines (both axes, per scatter convention) -------------------------
g.append("g")
  .attr("transform", `translate(0,${ih})`)
  .call(d3.axisBottom(x).tickValues([3000, 5000, 10000, 20000, 40000]).tickSize(-ih).tickFormat(""))
  .selectAll("line")
  .attr("stroke", t.grid);
g.append("g")
  .call(d3.axisLeft(y).ticks(6).tickSize(-iw).tickFormat(""))
  .selectAll("line")
  .attr("stroke", t.grid);
g.selectAll(".domain").remove();

// --- Axes -------------------------------------------------------------------
const xAxis = g
  .append("g")
  .attr("transform", `translate(0,${ih})`)
  .call(d3.axisBottom(x).tickValues([3000, 5000, 10000, 20000, 40000]).tickFormat(d3.format(",")));
xAxis.selectAll("text").attr("fill", t.inkSoft).style("font-size", "14px");
xAxis.selectAll("line").remove();
xAxis.select(".domain").attr("stroke", t.inkSoft);

const yAxis = g.append("g").call(d3.axisLeft(y).ticks(6, ",").tickFormat(d3.format(",")));
yAxis.selectAll("text").attr("fill", t.inkSoft).style("font-size", "14px");
yAxis.selectAll("line").remove();
yAxis.select(".domain").attr("stroke", t.inkSoft);

// Secondary top axis: representative spectral class per temperature band.
const spectralTicks = [
  { type: "O", temp: 35000 },
  { type: "B", temp: 17000 },
  { type: "A", temp: 8500 },
  { type: "F", temp: 6750 },
  { type: "G", temp: 5600 },
  { type: "K", temp: 4450 },
  { type: "M", temp: 3000 },
];
const topAxis = g
  .append("g")
  .call(
    d3
      .axisTop(x)
      .tickValues(spectralTicks.map((d) => d.temp))
      .tickFormat((d, i) => spectralTicks[i].type)
      .tickSize(6)
  );
topAxis.selectAll("text").attr("fill", t.inkSoft).style("font-size", "15px").style("font-weight", "600");
topAxis.selectAll("line").attr("stroke", t.inkSoft);
topAxis.select(".domain").attr("stroke", t.inkSoft);

// --- Axis labels --------------------------------------------------------
g.append("text")
  .attr("x", iw / 2)
  .attr("y", ih + 56)
  .attr("text-anchor", "middle")
  .attr("fill", t.ink)
  .style("font-size", "18px")
  .text("Surface Temperature (K)");
g.append("text")
  .attr("transform", "rotate(-90)")
  .attr("x", -ih / 2)
  .attr("y", -78)
  .attr("text-anchor", "middle")
  .attr("fill", t.ink)
  .style("font-size", "18px")
  .text("Luminosity (L / L_sun)");

// --- Region labels (spec explicitly requires labeling the four regions) ----
const regionLabels = [
  { label: "Main sequence", temp: 9200, lum: 4500 },
  { label: "Red giants", temp: 4300, lum: 2600 },
  { label: "Supergiants", temp: 3300, lum: 300000 },
  { label: "White dwarfs", temp: 20000, lum: 0.00025 },
];
g.selectAll(".region-label")
  .data(regionLabels)
  .join("text")
  .attr("class", "region-label")
  .attr("x", (d) => x(d.temp))
  .attr("y", (d) => y(d.lum))
  .attr("text-anchor", "middle")
  .attr("fill", t.inkSoft)
  .style("font-size", "15px")
  .style("font-style", "italic")
  .text((d) => d.label);

// --- Stars ------------------------------------------------------------------
g.selectAll(".star")
  .data(stars)
  .join("circle")
  .attr("class", "star")
  .attr("cx", (d) => x(d.temperature))
  .attr("cy", (d) => y(d.luminosity))
  .attr("r", 5)
  .attr("fill", (d) => spectralColor(d.spectralType))
  .attr("fill-opacity", 0.72)
  .attr("stroke", (d) => (d.spectralType === "A" ? t.ink : t.pageBg))
  .attr("stroke-width", (d) => (d.spectralType === "A" ? 1.1 : 0.6));

// --- Sun marker (distinct reference point) ----------------------------------
g.append("circle")
  .attr("cx", x(sun.temperature))
  .attr("cy", y(sun.luminosity))
  .attr("r", 11)
  .attr("fill", spectralColor(sun.spectralType))
  .attr("stroke", t.ink)
  .attr("stroke-width", 2.5);
g.append("text")
  .attr("x", x(sun.temperature) + 18)
  .attr("y", y(sun.luminosity) + 5)
  .attr("fill", t.ink)
  .style("font-size", "15px")
  .style("font-weight", "600")
  .text("Sun");

// --- Spectral-type color legend (explains the conventional hue mapping) -----
const legendItems = [
  { type: "O", label: "O / B — blue" },
  { type: "A", label: "A — white" },
  { type: "F", label: "F / G — yellow" },
  { type: "K", label: "K — orange" },
  { type: "M", label: "M — red" },
];
const legendX = iw - 175;
const legendY = -118;
g.append("text")
  .attr("x", legendX)
  .attr("y", legendY - 12)
  .attr("fill", t.inkSoft)
  .style("font-size", "13px")
  .style("font-weight", "600")
  .text("Spectral type");
const legendRows = g
  .selectAll(".legend-item")
  .data(legendItems)
  .join("g")
  .attr("class", "legend-item")
  .attr("transform", (d, i) => `translate(${legendX},${legendY + i * 20})`);
legendRows
  .append("circle")
  .attr("r", 6)
  .attr("cx", 6)
  .attr("cy", -4)
  .attr("fill", (d) => spectralColor(d.type))
  .attr("stroke", (d) => (d.type === "A" ? t.ink : "none"))
  .attr("stroke-width", 1);
legendRows
  .append("text")
  .attr("x", 18)
  .attr("y", 0)
  .attr("fill", t.inkSoft)
  .style("font-size", "13px")
  .text((d) => d.label);

// --- Title ------------------------------------------------------------------
svg
  .append("text")
  .attr("x", width / 2)
  .attr("y", 44)
  .attr("text-anchor", "middle")
  .attr("fill", t.ink)
  .style("font-size", "22px")
  .style("font-weight", "600")
  .text("scatter-hr-diagram · javascript · d3 · anyplot.ai");
Runnable source as JSON, for any HTTP client: https://api.anyplot.ai/specs/scatter-hr-diagram/d3/code. Any spec id and library id listed in llms-full.txt fit the same URL shape; every URL below is complete and callable.
{
  "spec_id": "scatter-hr-diagram",
  "language": "javascript",
  "library": "d3",
  "page": "https://anyplot.ai/scatter-hr-diagram/javascript/d3",
  "hub": "https://anyplot.ai/scatter-hr-diagram",
  "code_json": "https://api.anyplot.ai/specs/scatter-hr-diagram/d3/code",
  "spec_json": "https://api.anyplot.ai/specs/scatter-hr-diagram",
  "render_light_png": "https://storage.googleapis.com/anyplot-images/plots/scatter-hr-diagram/javascript/d3/plot-light.png",
  "render_dark_png": "https://storage.googleapis.com/anyplot-images/plots/scatter-hr-diagram/javascript/d3/plot-dark.png",
  "interactive_light_html": "https://storage.googleapis.com/anyplot-images/plots/scatter-hr-diagram/javascript/d3/plot-light.html",
  "interactive_dark_html": "https://storage.googleapis.com/anyplot-images/plots/scatter-hr-diagram/javascript/d3/plot-dark.html",
  "quality_score": 90.0,
  "license": "MIT",
  "guide": "https://anyplot.ai/llms.txt"
}
Part of Hertzsprung-Russell Diagram on anyplot.ai.