The same plot in 14 other libraries — JavaScript: D3.js, Apache ECharts, Highcharts, MUI X Charts; Python: Altair, Bokeh, lets-plot, Matplotlib, Plotly, plotnine, Pygal, Seaborn; R: ggplot2; Julia: Makie.jl. Compare all 15 side by side: Hertzsprung-Russell Diagram in Python, R, Julia and JavaScript.
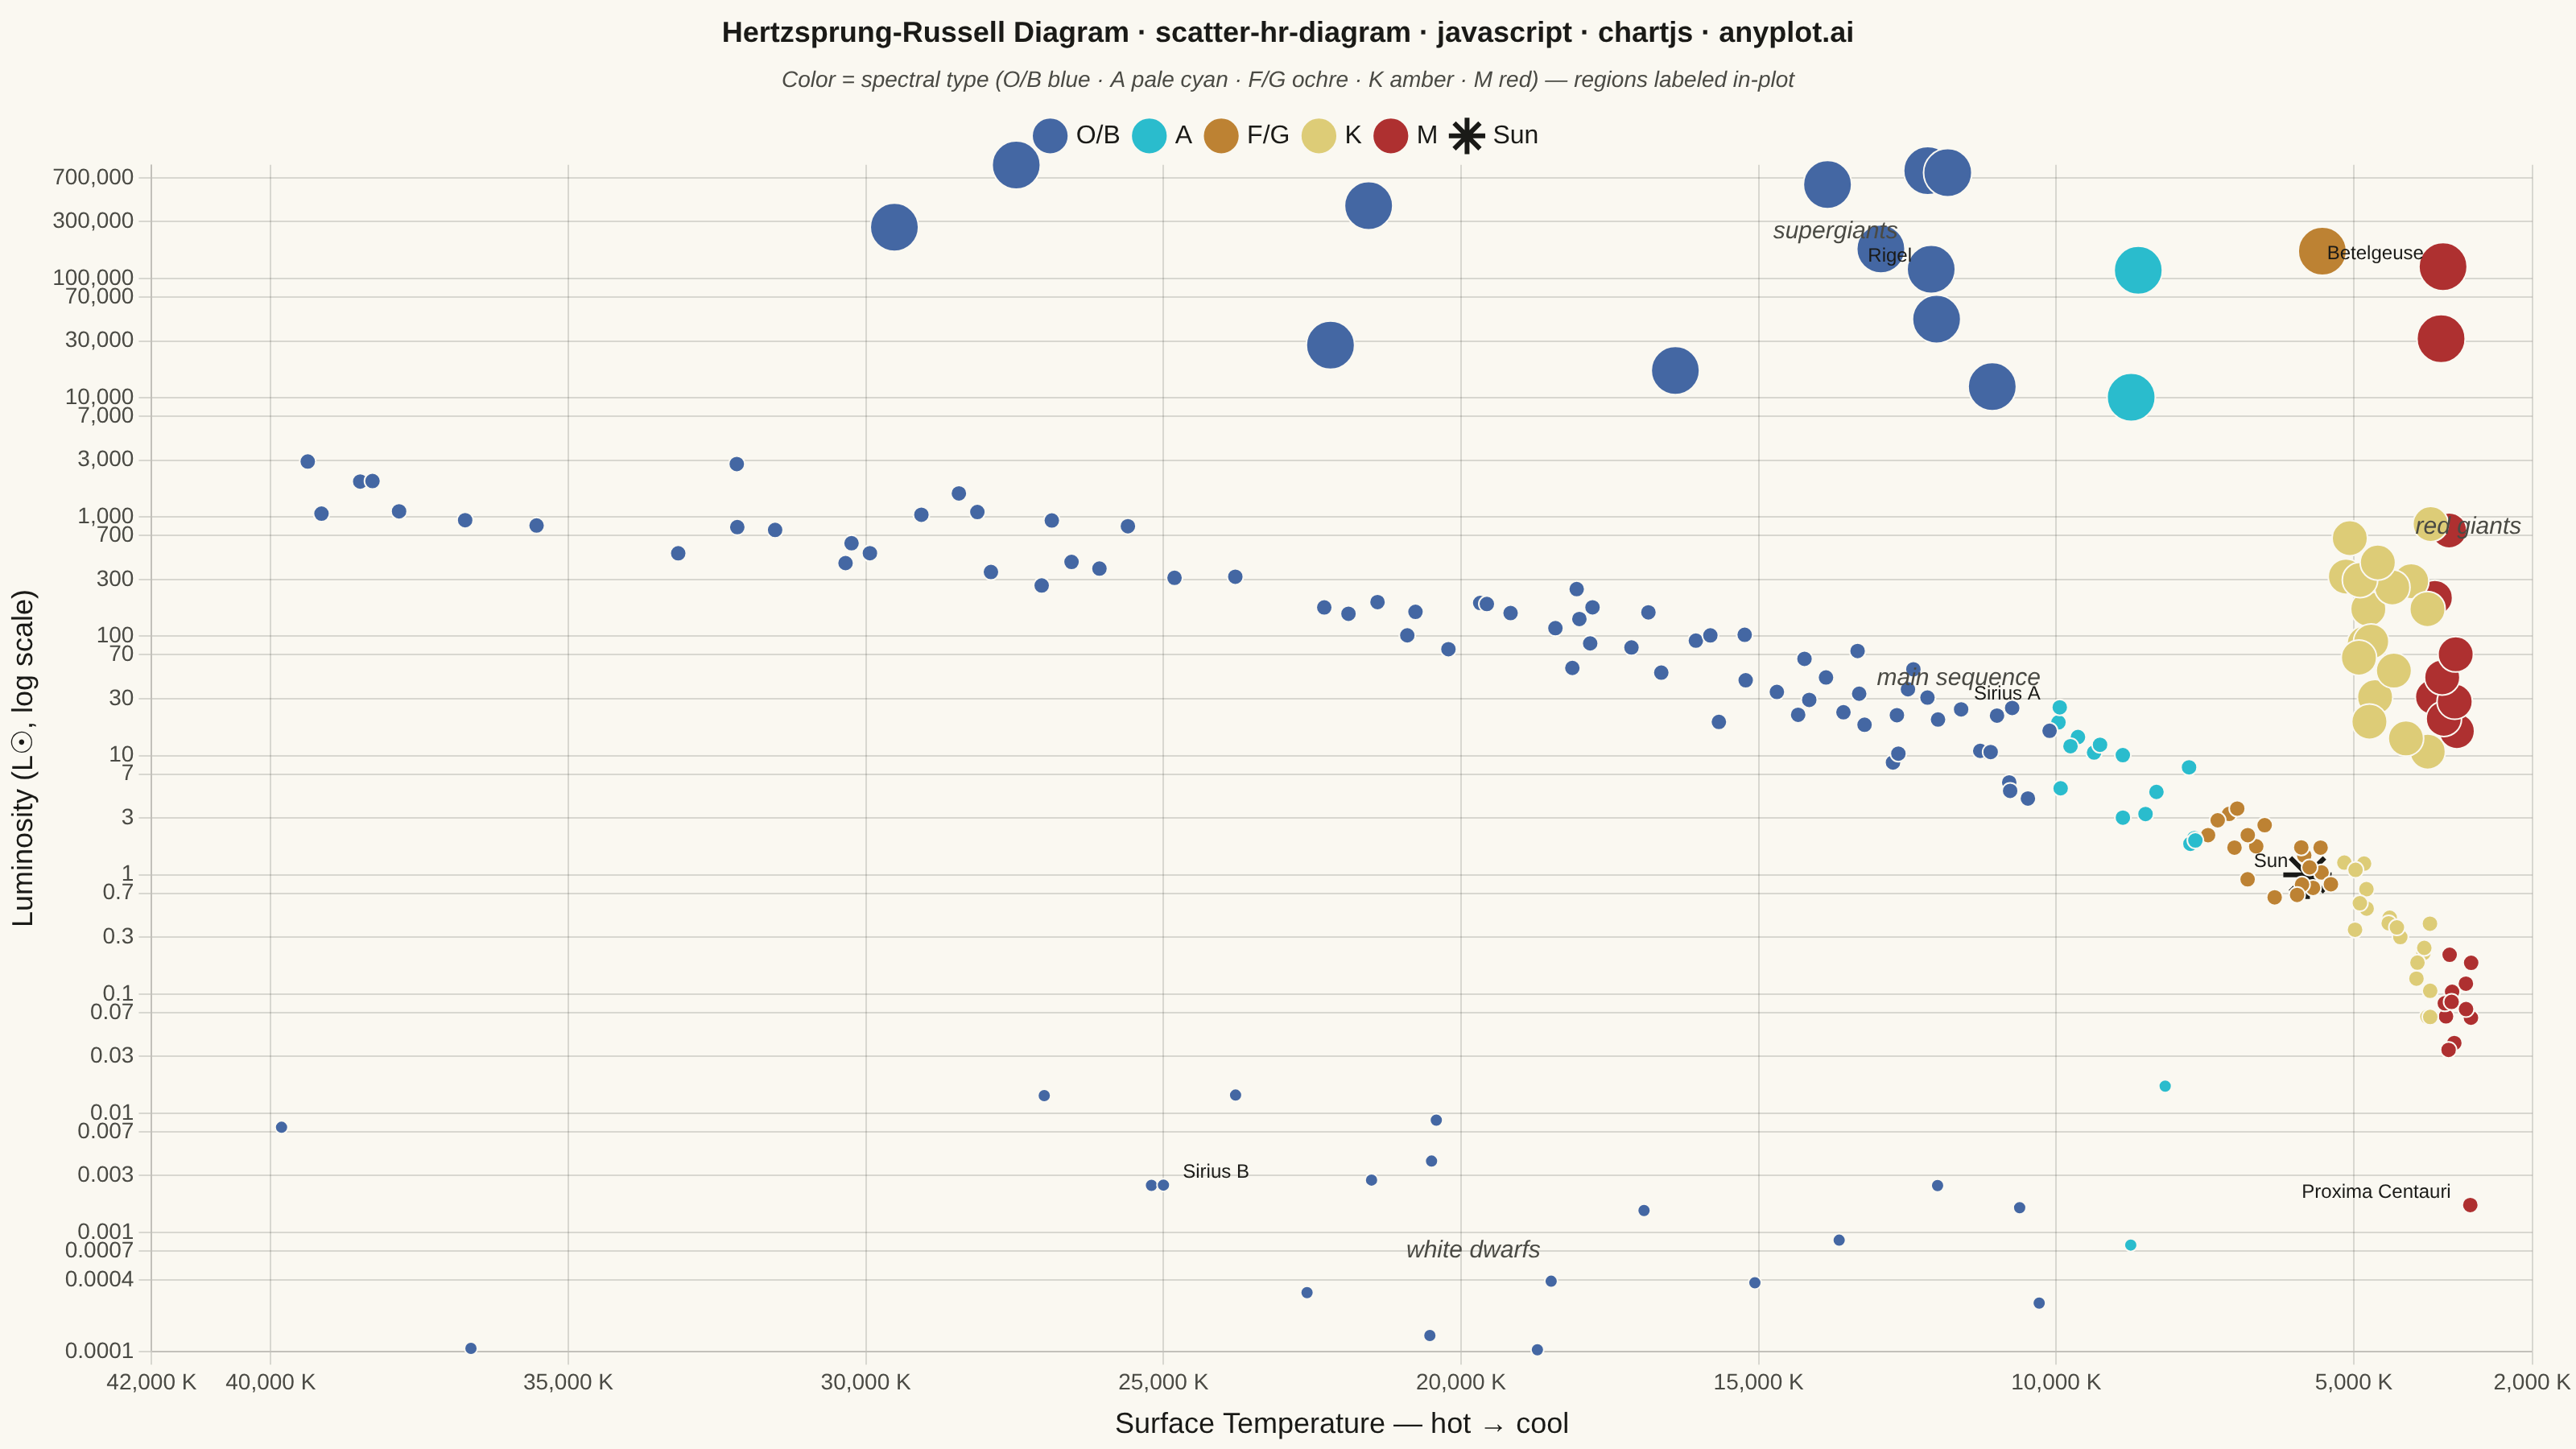
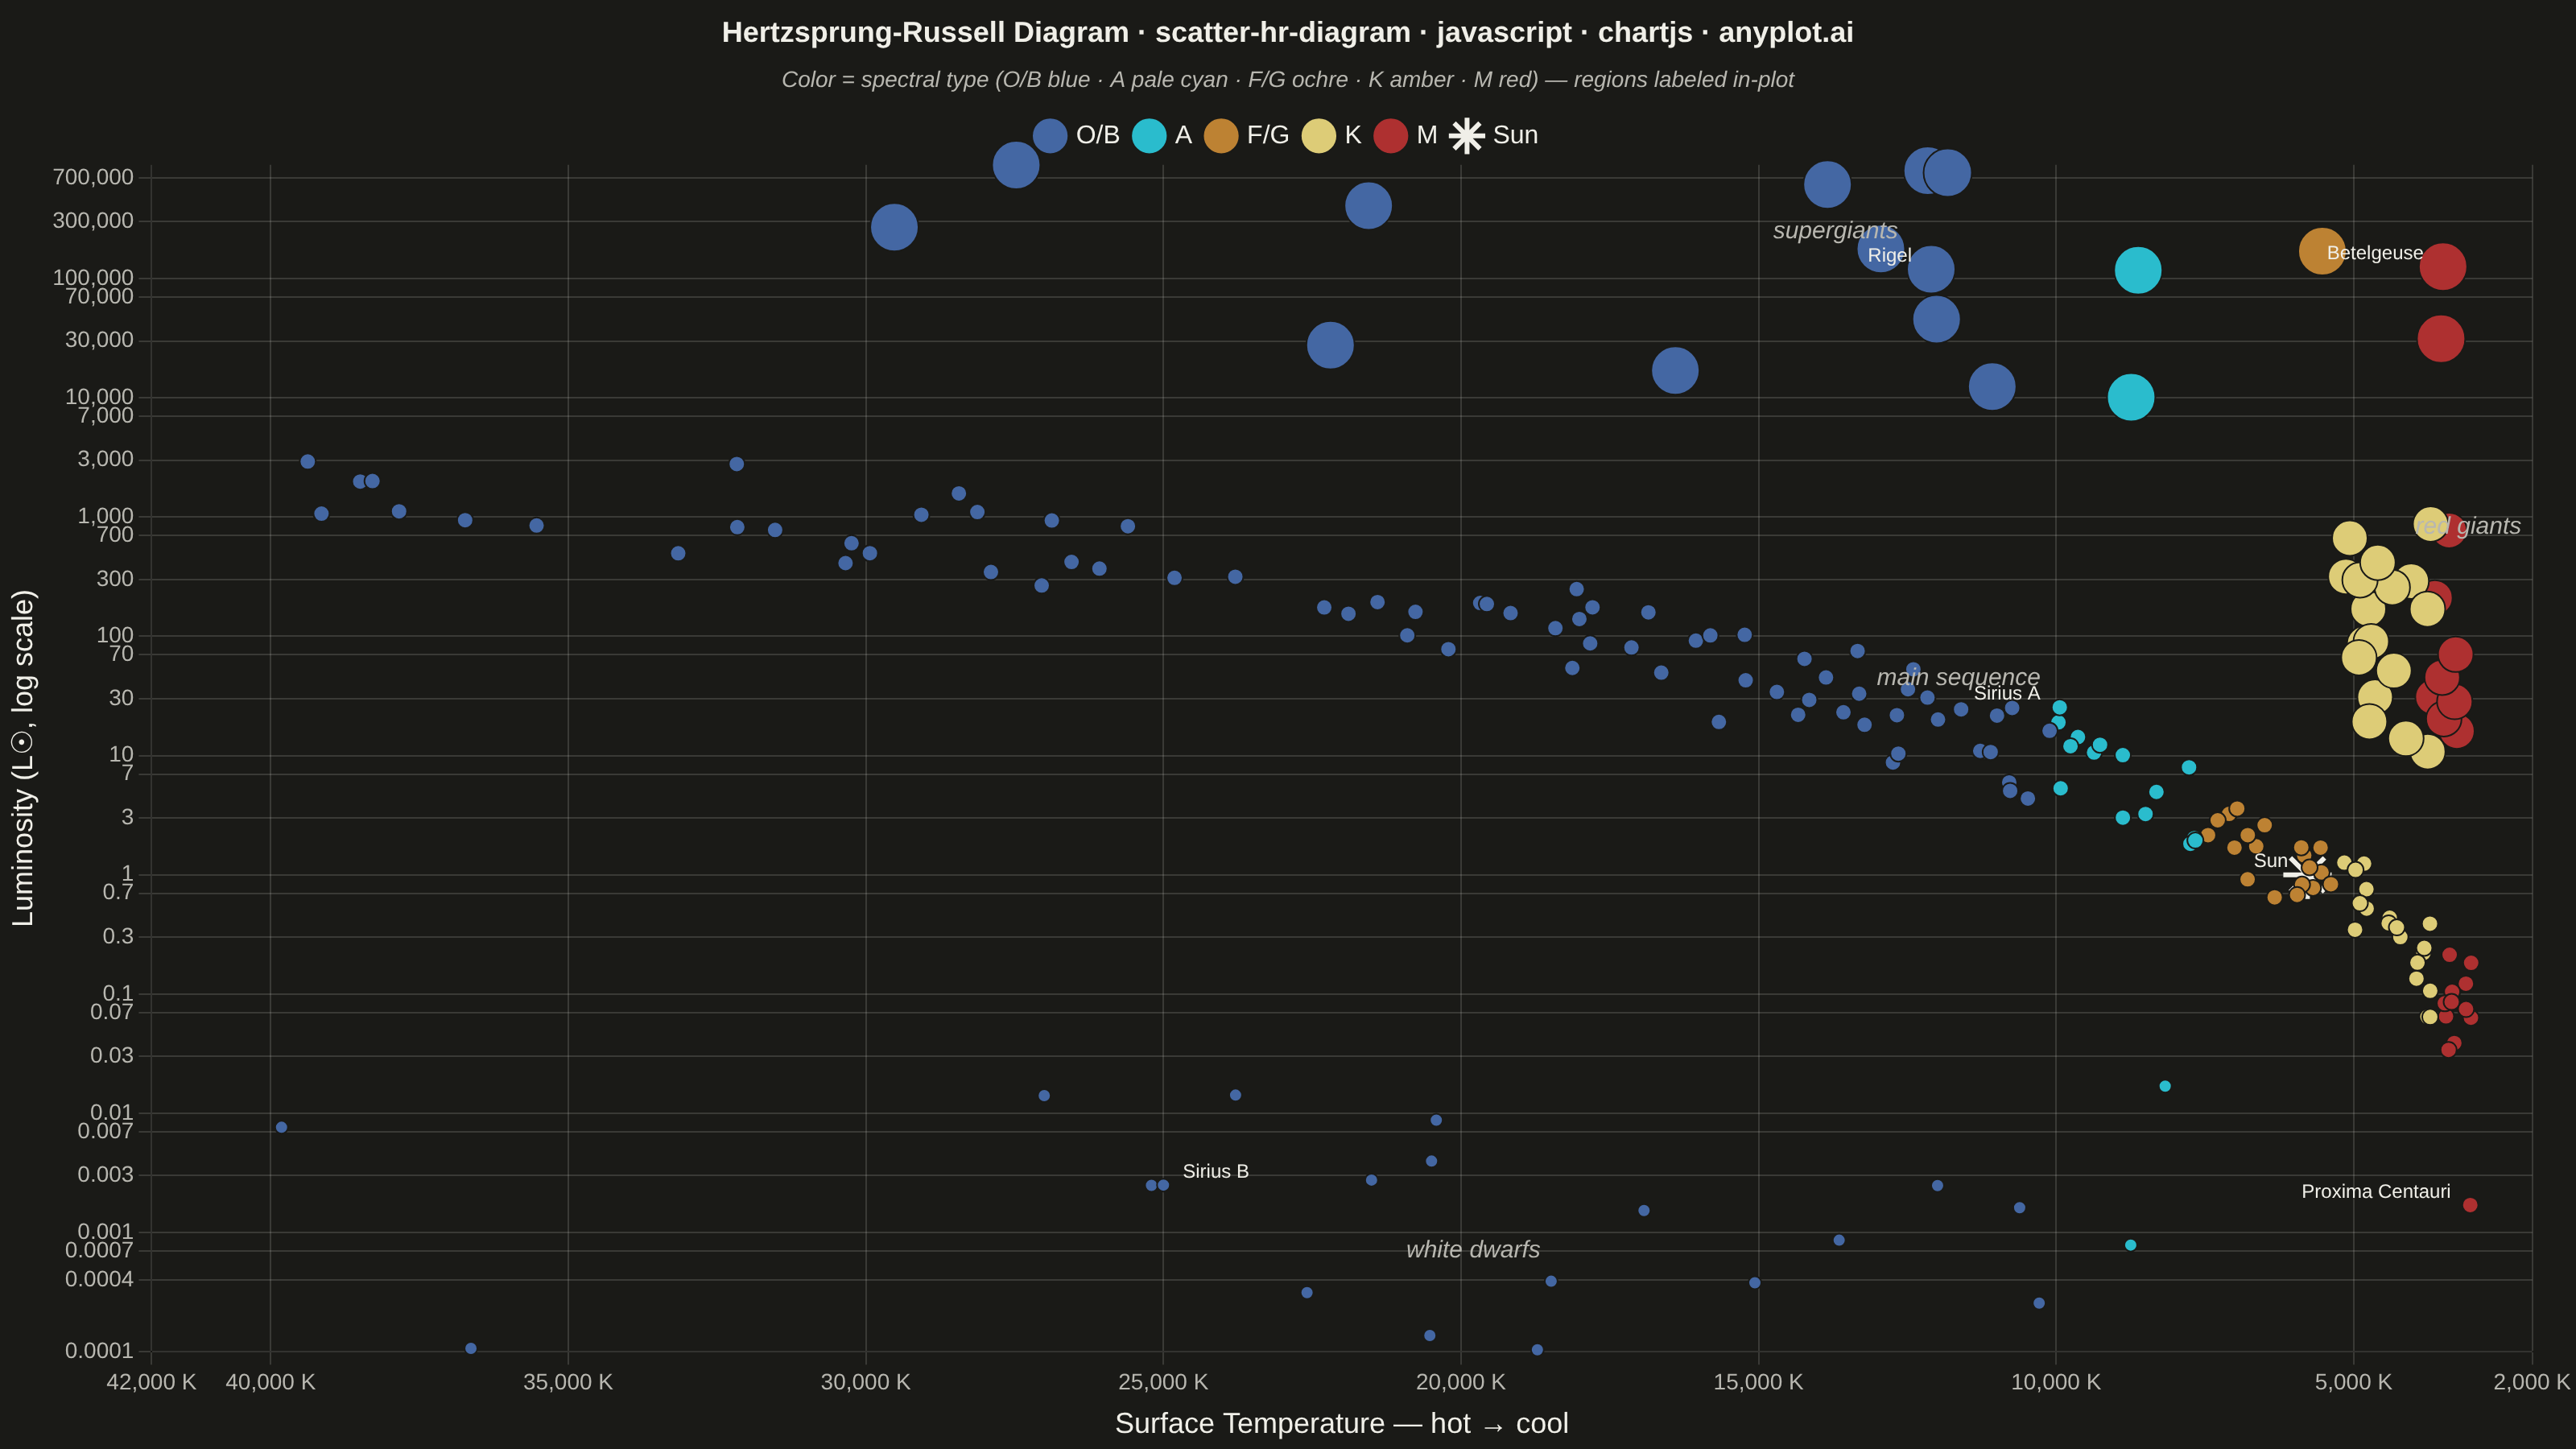
The Hertzsprung-Russell (HR) diagram is the iconic astrophysics scatter plot that shows stellar luminosity (or absolute magnitude) versus surface temperature (or spectral class). Stars naturally cluster along the main sequence diagonal, with distinct regions for red giants, supergiants, and white dwarfs, revealing the fundamental relationship between stellar temperature and brightness.
// anyplot.ai
// scatter-hr-diagram: Hertzsprung-Russell Diagram
// Library: chartjs 4.4.7 | JavaScript 22.23.2
// Quality: 86/100 | Created: 2026-08-26

const t = window.ANYPLOT_TOKENS;

// --- Deterministic PRNG (LCG + Box-Muller) ----------------------------------
const rng = (() => {
  let s = 88172645;
  return () => {
    s = (Math.imul(s, 1664525) + 1013904223) >>> 0;
    return s / 4294967296;
  };
})();
const gaussian = () => {
  const u1 = Math.max(rng(), 1e-6);
  const u2 = rng();
  return Math.sqrt(-2 * Math.log(u1)) * Math.cos(2 * Math.PI * u2);
};

// --- Spectral classification -------------------------------------------------
// Spectral type is derived from surface temperature (the real astrophysical
// relationship) so every star — generated or notable — carries a genuine
// `spectral_type` field, per the spec's data section.
const spectralType = (tempK) => {
  if (tempK >= 30000) return "O";
  if (tempK >= 10000) return "B";
  if (tempK >= 7500) return "A";
  if (tempK >= 6000) return "F";
  if (tempK >= 5200) return "G";
  if (tempK >= 3700) return "K";
  return "M";
};

// The spec mandates conventional spectral colors (blue O/B, white A, yellow
// F/G, orange K, red M). The Imprint palette has no literal white or orange
// hex, so each bucket maps to the closest safe Imprint analogue: cyan stands
// in for "white" (the palette's palest hue) and the fixed amber anchor stands
// in for "orange" (between ochre-yellow and matte-red). This is a documented
// semantic exception (default-style-guide.md "Domain conventions") — the
// spec's explicit color convention outranks the default ordinal palette
// order, which is why the primary series here is not brand green.
const COLOR_GROUPS = {
  OB: { label: "O/B", color: t.palette[2] }, // blue
  A: { label: "A", color: t.palette[5] }, // cyan (≈ white)
  FG: { label: "F/G", color: t.palette[3] }, // ochre (yellow)
  K: { label: "K", color: t.amber }, // amber (≈ orange)
  M: { label: "M", color: t.palette[4] }, // matte red
};
const colorGroupOf = (type) =>
  type === "O" || type === "B" ? "OB" : type === "F" || type === "G" ? "FG" : type;

const star = (x, y, region, name = null) => {
  const type = spectralType(x);
  return { x, y, region, name, spectral_type: type, colorGroup: colorGroupOf(type) };
};

// --- Data: synthetic stellar populations across the HR diagram -------------
// Temperature (K) and luminosity (L☉) follow rough astrophysical scaling laws
// per region; luminosity is log-scaled, temperature axis is reversed (hot→cool).
const LOG_T_SUN = Math.log10(5778);

const mainSequence = Array.from({ length: 140 }, () => {
  const logT = 3.477 + rng() * (4.602 - 3.477);
  const logL = 4.0 * (logT - LOG_T_SUN) + gaussian() * 0.22;
  return star(10 ** logT, 10 ** logL, "main sequence");
});

const redGiants = Array.from({ length: 25 }, () => {
  const logT = 3.477 + rng() * (3.716 - 3.477);
  const logL = 1.0 + rng() * 2.0;
  return star(10 ** logT, 10 ** logL, "red giants");
});

const whiteDwarfs = Array.from({ length: 20 }, () => {
  const logT = 3.903 + rng() * (4.602 - 3.903);
  const logL = -4.3 + rng() * 2.6;
  return star(10 ** logT, 10 ** logL, "white dwarfs");
});

const supergiants = Array.from({ length: 15 }, () => {
  const logT = 3.477 + rng() * (4.477 - 3.477);
  const logL = 4.0 + rng() * 2.0;
  return star(10 ** logT, 10 ** logL, "supergiants");
});

// A handful of real, notable stars — the spec's `star_name` field — spanning
// several regions and spectral types, labeled directly on the canvas.
const notableStars = [
  star(9940, 25.4, "main sequence", "Sirius A"),
  star(3042, 0.0017, "main sequence", "Proxima Centauri"),
  star(3500, 126000, "supergiants", "Betelgeuse"),
  star(12100, 120000, "supergiants", "Rigel"),
  star(25000, 0.0025, "white dwarfs", "Sirius B"),
];

const sun = star(5778, 1, "main sequence", "Sun");

const allStars = [...mainSequence, ...redGiants, ...whiteDwarfs, ...supergiants, ...notableStars];

// Marker radius scales with each region's real relative stellar size.
const REGION_RADIUS = { "main sequence": 5, "red giants": 11, supergiants: 15, "white dwarfs": 4 };

// Where to draw each region's in-plot label (small offset from its centroid
// so the text sits beside the cluster rather than on top of it).
const REGION_LABEL_POS = {
  "main sequence": { dx: 70, dy: -46 },
  "red giants": { dx: 40, dy: -70 },
  supergiants: { dx: 0, dy: -24 },
  "white dwarfs": { dx: 0, dy: 22 },
};

// --- Mount -------------------------------------------------------------------
const canvas = document.createElement("canvas");
document.getElementById("container").appendChild(canvas);

// --- In-plot labeling plugin --------------------------------------------------
// Draws the four required region labels near each cluster's centroid, plus
// the notable-star names, directly on the canvas. Region is a secondary
// encoding here (color is reserved for spectral type per the spec's Notes),
// so it is called out in-plot rather than via a second legend.
const labelPlugin = {
  id: "hrLabels",
  afterDatasetsDraw(chart) {
    const { ctx, scales } = chart;
    ctx.save();

    ctx.font = "italic 15px sans-serif";
    ctx.fillStyle = t.inkSoft;
    ctx.textAlign = "center";
    for (const [region, pos] of Object.entries(REGION_LABEL_POS)) {
      const pts = allStars.filter((s) => s.region === region);
      if (!pts.length) continue;
      const cx = pts.reduce((sum, p) => sum + p.x, 0) / pts.length;
      const cy = 10 ** (pts.reduce((sum, p) => sum + Math.log10(p.y), 0) / pts.length);
      const px = scales.x.getPixelForValue(cx) + pos.dx;
      const py = scales.y.getPixelForValue(cy) + pos.dy;
      ctx.fillText(region, px, py);
    }

    ctx.font = "12px sans-serif";
    ctx.fillStyle = t.ink;
    const midX = (scales.x.left + scales.x.right) / 2;
    for (const s of [...notableStars, sun]) {
      const px = scales.x.getPixelForValue(s.x);
      const py = scales.y.getPixelForValue(s.y);
      const rightHalf = px > midX;
      ctx.textAlign = rightHalf ? "right" : "left";
      ctx.fillText(s.name, px + (rightHalf ? -12 : 12), py - 8);
    }

    ctx.restore();
  },
};

// --- Chart ---------------------------------------------------------------
new Chart(canvas, {
  type: "scatter",
  data: {
    datasets: [
      ...Object.entries(COLOR_GROUPS)
        .map(([key, group]) => {
          const pts = allStars.filter((s) => s.colorGroup === key);
          if (!pts.length) return null;
          return {
            label: group.label,
            data: pts.map((p) => ({ x: p.x, y: p.y })),
            backgroundColor: group.color,
            borderColor: t.pageBg,
            borderWidth: 1,
            radius: pts.map((p) => REGION_RADIUS[p.region]),
          };
        })
        .filter(Boolean),
      {
        // "star" is a stroke-only asterisk shape in Chart.js (no fillable
        // area), so it needs a visible borderColor, not the page-background
        // edge used by the filled spectral-group markers above.
        label: "Sun",
        data: [{ x: sun.x, y: sun.y }],
        backgroundColor: t.ink,
        borderColor: t.ink,
        borderWidth: 3,
        radius: 15,
        pointStyle: "star",
      },
    ],
  },
  plugins: [labelPlugin],
  options: {
    responsive: true,
    maintainAspectRatio: false,
    animation: false,
    plugins: {
      title: {
        display: true,
        text: "Hertzsprung-Russell Diagram · scatter-hr-diagram · javascript · chartjs · anyplot.ai",
        color: t.ink,
        font: { size: 18 },
      },
      subtitle: {
        display: true,
        text: "Color = spectral type (O/B blue · A pale cyan · F/G ochre · K amber · M red) — regions labeled in-plot",
        color: t.inkSoft,
        font: { size: 14, style: "italic" },
        padding: { bottom: 8 },
      },
      legend: {
        labels: { color: t.ink, font: { size: 16 }, usePointStyle: true },
      },
    },
    scales: {
      x: {
        type: "linear",
        reverse: true,
        min: 2000,
        max: 42000,
        ticks: {
          color: t.inkSoft,
          font: { size: 14 },
          callback: (value) => `${value.toLocaleString()} K`,
        },
        grid: { color: t.grid },
        title: {
          display: true,
          text: "Surface Temperature — hot → cool",
          color: t.ink,
          font: { size: 18 },
        },
      },
      y: {
        type: "logarithmic",
        ticks: {
          color: t.inkSoft,
          font: { size: 14 },
          callback: (value) => {
            const num = Number(value);
            return num >= 1000 ? num.toLocaleString() : num.toString();
          },
        },
        grid: { color: t.grid },
        title: {
          display: true,
          text: "Luminosity (L☉, log scale)",
          color: t.ink,
          font: { size: 18 },
        },
      },
    },
  },
});
Runnable source as JSON, for any HTTP client: https://api.anyplot.ai/specs/scatter-hr-diagram/chartjs/code. Any spec id and library id listed in llms-full.txt fit the same URL shape; every URL below is complete and callable.
{
  "spec_id": "scatter-hr-diagram",
  "language": "javascript",
  "library": "chartjs",
  "page": "https://anyplot.ai/scatter-hr-diagram/javascript/chartjs",
  "hub": "https://anyplot.ai/scatter-hr-diagram",
  "code_json": "https://api.anyplot.ai/specs/scatter-hr-diagram/chartjs/code",
  "spec_json": "https://api.anyplot.ai/specs/scatter-hr-diagram",
  "render_light_png": "https://storage.googleapis.com/anyplot-images/plots/scatter-hr-diagram/javascript/chartjs/plot-light.png",
  "render_dark_png": "https://storage.googleapis.com/anyplot-images/plots/scatter-hr-diagram/javascript/chartjs/plot-dark.png",
  "interactive_light_html": "https://storage.googleapis.com/anyplot-images/plots/scatter-hr-diagram/javascript/chartjs/plot-light.html",
  "interactive_dark_html": "https://storage.googleapis.com/anyplot-images/plots/scatter-hr-diagram/javascript/chartjs/plot-dark.html",
  "quality_score": 86.0,
  "license": "MIT",
  "guide": "https://anyplot.ai/llms.txt"
}
Part of Hertzsprung-Russell Diagram on anyplot.ai.