The same plot in 14 other libraries — JavaScript: D3.js, Apache ECharts, Highcharts, MUI X Charts; Python: Altair, Bokeh, lets-plot, Matplotlib, Plotly, plotnine, Pygal, Seaborn; R: ggplot2; Julia: Makie.jl. Compare all 15 side by side: Soccer Pitch Event Map in Python, R, Julia and JavaScript.
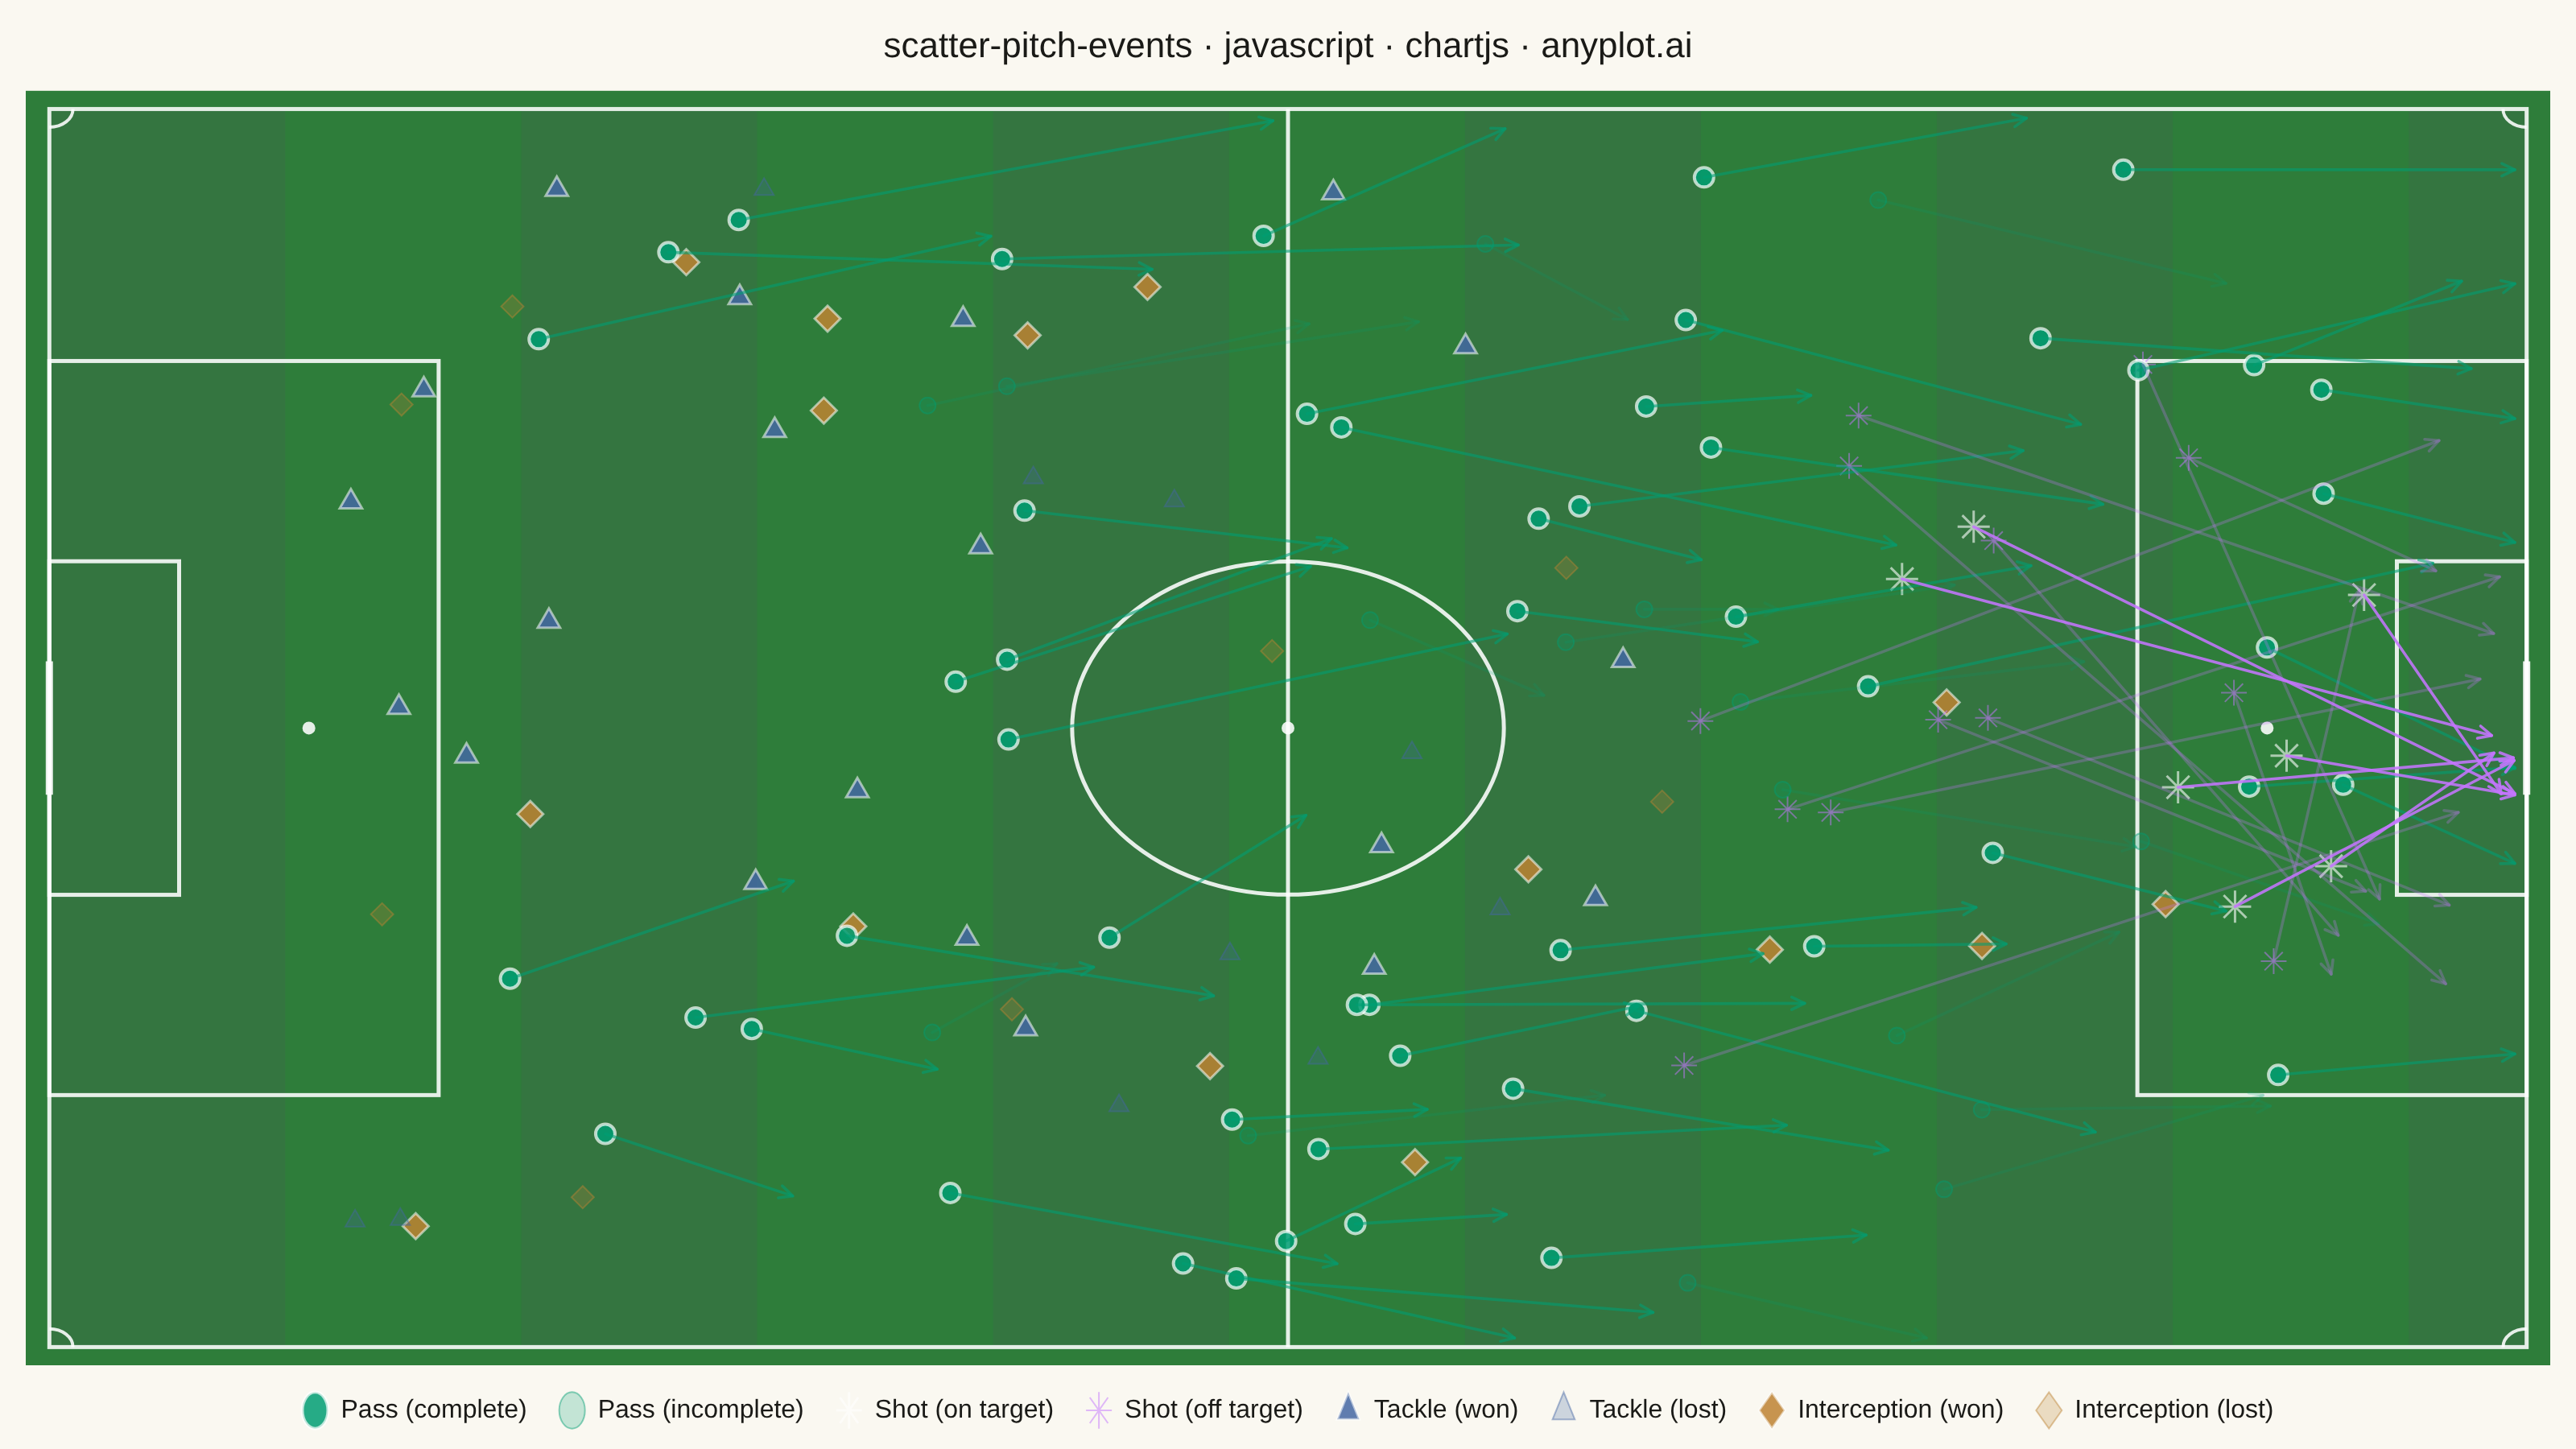
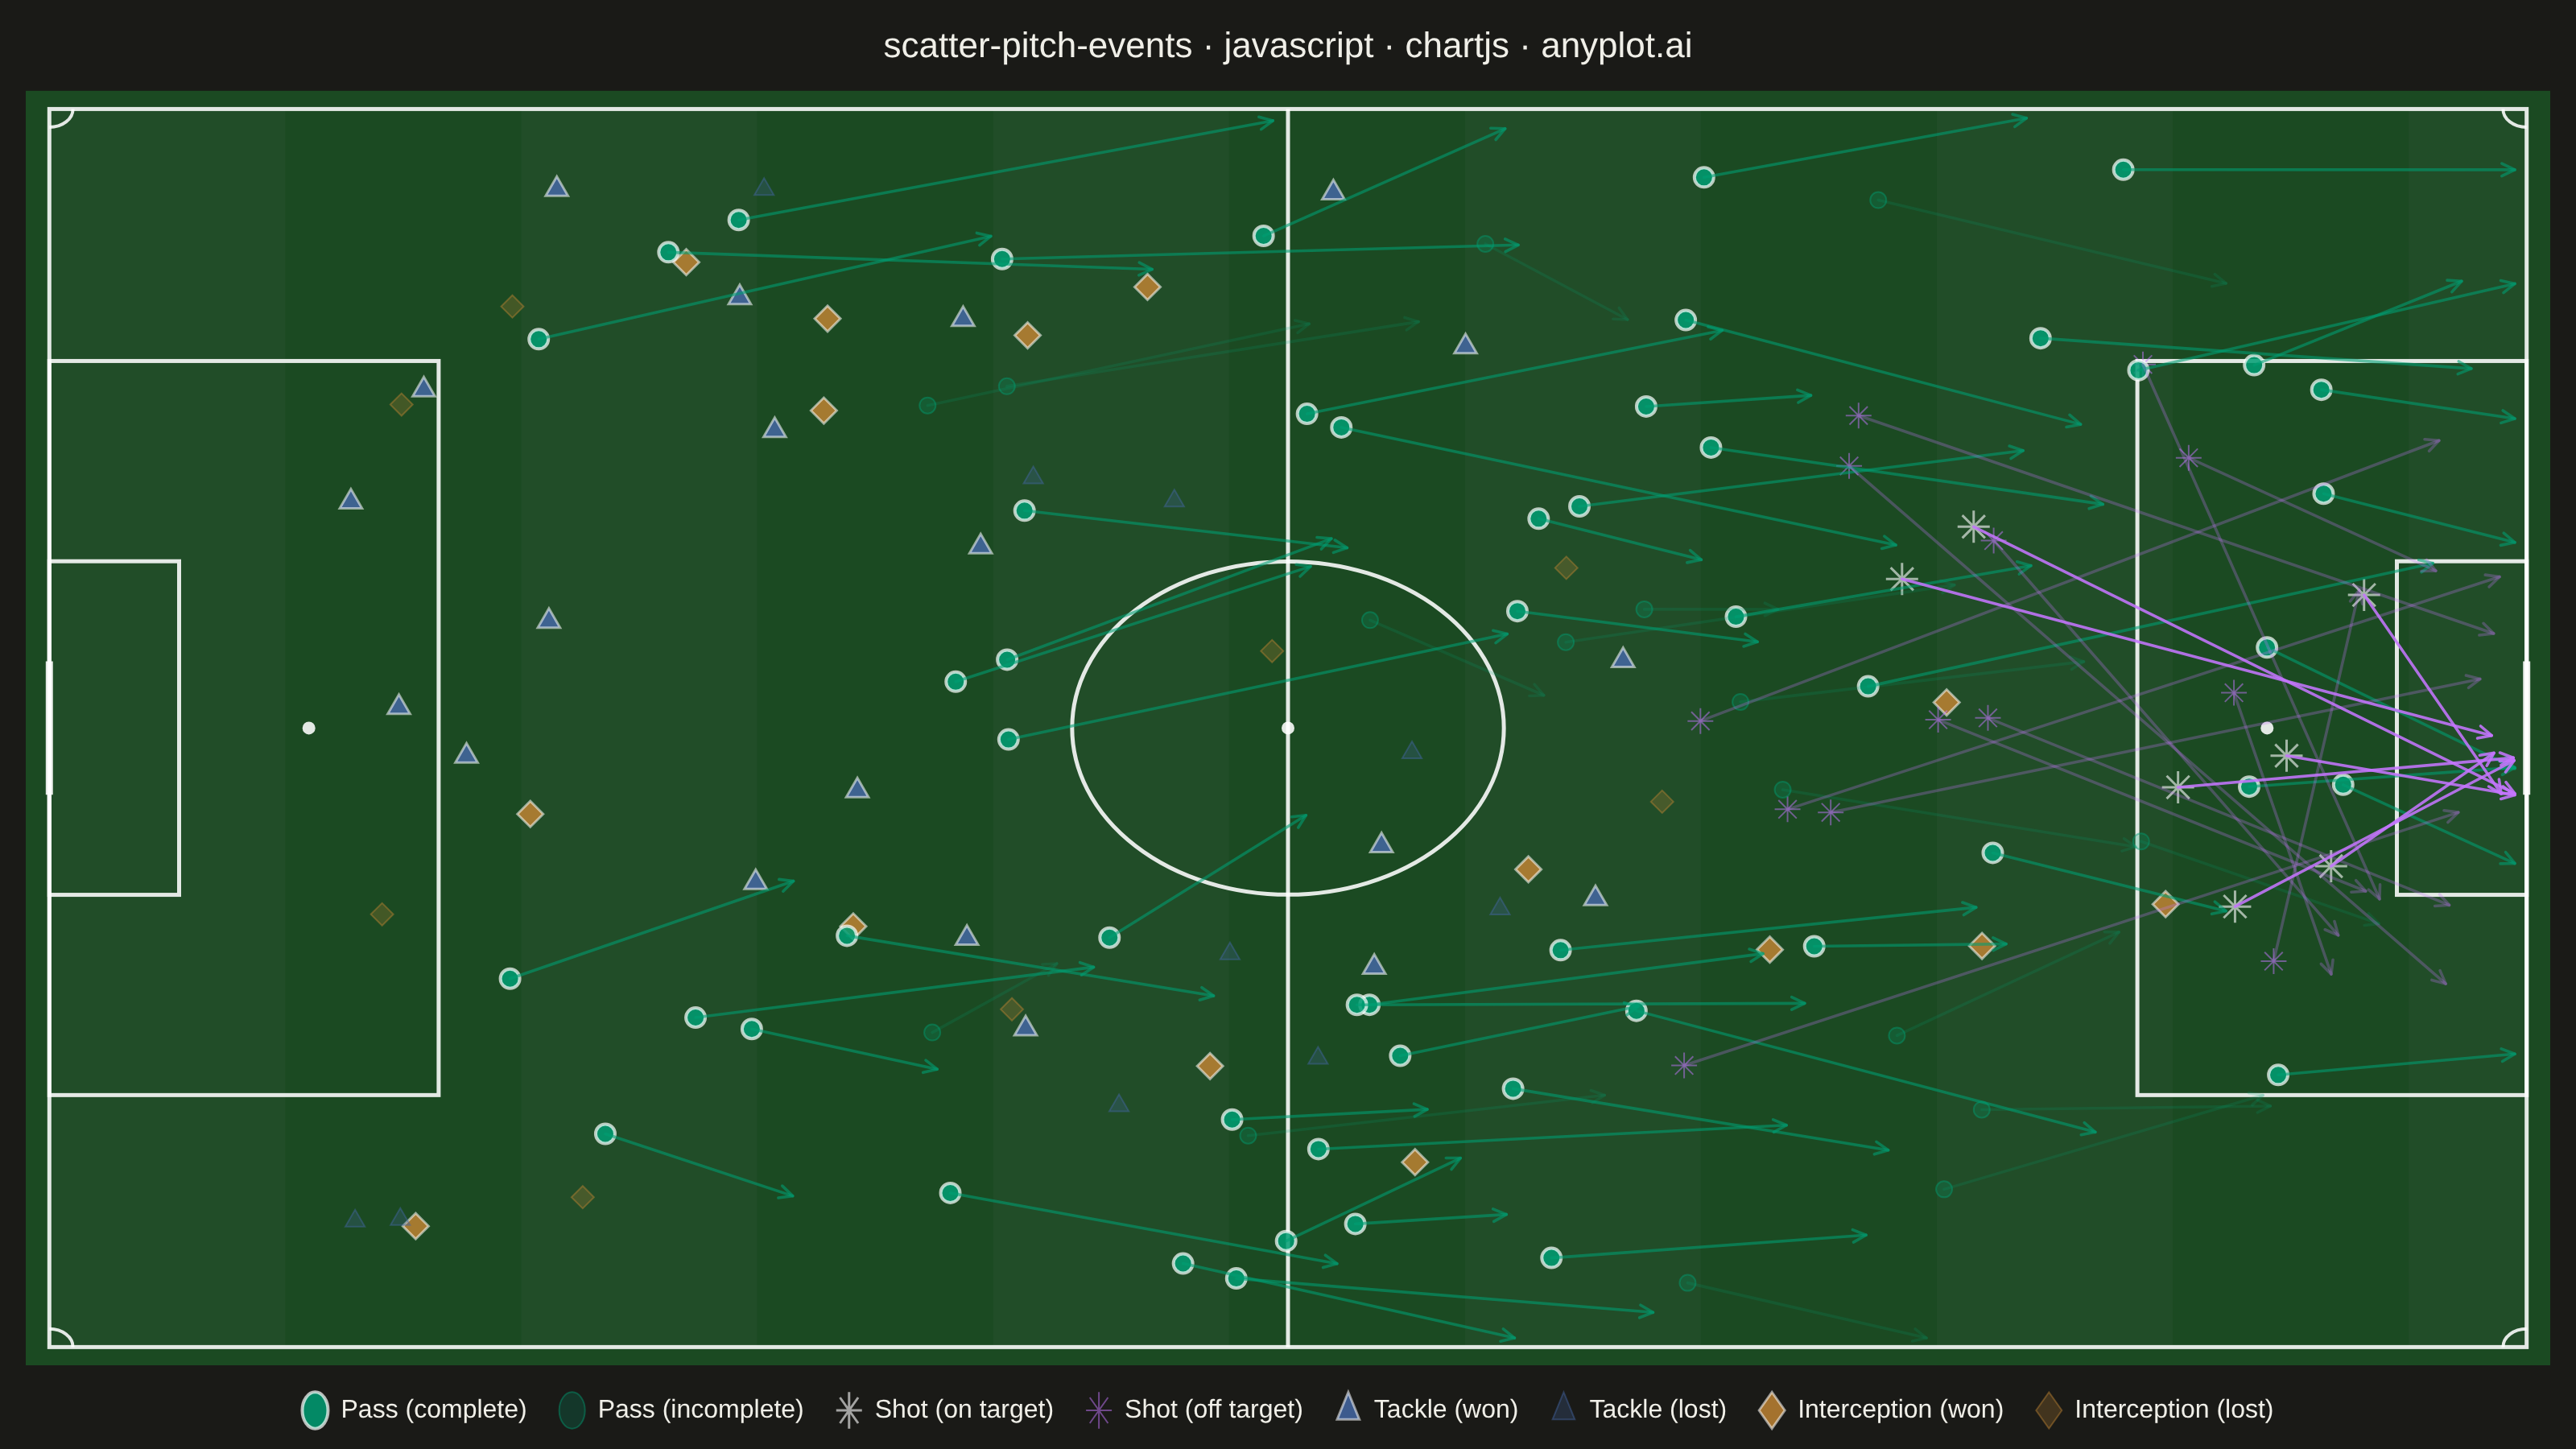
A soccer pitch event map positions match events (passes, shots, tackles, interceptions) as markers on an accurately scaled football pitch diagram. The pitch is drawn with standard markings including penalty areas, center circle, goal areas, and halfway line. Each event type uses distinct markers and colors, with directional arrows for passes and shots. This visualization is essential for tactical match analysis, scouting, and coaching in football analytics.
// anyplot.ai
// scatter-pitch-events: Soccer Pitch Event Map
// Library: chartjs 4.4.7 | JavaScript 22.22.3
// Quality: 95/100 | Created: 2026-06-21

const t = window.ANYPLOT_TOKENS;

// Pitch surface (green turf)
const GRASS  = window.ANYPLOT_THEME === 'light' ? '#2e7d3a' : '#1b4a22';
const STRIPE = window.ANYPLOT_THEME === 'light' ? '#347540' : '#214d28';
const LINE_C = 'rgba(255,255,255,0.88)';

// Imprint palette positions 1-4 via tokens (data colors theme-independent)
const PASS_C   = t.palette[0]; // #009E73 — passes
const SHOT_C   = t.palette[1]; // #C475FD — shots
const TACKLE_C = t.palette[2]; // #4467A3 — tackles
const INT_C    = t.palette[3]; // #BD8233 — interceptions

function hexRgba(hex, a) {
  const r = parseInt(hex.slice(1, 3), 16);
  const g = parseInt(hex.slice(3, 5), 16);
  const b = parseInt(hex.slice(5, 7), 16);
  return `rgba(${r},${g},${b},${a})`;
}

// Deterministic LCG (seed 42) — browser has no seeded RNG
let _s = 42;
function rand() {
  _s = (Math.imul(1664525, _s) + 1013904223) >>> 0;
  return _s / 4294967296;
}

// Arrow store: {x1,y1,x2,y2,color,alpha} in pitch metres
const arrows = [];

// ---- Data generation -------------------------------------------------------

// Passes (circles) — midfield and attacking third; arrows show forward direction
const passSucPts = [], passUnsPts = [];
for (let i = 0; i < 52; i++) {
  const x = 18 + rand() * 80, y = 3 + rand() * 62;
  const dx = 6 + rand() * 18, dy = (rand() - 0.5) * 14;
  arrows.push({ x1: x, y1: y, x2: x + dx, y2: y + dy, color: PASS_C, alpha: 0.58 });
  passSucPts.push({ x, y });
}
for (let i = 0; i < 16; i++) {
  const x = 22 + rand() * 68, y = 3 + rand() * 62;
  const dx = 4 + rand() * 14, dy = (rand() - 0.5) * 12;
  arrows.push({ x1: x, y1: y, x2: x + dx, y2: y + dy, color: PASS_C, alpha: 0.18 });
  passUnsPts.push({ x, y });
}

// Shots (stars) — attacking zone; arrows point toward goal (x=105)
const shotSucPts = [], shotUnsPts = [];
for (let i = 0; i < 7; i++) {
  const x = 76 + rand() * 24, y = 22 + rand() * 24;
  const x2 = 103 + rand() * 2, y2 = 30 + rand() * 8;
  arrows.push({ x1: x, y1: y, x2, y2, color: SHOT_C, alpha: 0.88 });
  shotSucPts.push({ x, y });
}
for (let i = 0; i < 13; i++) {
  const x = 68 + rand() * 32, y = 14 + rand() * 40;
  const x2 = 96 + rand() * 8, y2 = 18 + rand() * 32;
  arrows.push({ x1: x, y1: y, x2: Math.min(104, x2), y2, color: SHOT_C, alpha: 0.28 });
  shotUnsPts.push({ x, y });
}

// Tackles (triangles) — mostly defensive half
const tackleSucPts = Array.from({ length: 20 }, () => ({ x: 5 + rand() * 62, y: 4 + rand() * 60 }));
const tackleUnsPts = Array.from({ length: 10 }, () => ({ x: 5 + rand() * 66, y: 4 + rand() * 60 }));

// Interceptions (diamonds) — spread across the pitch
const intSucPts = Array.from({ length: 15 }, () => ({ x: 10 + rand() * 80, y: 4 + rand() * 60 }));
const intUnsPts = Array.from({ length: 8  }, () => ({ x: 10 + rand() * 75, y: 4 + rand() * 60 }));

// Clamp arrow endpoints inside pitch bounds
arrows.forEach(a => {
  a.x2 = Math.max(0.5, Math.min(104.5, a.x2));
  a.y2 = Math.max(0.5, Math.min(67.5,  a.y2));
});

// ---- Mount -----------------------------------------------------------------
const canvas = document.createElement('canvas');
document.getElementById('container').appendChild(canvas);

// ---- Plugins ---------------------------------------------------------------

const pitchPlugin = {
  id: 'pitch',
  beforeDraw(chart) {
    const { ctx, scales: { x: xs, y: ys }, chartArea: ca } = chart;
    const px = v => xs.getPixelForValue(v);
    const py = v => ys.getPixelForValue(v);

    // Derived pitch dimensions in canvas pixels
    const ptx = px(0);
    const pty = py(68);           // top of pitch (y=68 in pitch = top of canvas)
    const pw  = px(105) - px(0);
    const ph  = py(0)   - py(68); // positive (canvas y is inverted vs. pitch y)

    ctx.save();

    // Grass fill for entire chart area (represents the playing surface)
    ctx.fillStyle = GRASS;
    ctx.fillRect(ca.left, ca.top, ca.width, ca.height);

    // Alternating 10m stripe bands within pitch bounds
    const stripeW = px(10) - px(0);
    ctx.fillStyle = STRIPE;
    for (let i = 0; i < 11; i += 2) {
      const bx = px(i * 10);
      const bw = Math.min(stripeW, px(105) - px(i * 10));
      if (bw > 0) ctx.fillRect(bx, pty, bw, ph);
    }

    ctx.strokeStyle = LINE_C;
    ctx.lineWidth   = 2.5;
    ctx.lineJoin    = 'miter';
    ctx.lineCap     = 'butt';

    // Pitch outline
    ctx.strokeRect(ptx, pty, pw, ph);

    // Halfway line
    ctx.beginPath(); ctx.moveTo(px(52.5), pty); ctx.lineTo(px(52.5), pty + ph); ctx.stroke();

    // Helper: stroke a rectangle in pitch coordinates (y1 < y2)
    const pRect = (x1, y1, x2, y2) =>
      ctx.strokeRect(px(x1), py(y2), px(x2) - px(x1), py(y1) - py(y2));

    // Left penalty area (16.5m deep, 40.32m wide, centred on goal y=34)
    pRect(0,    13.84, 16.5, 54.16);
    // Left goal area (5.5m deep, 18.32m wide)
    pRect(0,    24.84, 5.5,  43.16);

    // Right penalty area
    pRect(88.5, 13.84, 105,  54.16);
    // Right goal area
    pRect(99.5, 24.84, 105,  43.16);

    // Goals — 7.32m wide (y = 34 ± 3.66), thick stroke on goal line
    ctx.lineWidth = 4.5;
    ctx.beginPath(); ctx.moveTo(px(0),   py(30.34)); ctx.lineTo(px(0),   py(37.66)); ctx.stroke();
    ctx.beginPath(); ctx.moveTo(px(105), py(30.34)); ctx.lineTo(px(105), py(37.66)); ctx.stroke();
    ctx.lineWidth = 2.5;

    // Center circle (r=9.15m; rendered as ellipse because chart area is wider than 105:68)
    const crx = Math.abs(px(52.5 + 9.15) - px(52.5));
    const cry = Math.abs(py(34  + 9.15) - py(34));
    ctx.beginPath();
    ctx.ellipse(px(52.5), py(34), crx, cry, 0, 0, 2 * Math.PI);
    ctx.stroke();

    // Spots: centre, left penalty (11m), right penalty (94m)
    ctx.fillStyle = LINE_C;
    [[52.5, 34], [11, 34], [94, 34]].forEach(([mx, my]) => {
      ctx.beginPath(); ctx.arc(px(mx), py(my), 4, 0, 2 * Math.PI); ctx.fill();
    });

    // Corner arcs (r=1m)
    // Canvas angle convention: 0=E, π/2=S (canvas down), π=W, 3π/2=N (canvas up)
    // Pitch y is inverted vs canvas y, so pitch bottom-left = canvas bottom-left
    ctx.lineWidth = 2;
    const mX = Math.abs(px(1) - px(0)); // 1m in x-pixels
    const mY = Math.abs(py(1) - py(0)); // 1m in y-pixels
    const cArc = (mx, my, s, e) => {
      ctx.beginPath();
      ctx.ellipse(px(mx), py(my), mX, mY, 0, s, e, false);
      ctx.stroke();
    };
    cArc(0,   0,  3 * Math.PI / 2, 2 * Math.PI);   // bottom-left  → NE in canvas
    cArc(105, 0,  Math.PI,         3 * Math.PI / 2); // bottom-right → NW
    cArc(0,   68, 0,               Math.PI / 2);     // top-left     → SE
    cArc(105, 68, Math.PI / 2,     Math.PI);         // top-right    → SW

    ctx.restore();
  },
};

const arrowPlugin = {
  id: 'arrows',
  afterDatasetsDraw(chart) {
    const { ctx, scales: { x: xs, y: ys }, chartArea: ca } = chart;
    ctx.save();

    // Clip to chart area so arrows don't bleed outside
    ctx.beginPath();
    ctx.rect(ca.left, ca.top, ca.width, ca.height);
    ctx.clip();

    ctx.lineCap = 'round';
    const HEAD = 9;

    arrows.forEach(({ x1, y1, x2, y2, color, alpha }) => {
      const cx1 = xs.getPixelForValue(x1), cy1 = ys.getPixelForValue(y1);
      const cx2 = xs.getPixelForValue(x2), cy2 = ys.getPixelForValue(y2);
      const ang = Math.atan2(cy2 - cy1, cx2 - cx1);

      ctx.globalAlpha = alpha;
      ctx.strokeStyle = color;
      ctx.lineWidth   = 1.8;

      ctx.beginPath();
      ctx.moveTo(cx1, cy1);
      ctx.lineTo(cx2, cy2);
      ctx.stroke();

      // Arrowhead barbs
      ctx.beginPath();
      ctx.moveTo(cx2, cy2);
      ctx.lineTo(cx2 - HEAD * Math.cos(ang - Math.PI / 7), cy2 - HEAD * Math.sin(ang - Math.PI / 7));
      ctx.moveTo(cx2, cy2);
      ctx.lineTo(cx2 - HEAD * Math.cos(ang + Math.PI / 7), cy2 - HEAD * Math.sin(ang + Math.PI / 7));
      ctx.stroke();
    });

    ctx.globalAlpha = 1;
    ctx.restore();
  },
};

// ---- Chart -----------------------------------------------------------------
new Chart(canvas, {
  type: 'scatter',
  plugins: [pitchPlugin, arrowPlugin],
  data: {
    datasets: [
      {
        label: 'Pass (complete)',
        data: passSucPts,
        pointStyle: 'circle',
        pointRadius: 6,
        backgroundColor: hexRgba(PASS_C, 0.85),
        borderColor: 'rgba(255,255,255,0.70)',
        borderWidth: 2,
      },
      {
        label: 'Pass (incomplete)',
        data: passUnsPts,
        pointStyle: 'circle',
        pointRadius: 5,
        backgroundColor: hexRgba(PASS_C, 0.22),
        borderColor: hexRgba(PASS_C, 0.45),
        borderWidth: 1,
      },
      {
        label: 'Shot (on target)',
        data: shotSucPts,
        pointStyle: 'star',
        pointRadius: 10,
        backgroundColor: hexRgba(SHOT_C, 0.92),
        borderColor: 'rgba(255,255,255,0.6)',
        borderWidth: 1.5,
      },
      {
        label: 'Shot (off target)',
        data: shotUnsPts,
        pointStyle: 'star',
        pointRadius: 8,
        backgroundColor: hexRgba(SHOT_C, 0.25),
        borderColor: hexRgba(SHOT_C, 0.5),
        borderWidth: 1,
      },
      {
        label: 'Tackle (won)',
        data: tackleSucPts,
        pointStyle: 'triangle',
        pointRadius: 8,
        backgroundColor: hexRgba(TACKLE_C, 0.85),
        borderColor: 'rgba(255,255,255,0.55)',
        borderWidth: 1.5,
      },
      {
        label: 'Tackle (lost)',
        data: tackleUnsPts,
        pointStyle: 'triangle',
        pointRadius: 7,
        backgroundColor: hexRgba(TACKLE_C, 0.25),
        borderColor: hexRgba(TACKLE_C, 0.45),
        borderWidth: 1,
      },
      {
        label: 'Interception (won)',
        data: intSucPts,
        pointStyle: 'rectRot',
        pointRadius: 8,
        backgroundColor: hexRgba(INT_C, 0.85),
        borderColor: 'rgba(255,255,255,0.55)',
        borderWidth: 1.5,
      },
      {
        label: 'Interception (lost)',
        data: intUnsPts,
        pointStyle: 'rectRot',
        pointRadius: 7,
        backgroundColor: hexRgba(INT_C, 0.25),
        borderColor: hexRgba(INT_C, 0.45),
        borderWidth: 1,
      },
    ],
  },
  options: {
    responsive: true,
    maintainAspectRatio: false,
    animation: false,
    plugins: {
      title: {
        display: true,
        text: 'scatter-pitch-events · javascript · chartjs · anyplot.ai',
        color: t.ink,
        font: { size: 22, weight: '500' },
        padding: { top: 10, bottom: 14 },
      },
      legend: {
        display: true,
        position: 'bottom',
        labels: {
          color: t.ink,
          font: { size: 16 },
          padding: 20,
          usePointStyle: true,
          pointStyleWidth: 16,
        },
      },
    },
    scales: {
      x: { type: 'linear', min: -1, max: 106, display: false, grid: { display: false } },
      y: { type: 'linear', min: -1, max: 69,  display: false, grid: { display: false } },
    },
    layout: {
      padding: { left: 16, right: 16, top: 6, bottom: 6 },
    },
  },
});
Runnable source as JSON, for any HTTP client: https://api.anyplot.ai/specs/scatter-pitch-events/chartjs/code. Any spec id and library id listed in llms-full.txt fit the same URL shape; every URL below is complete and callable.
{
  "spec_id": "scatter-pitch-events",
  "language": "javascript",
  "library": "chartjs",
  "page": "https://anyplot.ai/scatter-pitch-events/javascript/chartjs",
  "hub": "https://anyplot.ai/scatter-pitch-events",
  "code_json": "https://api.anyplot.ai/specs/scatter-pitch-events/chartjs/code",
  "spec_json": "https://api.anyplot.ai/specs/scatter-pitch-events",
  "render_light_png": "https://storage.googleapis.com/anyplot-images/plots/scatter-pitch-events/javascript/chartjs/plot-light.png",
  "render_dark_png": "https://storage.googleapis.com/anyplot-images/plots/scatter-pitch-events/javascript/chartjs/plot-dark.png",
  "interactive_light_html": "https://storage.googleapis.com/anyplot-images/plots/scatter-pitch-events/javascript/chartjs/plot-light.html",
  "interactive_dark_html": "https://storage.googleapis.com/anyplot-images/plots/scatter-pitch-events/javascript/chartjs/plot-dark.html",
  "quality_score": 95.0,
  "license": "MIT",
  "guide": "https://anyplot.ai/llms.txt"
}
Part of Soccer Pitch Event Map on anyplot.ai.