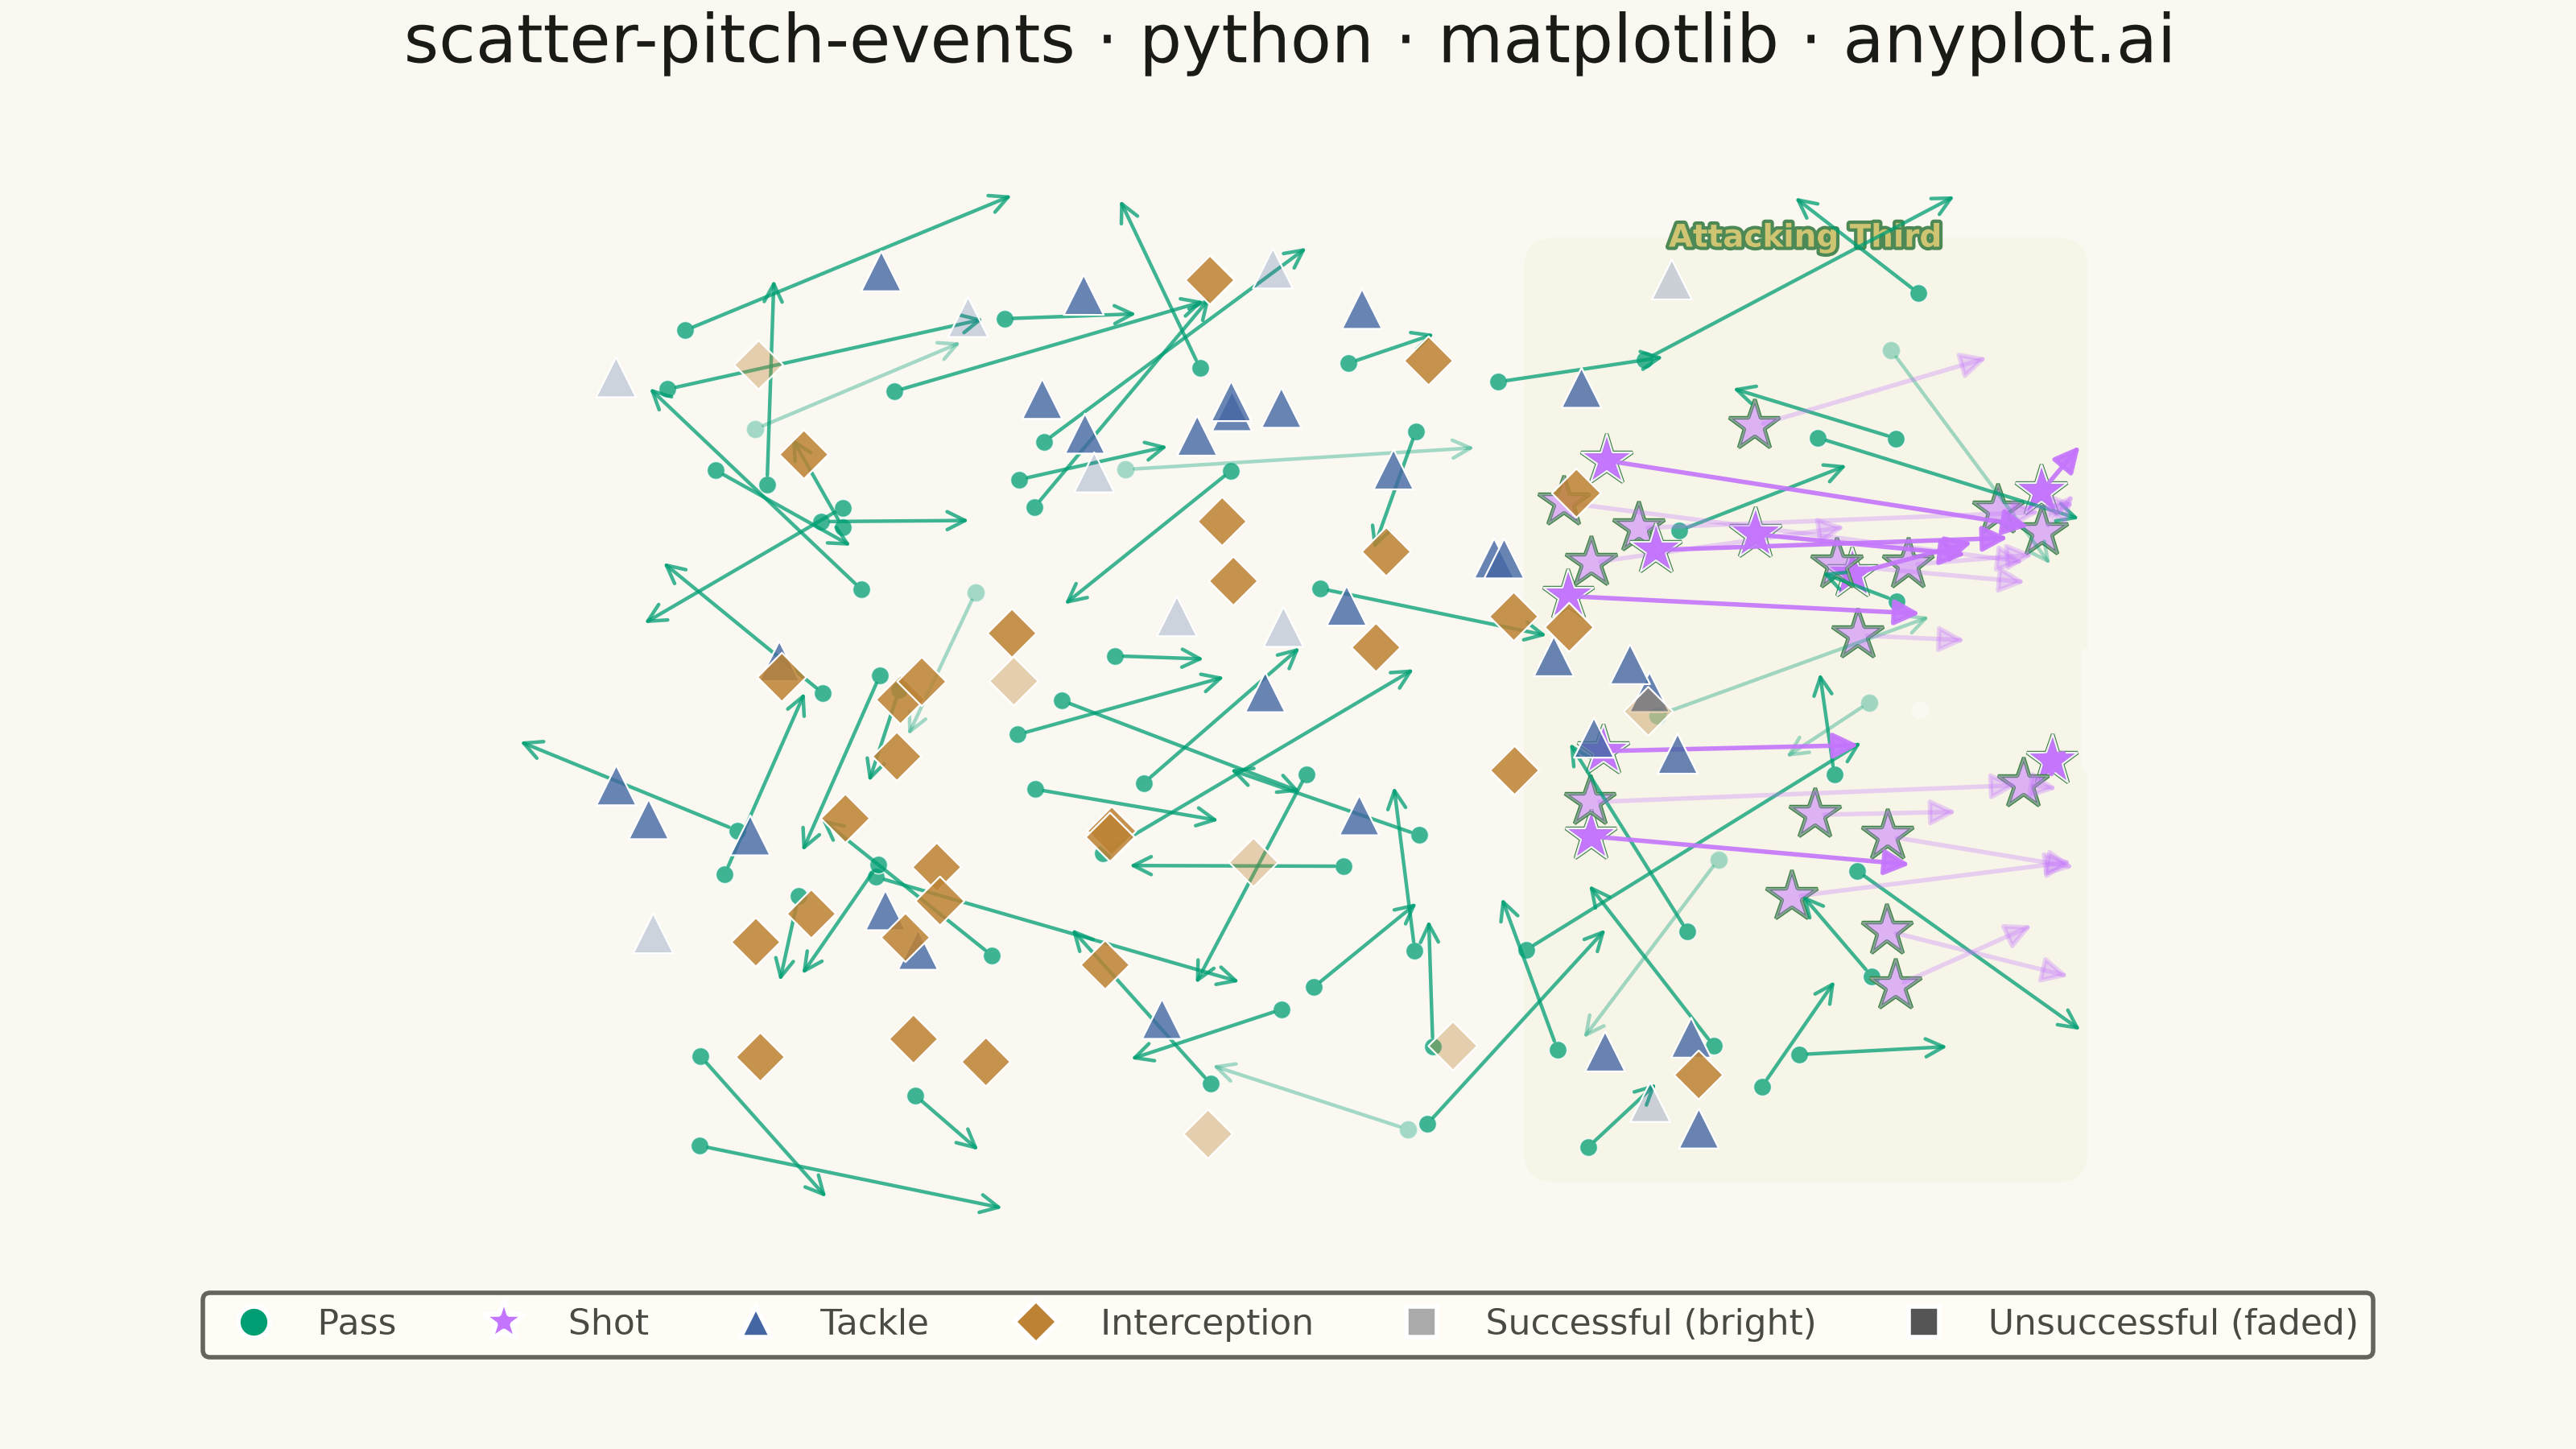
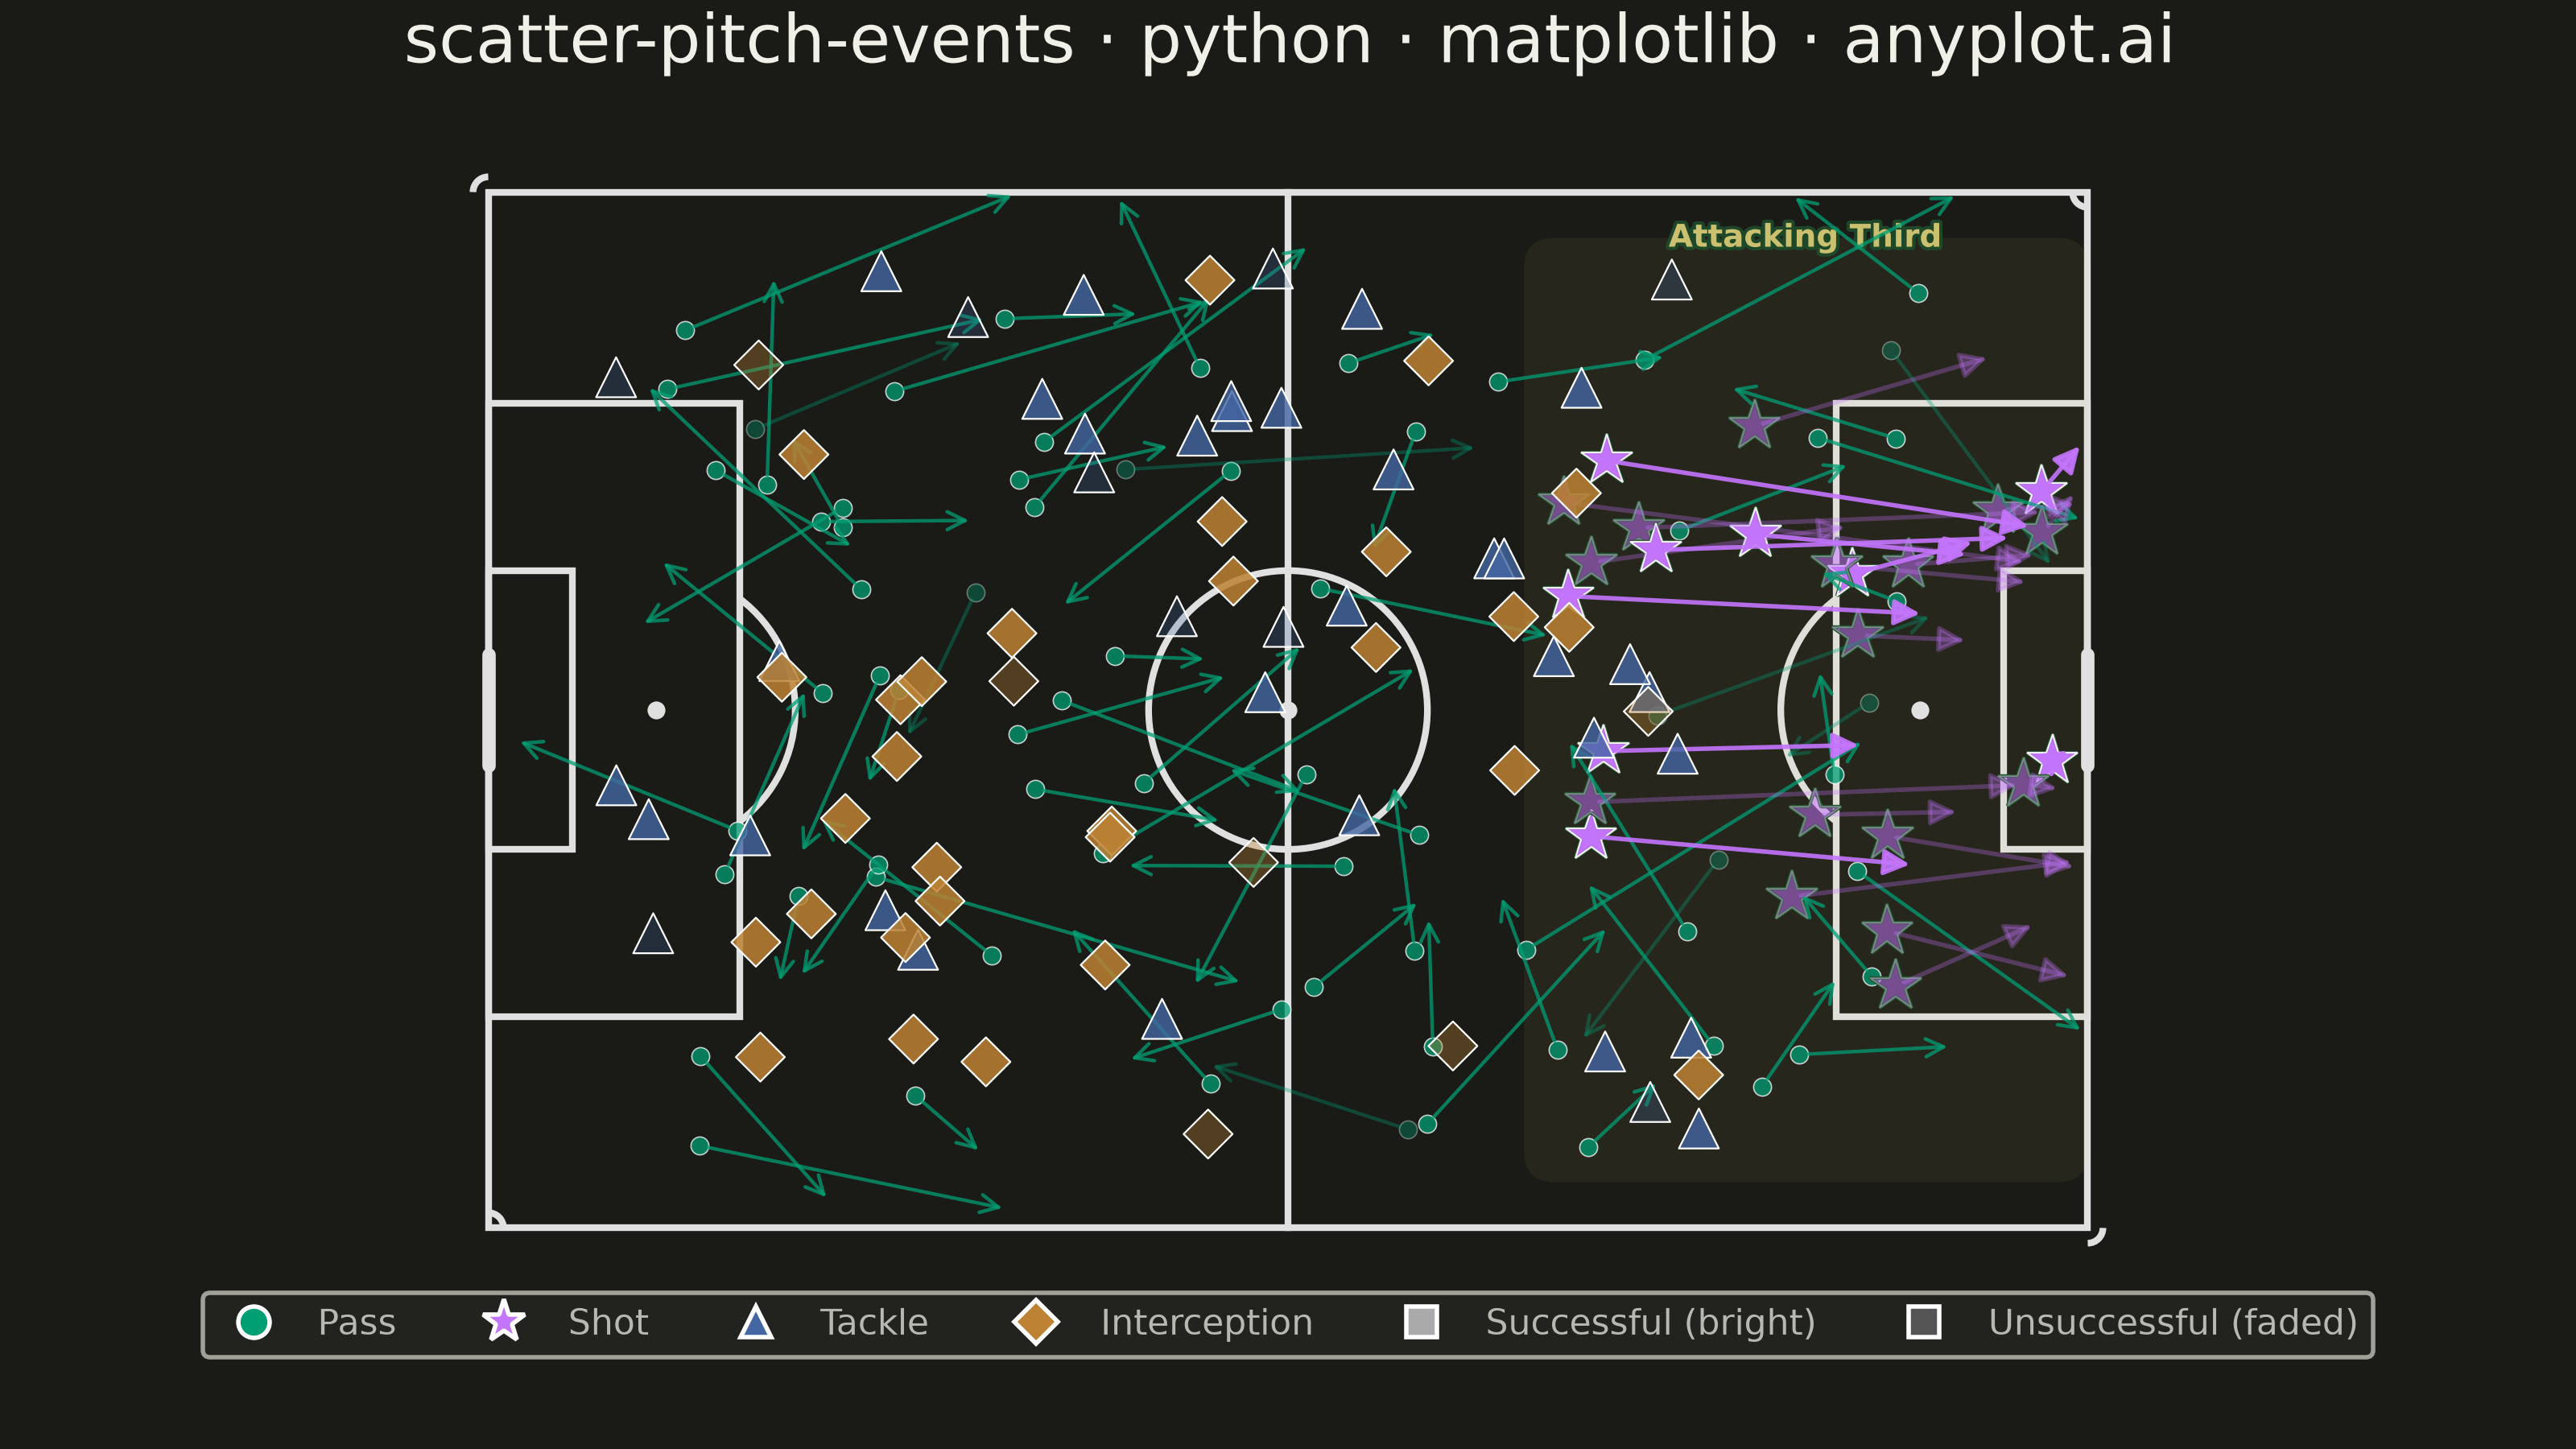
A soccer pitch event map positions match events (passes, shots, tackles, interceptions) as markers on an accurately scaled football pitch diagram. The pitch is drawn with standard markings including penalty areas, center circle, goal areas, and halfway line. Each event type uses distinct markers and colors, with directional arrows for passes and shots. This visualization is essential for tactical match analysis, scouting, and coaching in football analytics.
""" anyplot.ai
scatter-pitch-events: Soccer Pitch Event Map
Library: matplotlib 3.11.0 | Python 3.13.14
Quality: 89/100 | Updated: 2026-06-21
"""

import os
import sys


# Prevent this script's filename from shadowing the installed matplotlib package
sys.path = [p for p in sys.path if os.path.abspath(p) != os.path.dirname(os.path.abspath(__file__))]

import matplotlib.patches as patches
import matplotlib.patheffects as pe
import matplotlib.pyplot as plt
import numpy as np
from matplotlib.colors import to_rgba


# Theme tokens
THEME = os.getenv("ANYPLOT_THEME", "light")
PAGE_BG = "#FAF8F1" if THEME == "light" else "#1A1A17"
ELEVATED_BG = "#FFFDF6" if THEME == "light" else "#242420"
INK = "#1A1A17" if THEME == "light" else "#F0EFE8"
INK_SOFT = "#4A4A44" if THEME == "light" else "#B8B7B0"

# Imprint palette — positions 1→4 for the 4 event types
IMPRINT_PALETTE = ["#009E73", "#C475FD", "#4467A3", "#BD8233", "#AE3030", "#2ABCCD", "#954477", "#99B314"]
ANYPLOT_AMBER = "#DDCC77"  # warning / caution semantic anchor

c_pass = IMPRINT_PALETTE[0]  # brand green — passes
c_shot = IMPRINT_PALETTE[1]  # lavender — shots
c_tackle = IMPRINT_PALETTE[2]  # blue — tackles
c_intercept = IMPRINT_PALETTE[3]  # ochre — interceptions

# Pitch-specific surface colors (not chrome — the pitch is the data canvas)
PITCH_BG = "#3a7d44" if THEME == "light" else "#1e4d2b"
PITCH_LINE = "#FAF8F1" if THEME == "light" else "#e0e0e0"

# Data
np.random.seed(42)

n_passes = 70
n_shots = 25
n_tackles = 40
n_interceptions = 35

pass_x = np.random.uniform(10, 95, n_passes)
pass_y = np.random.uniform(5, 63, n_passes)
pass_dx = np.random.uniform(-15, 25, n_passes)
pass_dy = np.random.uniform(-15, 15, n_passes)
pass_end_x = np.clip(pass_x + pass_dx, 0, 105)
pass_end_y = np.clip(pass_y + pass_dy, 0, 68)
pass_success = np.random.choice([True, False], n_passes, p=[0.78, 0.22])

shot_x = np.random.uniform(70, 104, n_shots)
shot_y = np.random.uniform(15, 53, n_shots)
shot_dx = np.clip(105 - shot_x, 1, 35) * np.random.uniform(0.5, 1.0, n_shots)
shot_dy = (34 - shot_y) * np.random.uniform(-0.3, 0.3, n_shots)
shot_success = np.random.choice([True, False], n_shots, p=[0.35, 0.65])

tackle_x = np.random.uniform(5, 80, n_tackles)
tackle_y = np.random.uniform(5, 63, n_tackles)
tackle_success = np.random.choice([True, False], n_tackles, p=[0.65, 0.35])

intercept_x = np.random.uniform(15, 85, n_interceptions)
intercept_y = np.random.uniform(5, 63, n_interceptions)
intercept_success = np.random.choice([True, False], n_interceptions, p=[0.80, 0.20])

# Plot — figsize=(8, 4.5) dpi=400 → exactly 3200 × 1800 px
fig, ax = plt.subplots(figsize=(8, 4.5), dpi=400, facecolor=PAGE_BG)
ax.set_facecolor(PITCH_BG)

# Pitch outline and markings (FIFA standard: 105m × 68m)
lw = 1.5

ax.add_patch(patches.Rectangle((0, 0), 105, 68, linewidth=lw, edgecolor=PITCH_LINE, facecolor="none"))
ax.plot([52.5, 52.5], [0, 68], color=PITCH_LINE, linewidth=lw)
ax.add_patch(patches.Circle((52.5, 34), 9.15, linewidth=lw, edgecolor=PITCH_LINE, facecolor="none"))
ax.plot(52.5, 34, "o", color=PITCH_LINE, markersize=3)

# Left penalty area
ax.add_patch(patches.Rectangle((0, 13.84), 16.5, 40.32, linewidth=lw, edgecolor=PITCH_LINE, facecolor="none"))
ax.add_patch(patches.Rectangle((0, 24.84), 5.5, 18.32, linewidth=lw, edgecolor=PITCH_LINE, facecolor="none"))
ax.plot(11, 34, "o", color=PITCH_LINE, markersize=3)
ax.add_patch(patches.Arc((11, 34), 18.3, 18.3, angle=0, theta1=-53, theta2=53, color=PITCH_LINE, linewidth=lw))

# Right penalty area
ax.add_patch(patches.Rectangle((88.5, 13.84), 16.5, 40.32, linewidth=lw, edgecolor=PITCH_LINE, facecolor="none"))
ax.add_patch(patches.Rectangle((99.5, 24.84), 5.5, 18.32, linewidth=lw, edgecolor=PITCH_LINE, facecolor="none"))
ax.plot(94, 34, "o", color=PITCH_LINE, markersize=3)
ax.add_patch(patches.Arc((94, 34), 18.3, 18.3, angle=0, theta1=127, theta2=233, color=PITCH_LINE, linewidth=lw))

# Corner arcs
for cx, cy in [(0, 0), (0, 68), (105, 0), (105, 68)]:
    t1 = 0 if cx == 0 and cy == 0 else (270 if cx == 105 and cy == 0 else (90 if cx == 0 and cy == 68 else 180))
    ax.add_patch(patches.Arc((cx, cy), 2, 2, angle=0, theta1=t1, theta2=t1 + 90, color=PITCH_LINE, linewidth=lw))

# Goals
ax.plot([0, 0], [30.34, 37.66], color=PITCH_LINE, linewidth=3, solid_capstyle="round")
ax.plot([105, 105], [30.34, 37.66], color=PITCH_LINE, linewidth=3, solid_capstyle="round")

# Attacking zone highlight (right third) — tactical storytelling focal point
zone_highlight = patches.FancyBboxPatch(
    (70, 5), 33, 58, boxstyle="round,pad=2", facecolor=ANYPLOT_AMBER, alpha=0.07, edgecolor="none", zorder=1
)
ax.add_patch(zone_highlight)
ax.text(
    86.5,
    66,
    "Attacking Third",
    fontsize=7,
    color=ANYPLOT_AMBER,
    alpha=0.9,
    ha="center",
    va="top",
    fontweight="bold",
    path_effects=[pe.withStroke(linewidth=1.5, foreground=PITCH_BG)],
)

# Events - passes (arrows with origin markers)
for i in range(n_passes):
    alpha = 0.75 if pass_success[i] else 0.35
    ax.annotate(
        "",
        xy=(pass_end_x[i], pass_end_y[i]),
        xytext=(pass_x[i], pass_y[i]),
        arrowprops={"arrowstyle": "->", "color": c_pass, "lw": 0.8, "alpha": alpha},
    )
    ax.plot(
        pass_x[i], pass_y[i], "o", color=c_pass, markersize=4, alpha=alpha, markeredgecolor="white", markeredgewidth=0.3
    )

# Events - shots (bold arrows with star markers)
for i in range(n_shots):
    alpha = 0.9 if shot_success[i] else 0.3
    ax.annotate(
        "",
        xy=(shot_x[i] + shot_dx[i], shot_y[i] + shot_dy[i]),
        xytext=(shot_x[i], shot_y[i]),
        arrowprops={"arrowstyle": "-|>", "color": c_shot, "lw": 1.0, "alpha": alpha, "mutation_scale": 12},
    )
    ax.plot(
        shot_x[i],
        shot_y[i],
        "*",
        color=c_shot,
        markersize=12,
        alpha=alpha,
        markeredgecolor="white",
        markeredgewidth=0.4,
        path_effects=[pe.withStroke(linewidth=0.8, foreground=PITCH_BG)],
    )

# Events - tackles (triangles) — vectorized with per-point alpha
tackle_rgba = np.array([to_rgba(c_tackle, a) for a in np.where(tackle_success, 0.8, 0.25)])
ax.scatter(tackle_x, tackle_y, marker="^", s=80, c=tackle_rgba, edgecolors="white", linewidth=0.4, zorder=5)

# Events - interceptions (diamonds) — vectorized with per-point alpha
intercept_rgba = np.array([to_rgba(c_intercept, a) for a in np.where(intercept_success, 0.85, 0.35)])
ax.scatter(intercept_x, intercept_y, marker="D", s=60, c=intercept_rgba, edgecolors="white", linewidth=0.4, zorder=5)

# Axes
ax.set_xlim(-3, 108)
ax.set_ylim(-5, 73)
ax.set_aspect("equal")
ax.axis("off")

# Title — 55 chars, within 67-char baseline so fontsize stays at 12pt
title = "scatter-pitch-events · python · matplotlib · anyplot.ai"
title_fontsize = max(8, round(12 * (67 / len(title))))
ax.set_title(
    title,
    fontsize=title_fontsize,
    fontweight="medium",
    color=INK,
    pad=12,
    path_effects=[pe.withStroke(linewidth=2, foreground=PAGE_BG)],
)

# Legend
legend_elements = [
    plt.Line2D([0], [0], marker="o", color="w", markerfacecolor=c_pass, markersize=7, label="Pass", linestyle="None"),
    plt.Line2D([0], [0], marker="*", color="w", markerfacecolor=c_shot, markersize=10, label="Shot", linestyle="None"),
    plt.Line2D(
        [0], [0], marker="^", color="w", markerfacecolor=c_tackle, markersize=7, label="Tackle", linestyle="None"
    ),
    plt.Line2D(
        [0],
        [0],
        marker="D",
        color="w",
        markerfacecolor=c_intercept,
        markersize=7,
        label="Interception",
        linestyle="None",
    ),
    plt.Line2D(
        [0],
        [0],
        marker="s",
        color="w",
        markerfacecolor="#aaaaaa",
        markersize=7,
        label="Successful (bright)",
        linestyle="None",
    ),
    plt.Line2D(
        [0],
        [0],
        marker="s",
        color="w",
        markerfacecolor="#555555",
        markersize=7,
        label="Unsuccessful (faded)",
        linestyle="None",
    ),
]
leg = ax.legend(
    handles=legend_elements,
    loc="lower center",
    ncol=6,
    fontsize=8,
    framealpha=0.85,
    facecolor=ELEVATED_BG,
    edgecolor=INK_SOFT,
    labelcolor=INK_SOFT,
    bbox_to_anchor=(0.5, -0.06),
)

# Save — no bbox_inches to preserve exact 3200×1800 canvas
fig.subplots_adjust(top=0.92, bottom=0.10, left=0.02, right=0.98)
plt.savefig(f"plot-{THEME}.png", dpi=400, facecolor=PAGE_BG)
plt.close()
Runnable source as JSON, for any HTTP client: https://api.anyplot.ai/specs/scatter-pitch-events/matplotlib/code. Any spec id and library id listed in llms-full.txt fit the same URL shape; every URL below is complete and callable.
{
  "spec_id": "scatter-pitch-events",
  "language": "python",
  "library": "matplotlib",
  "page": "https://anyplot.ai/scatter-pitch-events/python/matplotlib",
  "hub": "https://anyplot.ai/scatter-pitch-events",
  "code_json": "https://api.anyplot.ai/specs/scatter-pitch-events/matplotlib/code",
  "spec_json": "https://api.anyplot.ai/specs/scatter-pitch-events",
  "render_light_png": "https://storage.googleapis.com/anyplot-images/plots/scatter-pitch-events/python/matplotlib/plot-light.png",
  "render_dark_png": "https://storage.googleapis.com/anyplot-images/plots/scatter-pitch-events/python/matplotlib/plot-dark.png",
  "quality_score": 89.0,
  "license": "MIT",
  "guide": "https://anyplot.ai/llms.txt"
}
Part of Soccer Pitch Event Map on anyplot.ai.