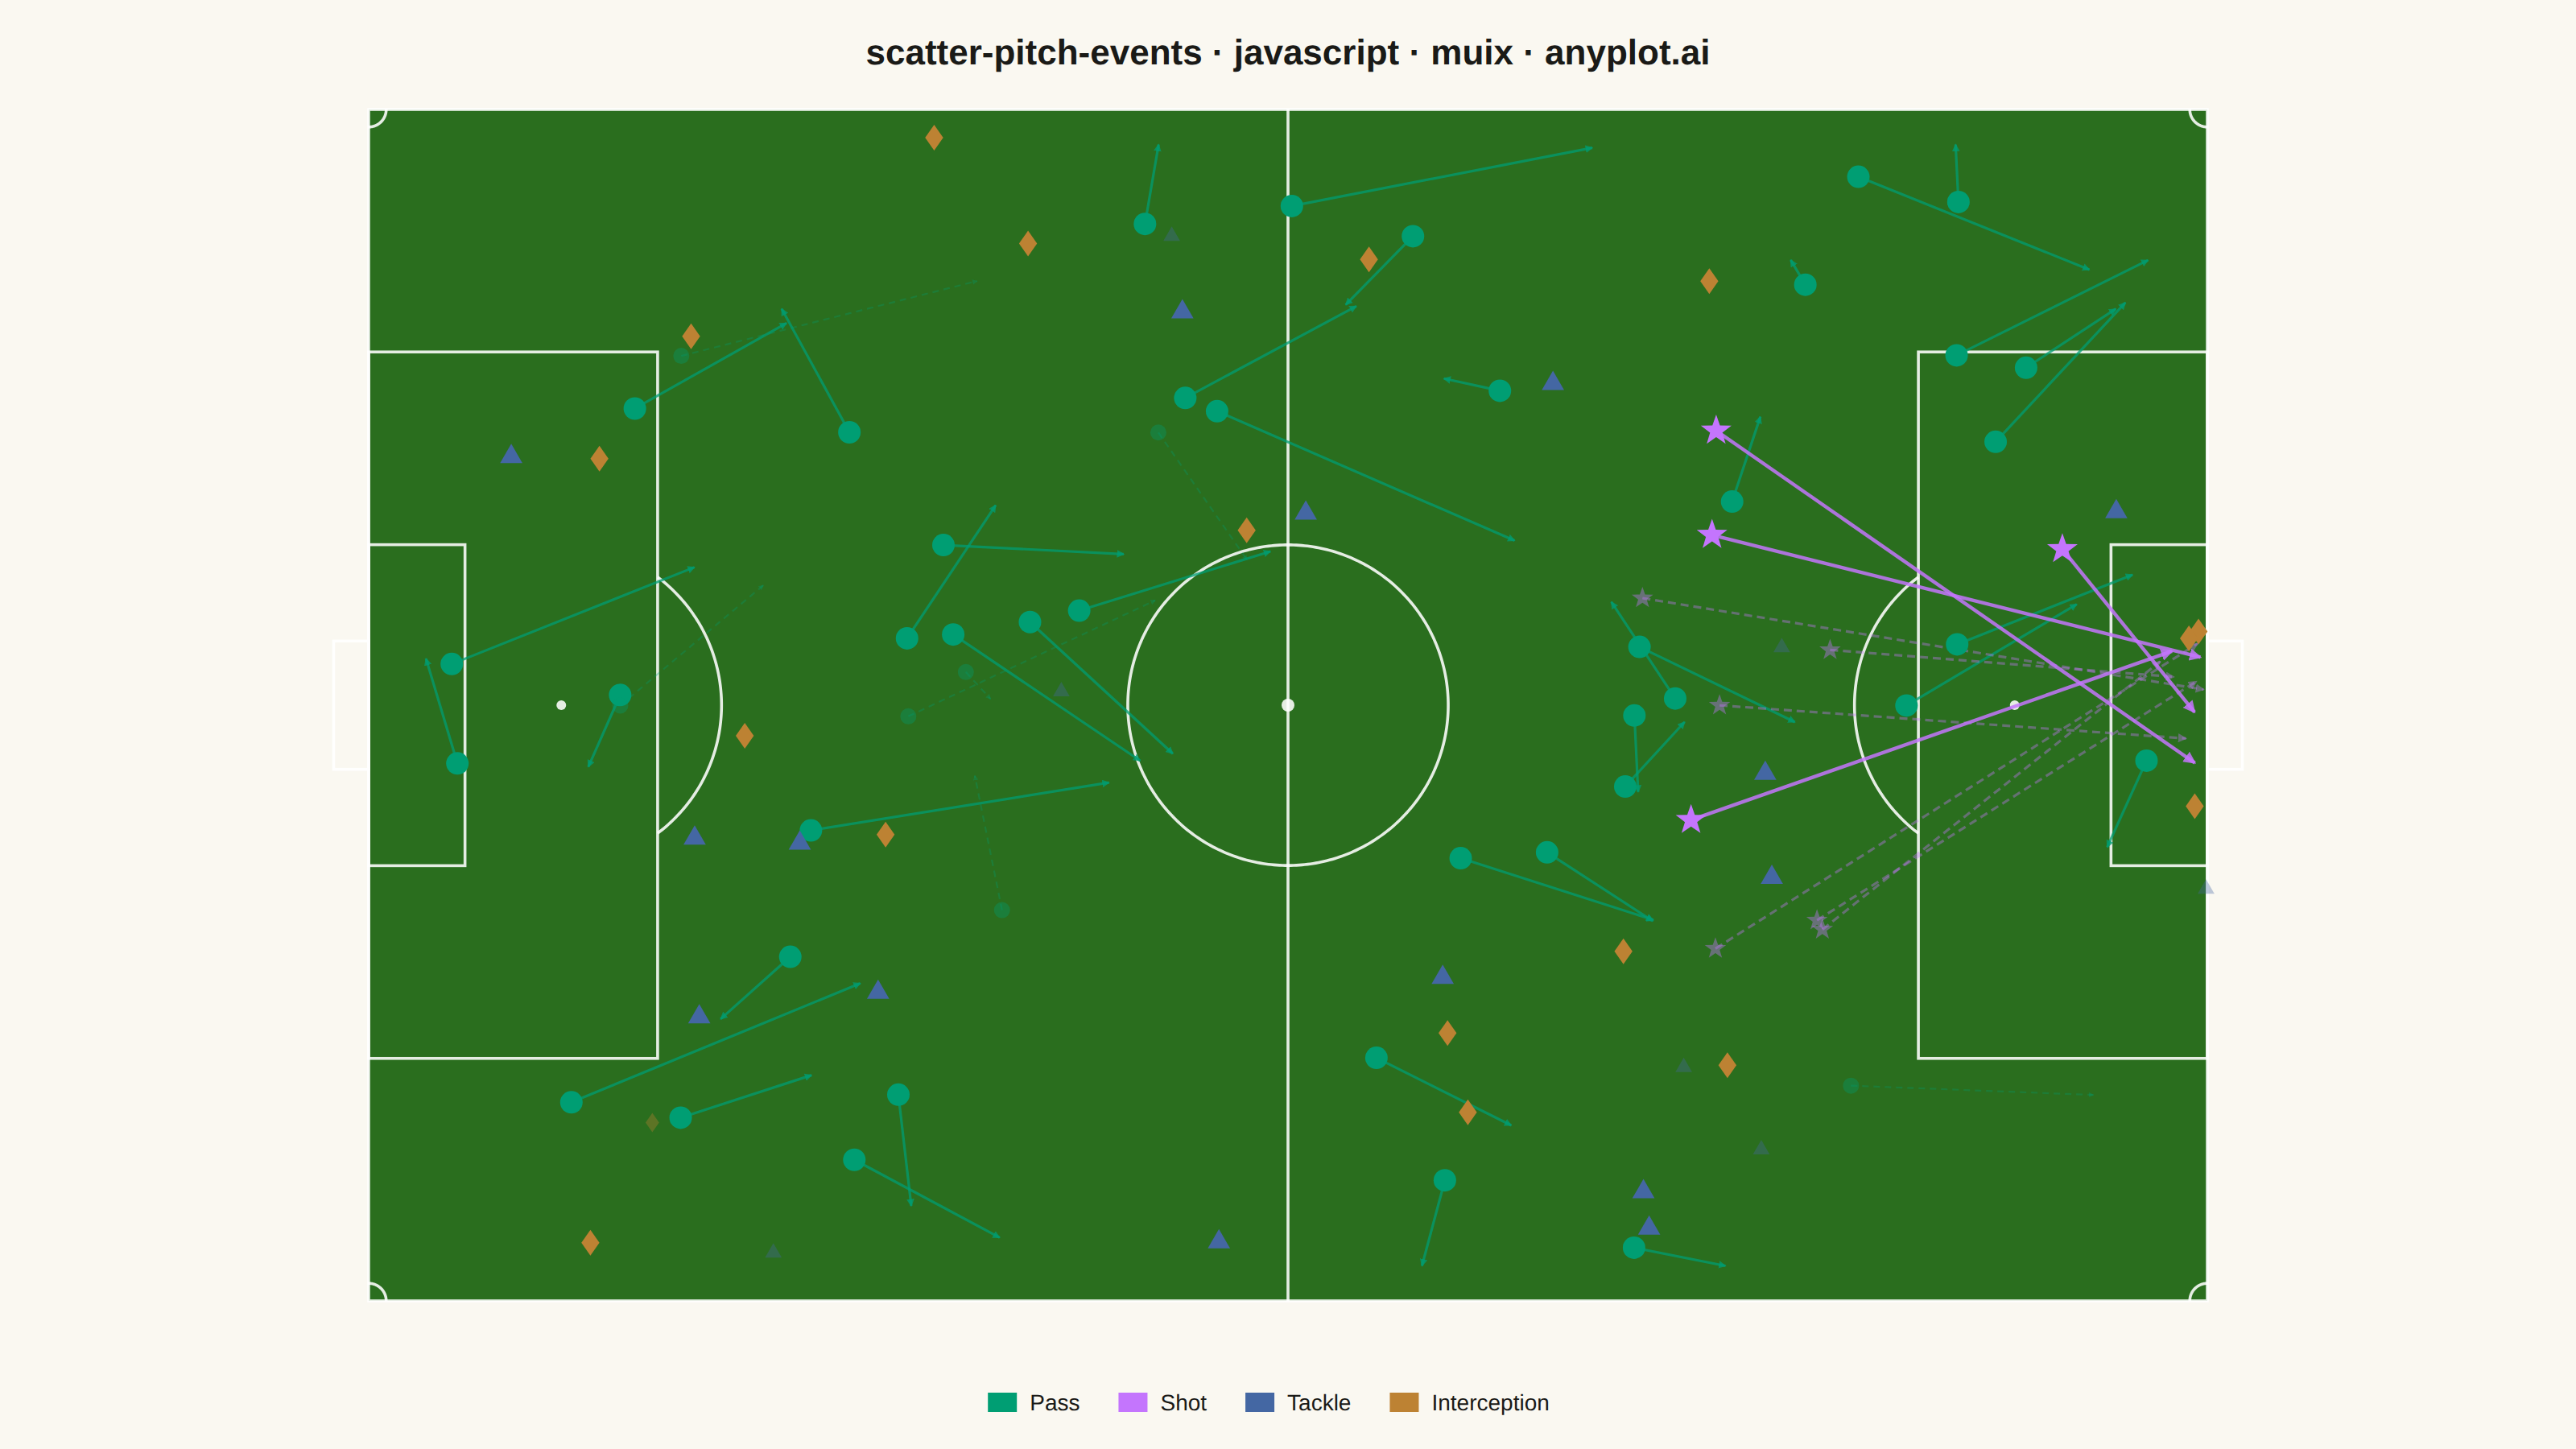
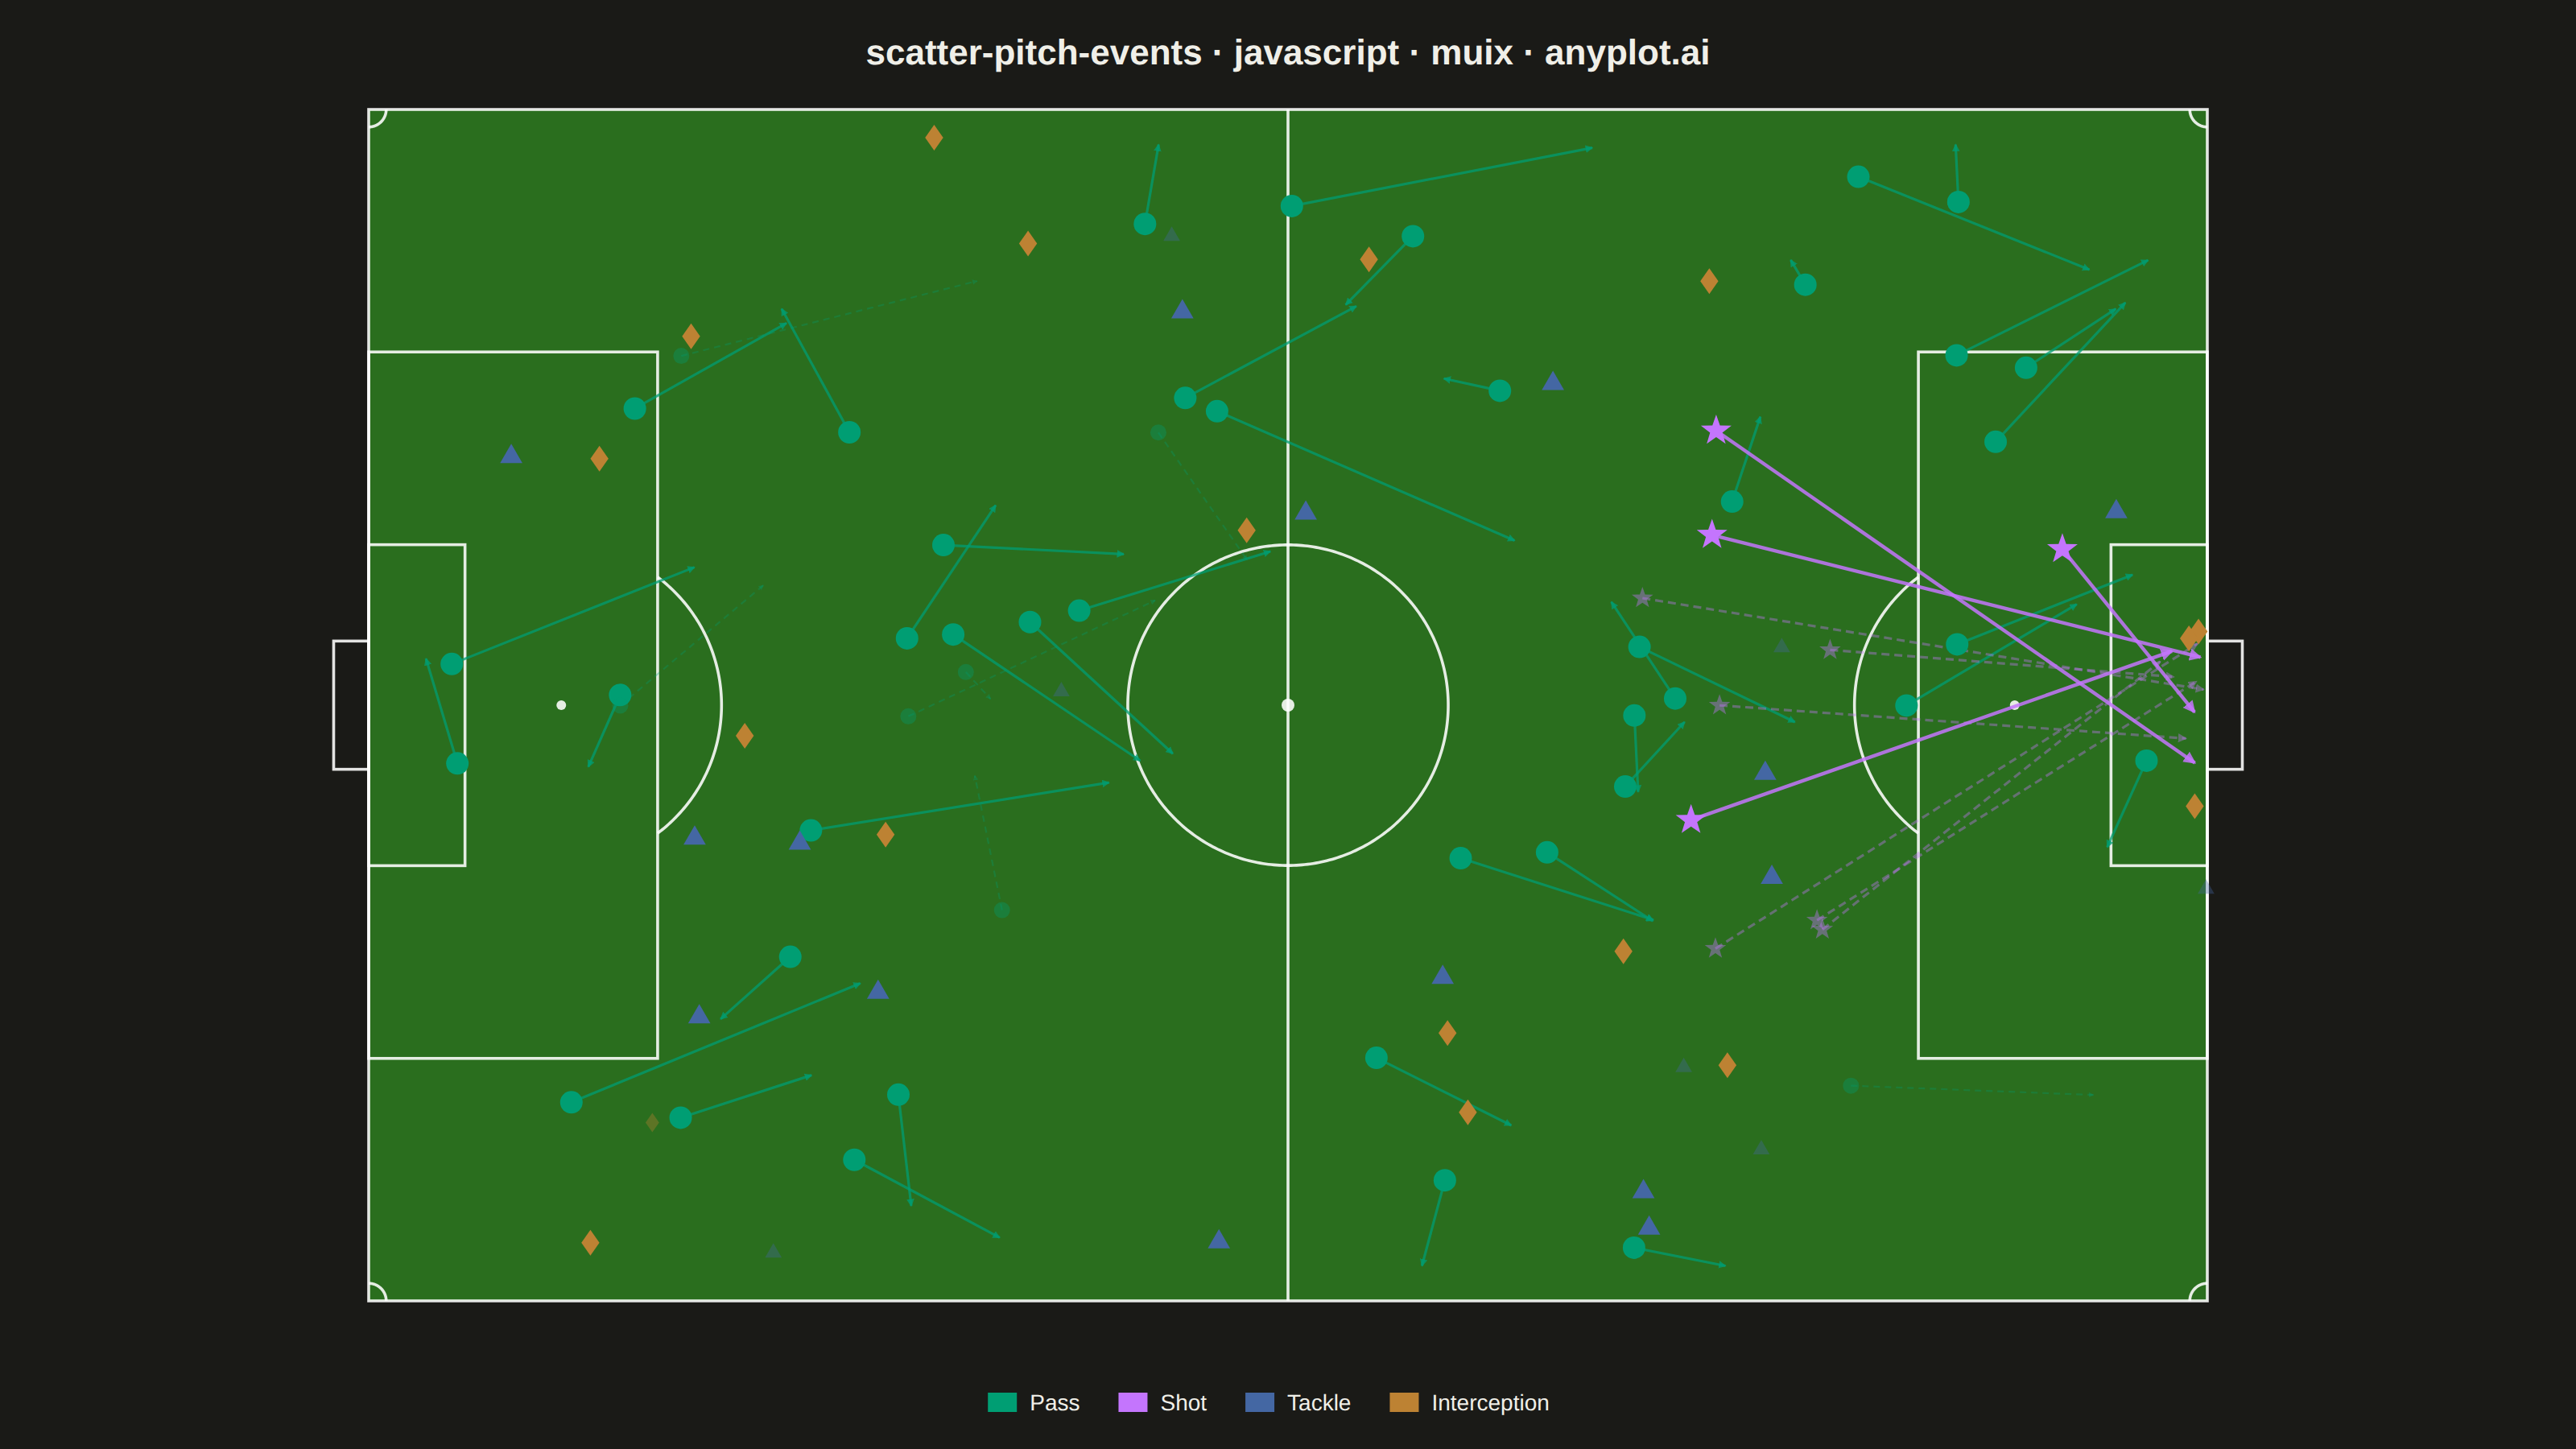
The same plot in 14 other libraries — JavaScript: Chart.js, D3.js, Apache ECharts, Highcharts; Python: Altair, Bokeh, lets-plot, Matplotlib, Plotly, plotnine, Pygal, Seaborn; R: ggplot2; Julia: Makie.jl. Compare all 15 side by side: Soccer Pitch Event Map in Python, R, Julia and JavaScript.
A soccer pitch event map positions match events (passes, shots, tackles, interceptions) as markers on an accurately scaled football pitch diagram. The pitch is drawn with standard markings including penalty areas, center circle, goal areas, and halfway line. Each event type uses distinct markers and colors, with directional arrows for passes and shots. This visualization is essential for tactical match analysis, scouting, and coaching in football analytics.
// anyplot.ai
// scatter-pitch-events: Soccer Pitch Event Map
// Library: muix 7.29.1 | JavaScript 22.22.3
// Quality: 87/100 | Created: 2026-06-21

import { ChartContainer } from "@mui/x-charts/ChartContainer";
import { ChartsLegend } from "@mui/x-charts/ChartsLegend";
import { useDrawingArea, useXScale, useYScale } from "@mui/x-charts/hooks";

const t = window.ANYPLOT_TOKENS;

// --- Imprint palette for event types ---
const PASS_COLOR = t.palette[0];      // #009E73 brand green
const SHOT_COLOR = t.palette[1];      // #C475FD lavender
const TACKLE_COLOR = t.palette[2];    // #4467A3 blue
const INTERCEPT_COLOR = t.palette[3]; // #BD8233 ochre

function hexToRgba(hex, alpha) {
  const r = parseInt(hex.slice(1, 3), 16);
  const g = parseInt(hex.slice(3, 5), 16);
  const b = parseInt(hex.slice(5, 7), 16);
  return `rgba(${r},${g},${b},${alpha})`;
}

// --- Deterministic seeded RNG (LCG) ---
function makeLcg(seed) {
  let s = seed >>> 0;
  return () => {
    s = (Math.imul(1664525, s) + 1013904223) >>> 0;
    return s / 4294967296;
  };
}

const rng = makeLcg(42);

// --- Synthetic match event data ---
// Passes: start + end coords for directional arrows
const passes = Array.from({ length: 48 }, (_, i) => {
  const x = rng() * 100 + 2.5;
  const y = rng() * 63 + 2.5;
  const dx = (rng() - 0.2) * 22;
  const dy = (rng() - 0.5) * 16;
  const x2 = Math.max(2, Math.min(103, x + dx));
  const y2 = Math.max(2, Math.min(66, y + dy));
  const successful = rng() > 0.22;
  return { id: `pass-${i}`, x, y, x2, y2, successful };
});

// Shots: from attacking half toward goal at x=105
const shots = Array.from({ length: 10 }, (_, i) => {
  const x = 70 + rng() * 30;
  const y = 17 + rng() * 34;
  const x2 = 102 + rng() * 3;
  const y2 = 30.34 + rng() * 7.32;
  const successful = rng() > 0.75;
  return { id: `shot-${i}`, x, y, x2, y2, successful };
});

// Tackles: spread across the pitch
const tackles = Array.from({ length: 22 }, (_, i) => {
  const x = rng() * 105;
  const y = rng() * 68;
  const successful = rng() > 0.35;
  return { id: `tackle-${i}`, x, y, successful };
});

// Interceptions: midfield-heavy
const interceptions = Array.from({ length: 18 }, (_, i) => {
  const x = rng() * 105;
  const y = rng() * 68;
  const successful = rng() > 0.12;
  return { id: `intercept-${i}`, x, y, successful };
});

// --- MUI X scatter series (for legend and domain — markers drawn in EventMarkersLayer) ---
const scatterSeries = [
  {
    type: "scatter", id: "pass-series", label: "Pass",
    data: passes.map(p => ({ x: p.x, y: p.y, id: p.id })),
    color: PASS_COLOR,
  },
  {
    type: "scatter", id: "shot-series", label: "Shot",
    data: shots.map(s => ({ x: s.x, y: s.y, id: s.id })),
    color: SHOT_COLOR,
  },
  {
    type: "scatter", id: "tackle-series", label: "Tackle",
    data: tackles.map(tk => ({ x: tk.x, y: tk.y, id: tk.id })),
    color: TACKLE_COLOR,
  },
  {
    type: "scatter", id: "intercept-series", label: "Interception",
    data: interceptions.map(ic => ({ x: ic.x, y: ic.y, id: ic.id })),
    color: INTERCEPT_COLOR,
  },
];

// --- Pitch constants ---
const PITCH_GREEN = "#2a6e1e";
const LINE_W = "rgba(255,255,255,0.88)";
const LW = 1.8;
const DEG = Math.PI / 180;

// Parametric arc → polyline points string (pitch coords → SVG via scale fns)
function pitchArc(cx, cy, r, aFrom, aTo, X, Y) {
  const steps = Math.ceil(Math.abs(aTo - aFrom));
  const pts = [];
  for (let i = 0; i <= steps; i++) {
    const a = (aFrom + ((aTo - aFrom) * i) / steps) * DEG;
    pts.push(`${X(cx + r * Math.cos(a))},${Y(cy + r * Math.sin(a))}`);
  }
  return pts.join(" ");
}

// SVG shape helpers (cx/cy/r in SVG pixel space)
function starPoints(cx, cy, r) {
  const inner = r * 0.4;
  const pts = [];
  for (let i = 0; i < 10; i++) {
    const angle = (i * Math.PI) / 5 - Math.PI / 2;
    const rad = i % 2 === 0 ? r : inner;
    pts.push(`${cx + rad * Math.cos(angle)},${cy + rad * Math.sin(angle)}`);
  }
  return pts.join(" ");
}

function trianglePoints(cx, cy, r) {
  const top = `${cx},${cy - r}`;
  const bl = `${cx - r * 0.866},${cy + r * 0.5}`;
  const br = `${cx + r * 0.866},${cy + r * 0.5}`;
  return `${top} ${bl} ${br}`;
}

function diamondPoints(cx, cy, r) {
  return `${cx},${cy - r} ${cx + r * 0.7},${cy} ${cx},${cy + r} ${cx - r * 0.7},${cy}`;
}

// --- Custom SVG layer: pitch markings ---
function PitchBackground() {
  const { left, top, width, height } = useDrawingArea();
  const xScale = useXScale();
  const yScale = useYScale();
  const X = (m) => xScale(m);
  const Y = (m) => yScale(m);

  // FIFA standard pitch dimensions (meters)
  const circleR = 9.15;
  const penDepth = 16.5;
  const penHW = 20.16; // half-width of penalty area (40.32/2)
  const goalDepth = 5.5;
  const goalHW = 9.16; // half-width of goal area (18.32/2)
  const goalHalfWidth = 3.66; // half-width of goal mouth (7.32/2)
  const goalDepthPx = X(2) - X(0); // 2m goal depth shown as visual post

  // Penalty arcs: only the portion outside the penalty area
  const leftPenArc = (() => {
    const pts = [];
    for (let a = -60; a <= 60; a++) {
      const px = 11 + circleR * Math.cos(a * DEG);
      const py = 34 + circleR * Math.sin(a * DEG);
      if (px > penDepth) pts.push(`${X(px)},${Y(py)}`);
    }
    return pts.join(" ");
  })();

  const rightPenArc = (() => {
    const pts = [];
    for (let a = 120; a <= 240; a++) {
      const px = 94 + circleR * Math.cos(a * DEG);
      const py = 34 + circleR * Math.sin(a * DEG);
      if (px < 105 - penDepth) pts.push(`${X(px)},${Y(py)}`);
    }
    return pts.join(" ");
  })();

  // Helper: rectangle from pitch coords
  const R = (x1, y1, x2, y2) => ({
    x: X(Math.min(x1, x2)),
    y: Y(Math.max(y1, y2)),
    w: Math.abs(X(x2) - X(x1)),
    h: Math.abs(Y(y2) - Y(y1)),
  });

  const lp = { fill: "none", stroke: LINE_W, strokeWidth: LW };

  return (
    <g>
      {/* Pitch grass */}
      <rect x={left} y={top} width={width} height={height} fill={PITCH_GREEN} />

      {/* Pitch outline */}
      {(() => { const r = R(0, 0, 105, 68); return <rect {...lp} x={r.x} y={r.y} width={r.w} height={r.h} />; })()}

      {/* Halfway line */}
      <line {...lp} x1={X(52.5)} y1={Y(0)} x2={X(52.5)} y2={Y(68)} />

      {/* Center circle */}
      <polyline {...lp} points={pitchArc(52.5, 34, circleR, 0, 360, X, Y)} />

      {/* Center spot */}
      <circle cx={X(52.5)} cy={Y(34)} r={4} fill={LINE_W} />

      {/* Left penalty area */}
      {(() => { const r = R(0, 34 - penHW, penDepth, 34 + penHW); return <rect {...lp} x={r.x} y={r.y} width={r.w} height={r.h} />; })()}

      {/* Right penalty area */}
      {(() => { const r = R(105 - penDepth, 34 - penHW, 105, 34 + penHW); return <rect {...lp} x={r.x} y={r.y} width={r.w} height={r.h} />; })()}

      {/* Left goal area */}
      {(() => { const r = R(0, 34 - goalHW, goalDepth, 34 + goalHW); return <rect {...lp} x={r.x} y={r.y} width={r.w} height={r.h} />; })()}

      {/* Right goal area */}
      {(() => { const r = R(105 - goalDepth, 34 - goalHW, 105, 34 + goalHW); return <rect {...lp} x={r.x} y={r.y} width={r.w} height={r.h} />; })()}

      {/* Left goal (extends outside pitch) */}
      <rect
        x={X(0) - goalDepthPx} y={Y(34 + goalHalfWidth)}
        width={goalDepthPx} height={Math.abs(Y(34 - goalHalfWidth) - Y(34 + goalHalfWidth))}
        fill="none" stroke={LINE_W} strokeWidth={LW}
      />

      {/* Right goal (extends outside pitch) */}
      <rect
        x={X(105)} y={Y(34 + goalHalfWidth)}
        width={goalDepthPx} height={Math.abs(Y(34 - goalHalfWidth) - Y(34 + goalHalfWidth))}
        fill="none" stroke={LINE_W} strokeWidth={LW}
      />

      {/* Penalty spots */}
      <circle cx={X(11)} cy={Y(34)} r={3} fill={LINE_W} />
      <circle cx={X(94)} cy={Y(34)} r={3} fill={LINE_W} />

      {/* Penalty arcs (portions visible outside penalty areas) */}
      {leftPenArc && <polyline {...lp} points={leftPenArc} />}
      {rightPenArc && <polyline {...lp} points={rightPenArc} />}

      {/* Corner arcs (radius 1m from each corner) */}
      <polyline {...lp} points={pitchArc(0, 0, 1, 0, 90, X, Y)} />
      <polyline {...lp} points={pitchArc(105, 0, 1, 90, 180, X, Y)} />
      <polyline {...lp} points={pitchArc(0, 68, 1, -90, 0, X, Y)} />
      <polyline {...lp} points={pitchArc(105, 68, 1, 180, 270, X, Y)} />
    </g>
  );
}

// --- Custom SVG layer: directional arrows for passes and shots ---
function ArrowsLayer() {
  const xScale = useXScale();
  const yScale = useYScale();
  const X = (m) => xScale(m);
  const Y = (m) => yScale(m);

  const passOk = hexToRgba(PASS_COLOR, 0.75);
  const passFail = hexToRgba(PASS_COLOR, 0.3);
  const shotOk = hexToRgba(SHOT_COLOR, 0.85);
  const shotFail = hexToRgba(SHOT_COLOR, 0.38);

  return (
    <g>
      <defs>
        <marker id="arr-pass-ok" viewBox="0 0 8 8" refX="7" refY="4"
                markerWidth="3" markerHeight="3" orient="auto">
          <path d="M 0 0 L 8 4 L 0 8 z" fill={passOk} />
        </marker>
        <marker id="arr-pass-fail" viewBox="0 0 8 8" refX="7" refY="4"
                markerWidth="3" markerHeight="3" orient="auto">
          <path d="M 0 0 L 8 4 L 0 8 z" fill={passFail} />
        </marker>
        <marker id="arr-shot-ok" viewBox="0 0 8 8" refX="7" refY="4"
                markerWidth="3.5" markerHeight="3.5" orient="auto">
          <path d="M 0 0 L 8 4 L 0 8 z" fill={shotOk} />
        </marker>
        <marker id="arr-shot-fail" viewBox="0 0 8 8" refX="7" refY="4"
                markerWidth="3.5" markerHeight="3.5" orient="auto">
          <path d="M 0 0 L 8 4 L 0 8 z" fill={shotFail} />
        </marker>
      </defs>

      {/* Pass trajectories */}
      {passes.map(p => (
        <line
          key={p.id}
          x1={X(p.x)} y1={Y(p.y)} x2={X(p.x2)} y2={Y(p.y2)}
          stroke={p.successful ? passOk : passFail}
          strokeWidth={p.successful ? 1.6 : 1.1}
          strokeDasharray={p.successful ? undefined : "4,3"}
          markerEnd={p.successful ? "url(#arr-pass-ok)" : "url(#arr-pass-fail)"}
        />
      ))}

      {/* Shot trajectories */}
      {shots.map(s => (
        <line
          key={s.id}
          x1={X(s.x)} y1={Y(s.y)} x2={X(s.x2)} y2={Y(s.y2)}
          stroke={s.successful ? shotOk : shotFail}
          strokeWidth={s.successful ? 2.2 : 1.6}
          strokeDasharray={s.successful ? undefined : "5,3"}
          markerEnd={s.successful ? "url(#arr-shot-ok)" : "url(#arr-shot-fail)"}
        />
      ))}
    </g>
  );
}

// --- Custom SVG layer: distinct marker shapes per event type ---
// Passes=circles, Shots=stars, Tackles=triangles, Interceptions=diamonds
function EventMarkersLayer() {
  const xScale = useXScale();
  const yScale = useYScale();
  const X = (m) => xScale(m);
  const Y = (m) => yScale(m);

  return (
    <g>
      {/* Passes: circles */}
      {passes.map(p => {
        const cx = X(p.x), cy = Y(p.y);
        const r = p.successful ? 7 : 5;
        const fill = p.successful ? PASS_COLOR : hexToRgba(PASS_COLOR, 0.35);
        return <circle key={p.id} cx={cx} cy={cy} r={r} fill={fill} />;
      })}

      {/* Shots: 5-pointed stars */}
      {shots.map(s => {
        const cx = X(s.x), cy = Y(s.y);
        const r = s.successful ? 10 : 7;
        const fill = s.successful ? SHOT_COLOR : hexToRgba(SHOT_COLOR, 0.4);
        return <polygon key={s.id} points={starPoints(cx, cy, r)} fill={fill} />;
      })}

      {/* Tackles: upward-pointing triangles */}
      {tackles.map(tk => {
        const cx = X(tk.x), cy = Y(tk.y);
        const r = tk.successful ? 8 : 6;
        const fill = tk.successful ? TACKLE_COLOR : hexToRgba(TACKLE_COLOR, 0.35);
        return <polygon key={tk.id} points={trianglePoints(cx, cy, r)} fill={fill} />;
      })}

      {/* Interceptions: diamonds */}
      {interceptions.map(ic => {
        const cx = X(ic.x), cy = Y(ic.y);
        const r = ic.successful ? 8 : 6;
        const fill = ic.successful ? INTERCEPT_COLOR : hexToRgba(INTERCEPT_COLOR, 0.35);
        return <polygon key={ic.id} points={diamondPoints(cx, cy, r)} fill={fill} />;
      })}
    </g>
  );
}

// --- Root chart component ---
export default function Chart() {
  const { width, height } = window.ANYPLOT_SIZE;

  // Margins computed to maintain the FIFA 105:68 pitch aspect ratio
  const topM = 68;
  const botM = 92;
  const pitchH = height - topM - botM;
  const pitchW = Math.round(pitchH * (105 / 68));
  const hM = Math.round((width - pitchW) / 2);
  const margin = { top: topM, bottom: botM, left: hM, right: hM };

  const TITLE = "scatter-pitch-events · javascript · muix · anyplot.ai";
  const titleSize = Math.round(22 * Math.min(1, 67 / TITLE.length));

  return (
    <ChartContainer
      width={width}
      height={height}
      margin={margin}
      xAxis={[{ id: "x", min: 0, max: 105, scaleType: "linear", disableTicks: true }]}
      yAxis={[{ id: "y", min: 0, max: 68, scaleType: "linear", disableTicks: true }]}
      series={scatterSeries}
      skipAnimation
    >
      {/* 1. Pitch background and markings */}
      <PitchBackground />

      {/* 2. Directional arrows (below markers) */}
      <ArrowsLayer />

      {/* 3. Event markers — circles/stars/triangles/diamonds per event type */}
      <EventMarkersLayer />

      {/* 4. Legend — row layout, centered below pitch */}
      <ChartsLegend
        position={{ horizontal: "middle", vertical: "bottom" }}
        direction="row"
        itemMarkWidth={18}
        itemMarkHeight={12}
        markGap={8}
        itemGap={24}
        labelStyle={{ fontSize: 14, fill: t.ink }}
      />

      {/* 5. Title */}
      <text
        x={width / 2}
        y={topM / 2}
        textAnchor="middle"
        dominantBaseline="middle"
        fontSize={titleSize}
        fontWeight="600"
        fill={t.ink}
        fontFamily='-apple-system, BlinkMacSystemFont, "Segoe UI", Roboto, sans-serif'
      >
        {TITLE}
      </text>
    </ChartContainer>
  );
}
Runnable source as JSON, for any HTTP client: https://api.anyplot.ai/specs/scatter-pitch-events/muix/code. Any spec id and library id listed in llms-full.txt fit the same URL shape; every URL below is complete and callable.
{
  "spec_id": "scatter-pitch-events",
  "language": "javascript",
  "library": "muix",
  "page": "https://anyplot.ai/scatter-pitch-events/javascript/muix",
  "hub": "https://anyplot.ai/scatter-pitch-events",
  "code_json": "https://api.anyplot.ai/specs/scatter-pitch-events/muix/code",
  "spec_json": "https://api.anyplot.ai/specs/scatter-pitch-events",
  "render_light_png": "https://storage.googleapis.com/anyplot-images/plots/scatter-pitch-events/javascript/muix/plot-light.png",
  "render_dark_png": "https://storage.googleapis.com/anyplot-images/plots/scatter-pitch-events/javascript/muix/plot-dark.png",
  "interactive_light_html": "https://storage.googleapis.com/anyplot-images/plots/scatter-pitch-events/javascript/muix/plot-light.html",
  "interactive_dark_html": "https://storage.googleapis.com/anyplot-images/plots/scatter-pitch-events/javascript/muix/plot-dark.html",
  "quality_score": 87.0,
  "license": "MIT",
  "guide": "https://anyplot.ai/llms.txt"
}
Part of Soccer Pitch Event Map on anyplot.ai.