The same plot in 14 other libraries — Python: Altair, Bokeh, lets-plot, Matplotlib, Plotly, plotnine, Pygal, Seaborn; Julia: Makie.jl; JavaScript: Chart.js, D3.js, Apache ECharts, Highcharts, MUI X Charts. Compare all 15 side by side: Soccer Pitch Event Map in Python, R, Julia and JavaScript.
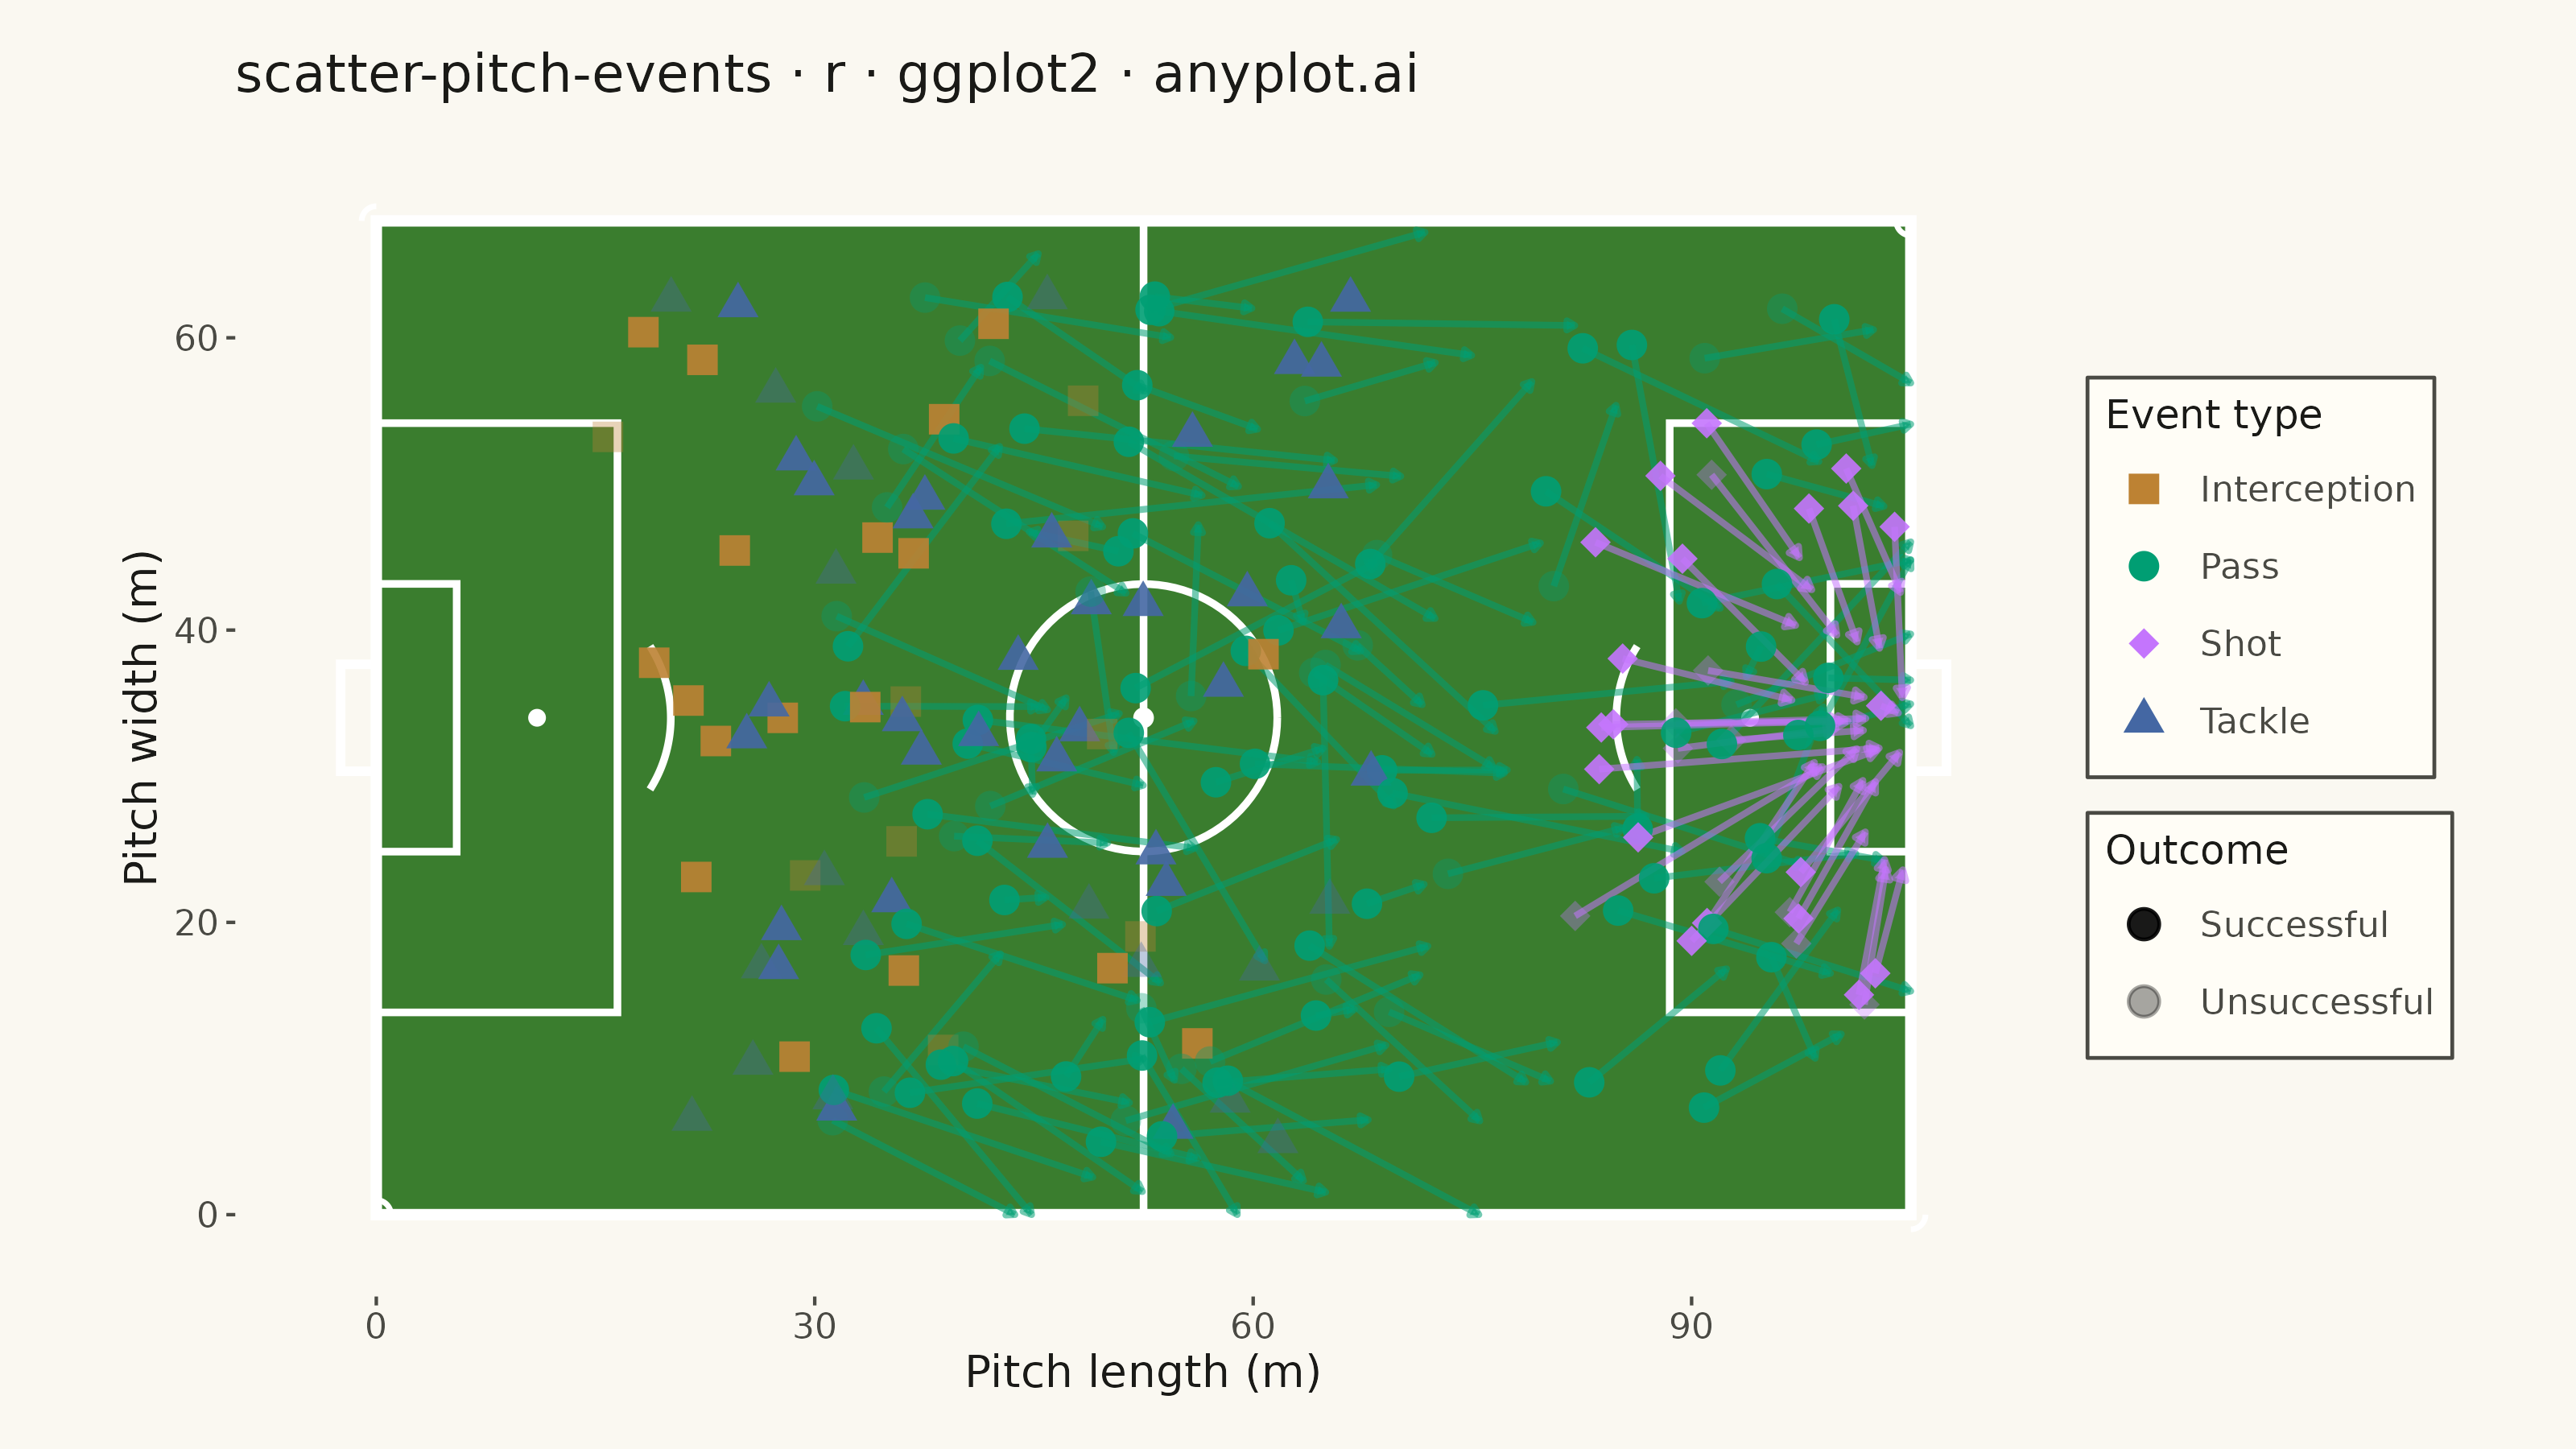
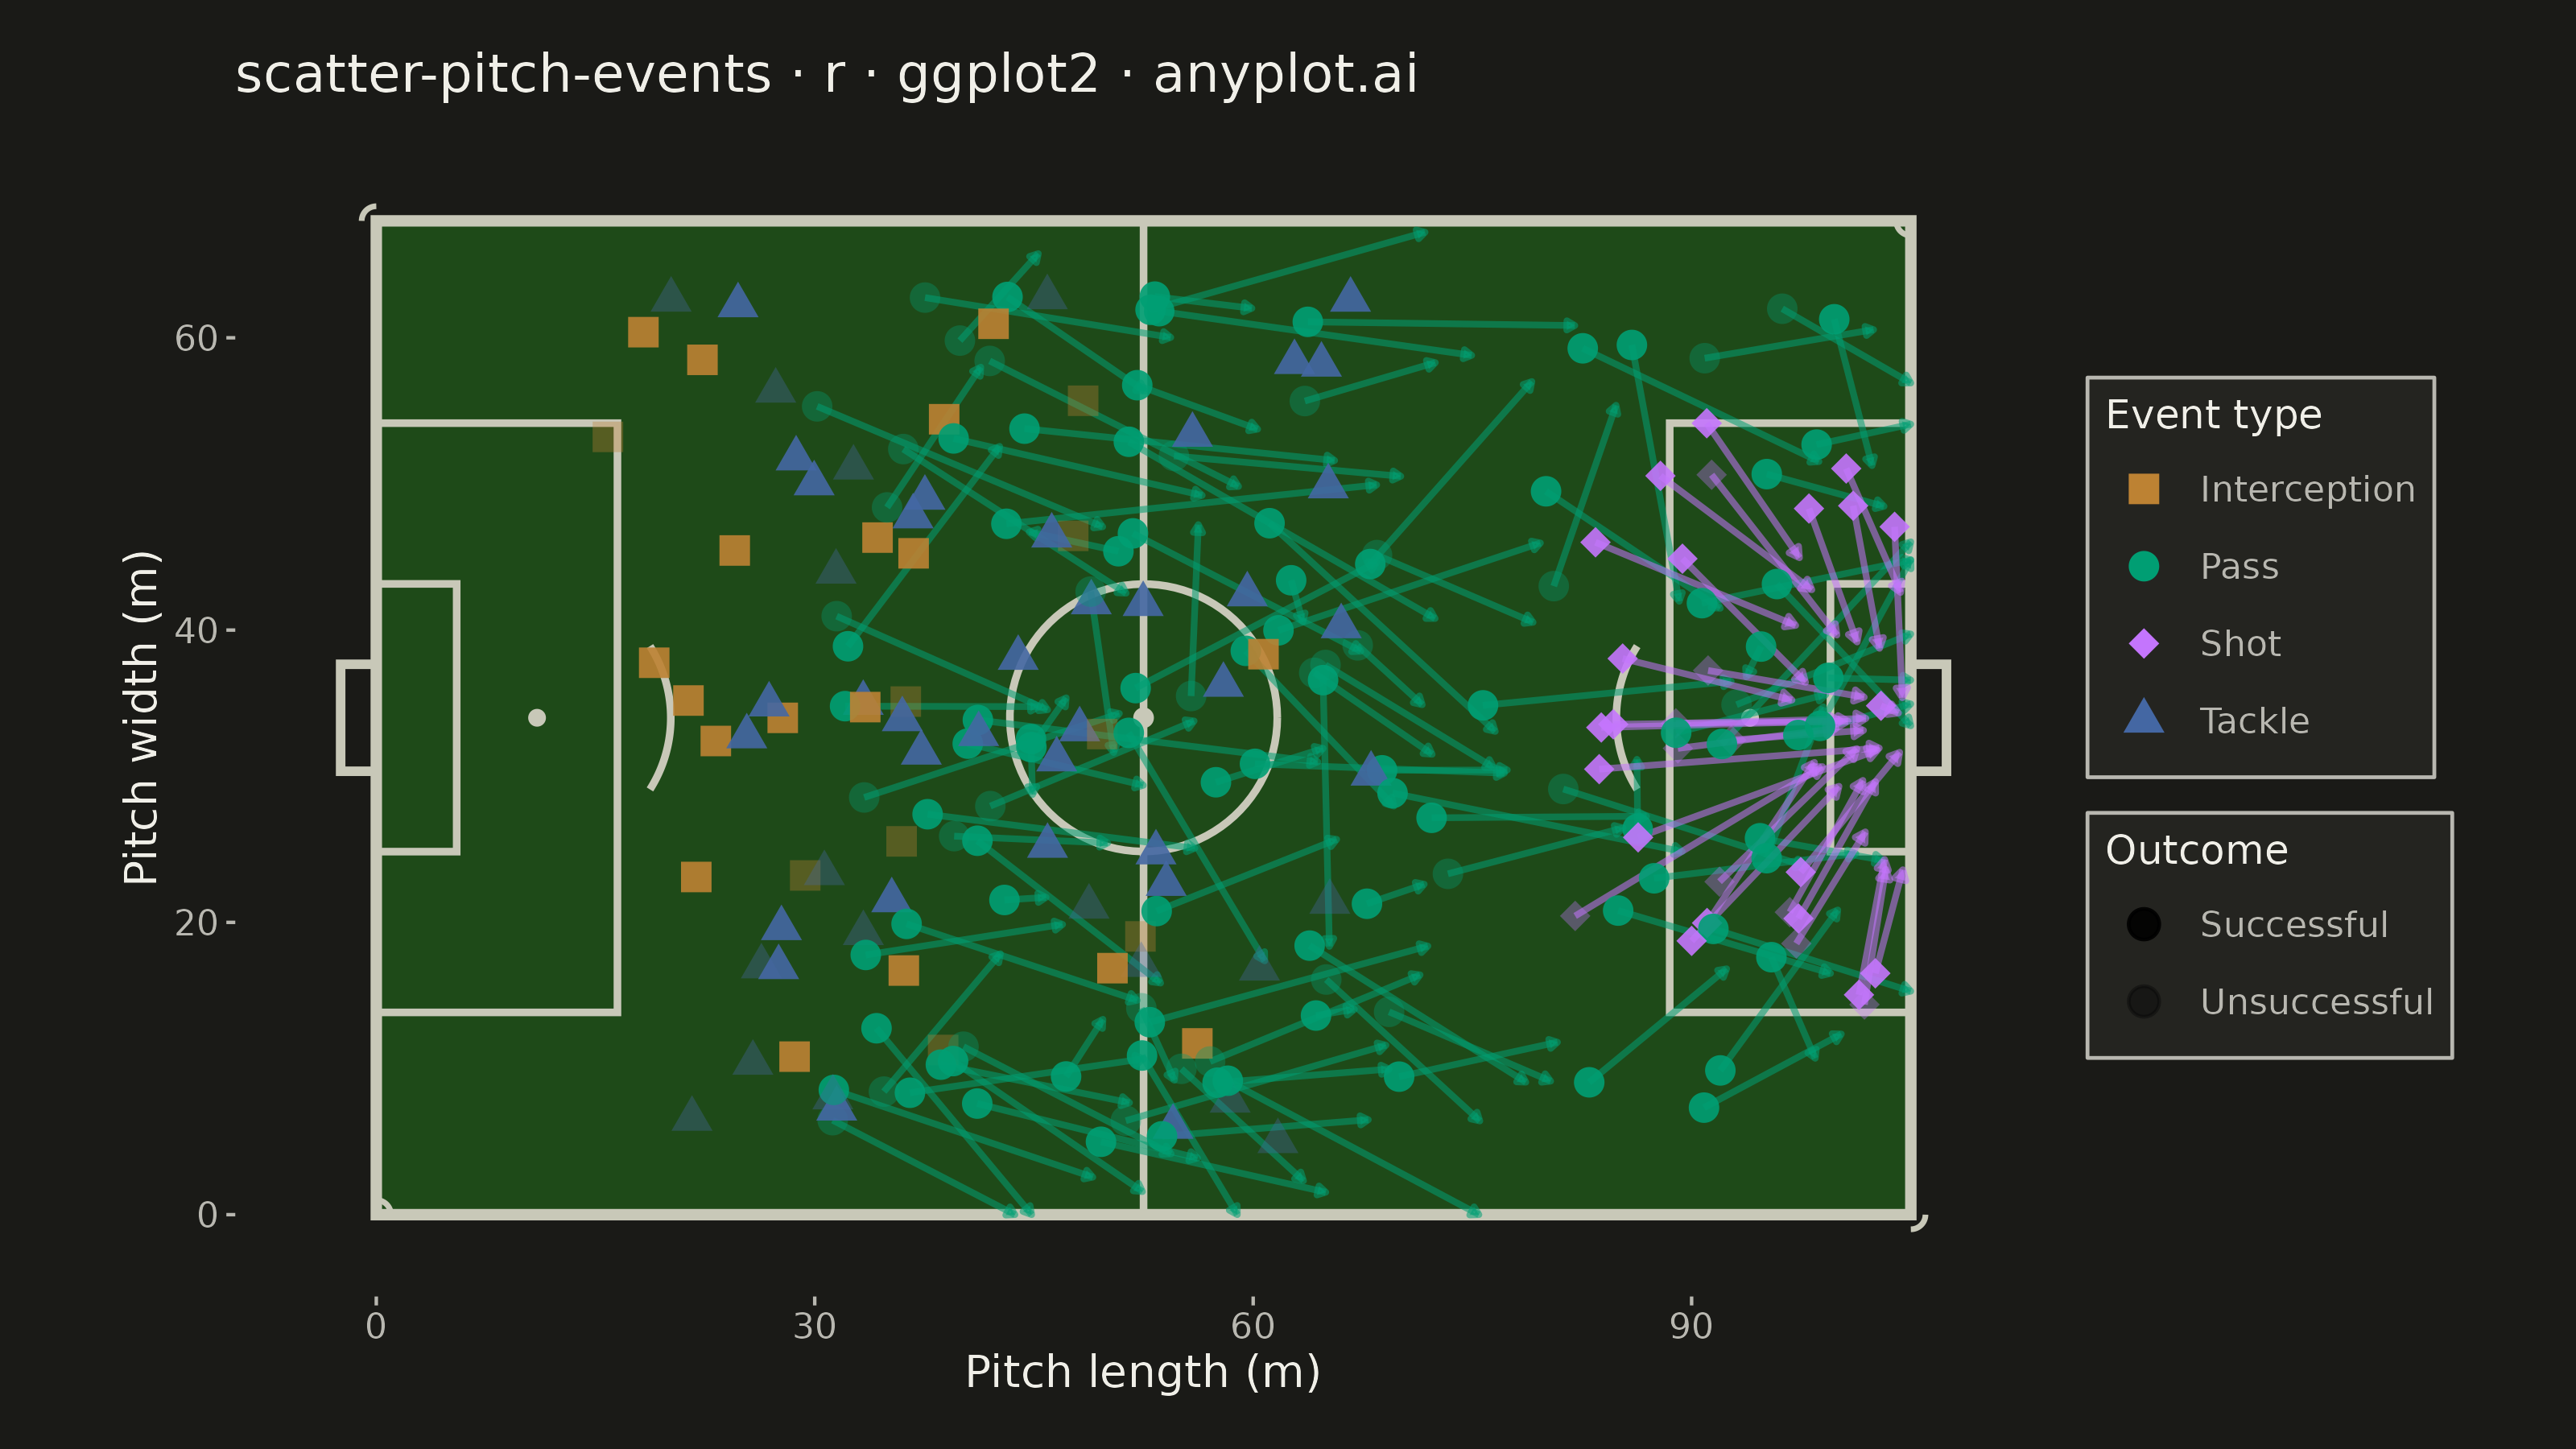
A soccer pitch event map positions match events (passes, shots, tackles, interceptions) as markers on an accurately scaled football pitch diagram. The pitch is drawn with standard markings including penalty areas, center circle, goal areas, and halfway line. Each event type uses distinct markers and colors, with directional arrows for passes and shots. This visualization is essential for tactical match analysis, scouting, and coaching in football analytics.
#' anyplot.ai
#' scatter-pitch-events: Soccer Pitch Event Map
#' Library: ggplot2 3.5.1 | R 4.4.1
#' Quality: 90/100 | Created: 2026-06-21

library(ggplot2)
library(ragg)

set.seed(42)

# Theme tokens
THEME       <- Sys.getenv("ANYPLOT_THEME", "light")
PAGE_BG     <- if (THEME == "light") "#FAF8F1" else "#1A1A17"
ELEVATED_BG <- if (THEME == "light") "#FFFDF6" else "#242420"
INK         <- if (THEME == "light") "#1A1A17" else "#F0EFE8"
INK_SOFT    <- if (THEME == "light") "#4A4A44" else "#B8B7B0"

# Imprint palette — canonical order
IMPRINT_PALETTE <- c(
  "#009E73",  # 1 — brand green (passes)
  "#C475FD",  # 2 — lavender (shots)
  "#4467A3",  # 3 — blue (tackles)
  "#BD8233"   # 4 — ochre (interceptions)
)

# Pitch fill: green for light, muted dark-green for dark theme
PITCH_FILL  <- if (THEME == "light") "#3a7d2e" else "#1e4a18"
PITCH_LINE  <- if (THEME == "light") "#FFFFFF" else "#C8C8B8"

# Data — synthetic match event data (first half attacking build-up)
n_events <- 220

# Generate events distributed across pitch zones with realistic patterns
event_types <- c("pass", "shot", "tackle", "interception")
event_probs <- c(0.55, 0.12, 0.20, 0.13)

events <- data.frame(
  event_type = sample(event_types, n_events, replace = TRUE, prob = event_probs)
)

# Passes cluster in midfield and wide areas
pass_idx  <- which(events$event_type == "pass")
shot_idx  <- which(events$event_type == "shot")
tack_idx  <- which(events$event_type == "tackle")
inter_idx <- which(events$event_type == "interception")

events$x <- NA_real_
events$y <- NA_real_

# Passes — spread across attacking two-thirds
events$x[pass_idx]  <- runif(length(pass_idx), 30, 100)
events$y[pass_idx]  <- runif(length(pass_idx), 4, 64)

# Shots — concentrated in attacking box (x: 82–105, y: 13–55)
events$x[shot_idx]  <- runif(length(shot_idx), 82, 105)
events$y[shot_idx]  <- runif(length(shot_idx), 13, 55)

# Tackles — midfield and defensive third
events$x[tack_idx]  <- runif(length(tack_idx), 20, 70)
events$y[tack_idx]  <- runif(length(tack_idx), 5, 63)

# Interceptions — defensive and middle thirds
events$x[inter_idx] <- runif(length(inter_idx), 10, 65)
events$y[inter_idx] <- runif(length(inter_idx), 5, 63)

# Outcome: passes/shots ~70% successful; tackles/interceptions ~60% successful
events$outcome <- ifelse(
  events$event_type %in% c("pass", "shot"),
  sample(c("successful", "unsuccessful"), n_events, replace = TRUE,
         prob = c(0.70, 0.30)),
  sample(c("successful", "unsuccessful"), n_events, replace = TRUE,
         prob = c(0.60, 0.40))
)

# Pass arrows — subset of passes with destination
pass_df <- events[pass_idx, ]
pass_df$xend <- pmin(pass_df$x + rnorm(length(pass_idx), 12, 6), 105)
pass_df$yend <- pass_df$y   + rnorm(length(pass_idx), 0,  8)
pass_df$yend <- pmax(pmin(pass_df$yend, 68), 0)

# Shot arrows — toward goal centre (105, 34)
shot_df <- events[shot_idx, ]
shot_df$xend <- shot_df$x + (105 - shot_df$x) * runif(length(shot_idx), 0.4, 0.9)
shot_df$yend <- shot_df$y + (34  - shot_df$y) * runif(length(shot_idx), 0.4, 0.9)

# Pitch geometry helpers
# Penalty area: 16.5m deep, 40.32m wide centred on goal (y = 34)
PA_X1 <- 88.5; PA_X2 <- 105
PA_Y1 <- 13.84; PA_Y2 <- 54.16
# Goal area: 5.5m deep, 18.32m wide
GA_X1 <- 99.5; GA_X2 <- 105
GA_Y1 <- 24.84; GA_Y2 <- 43.16
# Opp penalty area (left)
OPA_X1 <- 0; OPA_X2 <- 16.5
OPA_Y1 <- 13.84; OPA_Y2 <- 54.16
OGA_X1 <- 0; OGA_X2 <- 5.5
OGA_Y1 <- 24.84; OGA_Y2 <- 43.16

title_str <- "scatter-pitch-events · r · ggplot2 · anyplot.ai"

p <- ggplot() +
  # --- Pitch background ---
  annotate("rect", xmin = 0, xmax = 105, ymin = 0, ymax = 68,
           fill = PITCH_FILL, color = PITCH_LINE, linewidth = 1.2) +
  # Halfway line
  annotate("segment", x = 52.5, xend = 52.5, y = 0, yend = 68,
           color = PITCH_LINE, linewidth = 0.8) +
  # Centre circle (radius 9.15m)
  annotate("path",
           x = 52.5 + 9.15 * cos(seq(0, 2 * pi, length.out = 100)),
           y = 34   + 9.15 * sin(seq(0, 2 * pi, length.out = 100)),
           color = PITCH_LINE, linewidth = 0.8) +
  # Centre spot
  annotate("point", x = 52.5, y = 34, color = PITCH_LINE, size = 1.5) +
  # Right penalty area
  annotate("rect", xmin = PA_X1, xmax = PA_X2,
           ymin = PA_Y1, ymax = PA_Y2,
           fill = NA, color = PITCH_LINE, linewidth = 0.8) +
  # Right goal area
  annotate("rect", xmin = GA_X1, xmax = GA_X2,
           ymin = GA_Y1, ymax = GA_Y2,
           fill = NA, color = PITCH_LINE, linewidth = 0.8) +
  # Left penalty area
  annotate("rect", xmin = OPA_X1, xmax = OPA_X2,
           ymin = OPA_Y1, ymax = OPA_Y2,
           fill = NA, color = PITCH_LINE, linewidth = 0.8) +
  # Left goal area
  annotate("rect", xmin = OGA_X1, xmax = OGA_X2,
           ymin = OGA_Y1, ymax = OGA_Y2,
           fill = NA, color = PITCH_LINE, linewidth = 0.8) +
  # Right penalty spot (11m from goal line)
  annotate("point", x = 94, y = 34, color = PITCH_LINE, size = 1.2) +
  # Left penalty spot
  annotate("point", x = 11, y = 34, color = PITCH_LINE, size = 1.2) +
  # Right penalty arc (partial circle outside box, radius 9.15m from spot)
  {
    arc_angles <- seq(pi * 0.82, pi * 1.18, length.out = 60)
    annotate("path",
             x = 94 + 9.15 * cos(arc_angles),
             y = 34 + 9.15 * sin(arc_angles),
             color = PITCH_LINE, linewidth = 0.8)
  } +
  # Left penalty arc
  {
    arc_angles_l <- seq(-pi * 0.18, pi * 0.18, length.out = 60)
    annotate("path",
             x = 11 + 9.15 * cos(arc_angles_l),
             y = 34 + 9.15 * sin(arc_angles_l),
             color = PITCH_LINE, linewidth = 0.8)
  } +
  # Corner arcs (radius 1m)
  {
    ca1 <- seq(0, pi / 2, length.out = 30)
    ca2 <- seq(pi / 2, pi,     length.out = 30)
    ca3 <- seq(pi, 3 * pi / 2, length.out = 30)
    ca4 <- seq(3 * pi / 2, 2 * pi, length.out = 30)
    list(
      annotate("path", x = 0   + cos(ca1), y = 0  + sin(ca1), color = PITCH_LINE, linewidth = 0.6),
      annotate("path", x = 0   + cos(ca2), y = 68 + sin(ca2), color = PITCH_LINE, linewidth = 0.6),
      annotate("path", x = 105 + cos(ca3), y = 68 + sin(ca3), color = PITCH_LINE, linewidth = 0.6),
      annotate("path", x = 105 + cos(ca4), y = 0  + sin(ca4), color = PITCH_LINE, linewidth = 0.6)
    )
  } +
  # Goals (2.44m post-to-post depth outside pitch)
  annotate("rect", xmin = 105, xmax = 107.44,
           ymin = 30.34, ymax = 37.66,
           fill = NA, color = PITCH_LINE, linewidth = 1.0) +
  annotate("rect", xmin = -2.44, xmax = 0,
           ymin = 30.34, ymax = 37.66,
           fill = NA, color = PITCH_LINE, linewidth = 1.0) +

  # --- Pass arrows ---
  geom_segment(
    data = pass_df,
    aes(x = x, y = y, xend = xend, yend = yend),
    arrow = arrow(length = unit(0.008, "npc"), type = "closed"),
    color = IMPRINT_PALETTE[1], alpha = 0.55, linewidth = 0.7
  ) +

  # --- Shot arrows ---
  geom_segment(
    data = shot_df,
    aes(x = x, y = y, xend = xend, yend = yend),
    arrow = arrow(length = unit(0.010, "npc"), type = "closed"),
    color = IMPRINT_PALETTE[2], alpha = 0.55, linewidth = 0.7
  ) +

  # --- Event markers ---
  geom_point(
    data = events,
    aes(x = x, y = y,
        color = event_type,
        shape = event_type,
        alpha = outcome),
    size = 2.8,
    stroke = 0.6
  ) +

  scale_color_manual(
    name   = "Event type",
    values = c(
      "pass"          = IMPRINT_PALETTE[1],
      "shot"          = IMPRINT_PALETTE[2],
      "tackle"        = IMPRINT_PALETTE[3],
      "interception"  = IMPRINT_PALETTE[4]
    ),
    labels = c("pass" = "Pass", "shot" = "Shot",
               "tackle" = "Tackle", "interception" = "Interception")
  ) +
  scale_shape_manual(
    name   = "Event type",
    values = c(
      "pass"          = 16,  # circle
      "shot"          = 18,  # diamond
      "tackle"        = 17,  # triangle up
      "interception"  = 15   # square
    ),
    labels = c("pass" = "Pass", "shot" = "Shot",
               "tackle" = "Tackle", "interception" = "Interception")
  ) +
  scale_alpha_manual(
    name   = "Outcome",
    values = c("successful" = 0.90, "unsuccessful" = 0.35),
    labels = c("successful" = "Successful", "unsuccessful" = "Unsuccessful")
  ) +

  # Correct aspect ratio: 105m wide, 68m tall
  coord_fixed(ratio = 1, xlim = c(-4, 109), ylim = c(-2, 70)) +

  labs(
    title = title_str,
    x = "Pitch length (m)",
    y = "Pitch width (m)"
  ) +

  theme_minimal(base_size = 8) +
  theme(
    plot.background   = element_rect(fill = PAGE_BG, color = PAGE_BG),
    panel.background  = element_rect(fill = PAGE_BG, color = NA),
    panel.grid.major  = element_blank(),
    panel.grid.minor  = element_blank(),
    panel.border      = element_blank(),
    axis.title        = element_text(color = INK,      size = 10),
    axis.text         = element_text(color = INK_SOFT, size = 8),
    axis.ticks        = element_line(color = INK_SOFT),
    plot.title        = element_text(color = INK,      size = 12,
                                     margin = margin(b = 8)),
    legend.background = element_rect(fill = ELEVATED_BG, color = INK_SOFT,
                                     linewidth = 0.4),
    legend.text       = element_text(color = INK_SOFT, size = 8),
    legend.title      = element_text(color = INK,      size = 9),
    legend.position   = "right",
    legend.key        = element_rect(fill = NA),
    plot.margin       = margin(12, 12, 12, 12)
  )

ggsave(
  filename = sprintf("plot-%s.png", THEME),
  plot     = p,
  device   = ragg::agg_png,
  width    = 8,
  height   = 4.5,
  units    = "in",
  dpi      = 400
)
Runnable source as JSON, for any HTTP client: https://api.anyplot.ai/specs/scatter-pitch-events/ggplot2/code. Any spec id and library id listed in llms-full.txt fit the same URL shape; every URL below is complete and callable.
{
  "spec_id": "scatter-pitch-events",
  "language": "r",
  "library": "ggplot2",
  "page": "https://anyplot.ai/scatter-pitch-events/r/ggplot2",
  "hub": "https://anyplot.ai/scatter-pitch-events",
  "code_json": "https://api.anyplot.ai/specs/scatter-pitch-events/ggplot2/code",
  "spec_json": "https://api.anyplot.ai/specs/scatter-pitch-events",
  "render_light_png": "https://storage.googleapis.com/anyplot-images/plots/scatter-pitch-events/r/ggplot2/plot-light.png",
  "render_dark_png": "https://storage.googleapis.com/anyplot-images/plots/scatter-pitch-events/r/ggplot2/plot-dark.png",
  "quality_score": 90.0,
  "license": "MIT",
  "guide": "https://anyplot.ai/llms.txt"
}
Part of Soccer Pitch Event Map on anyplot.ai.