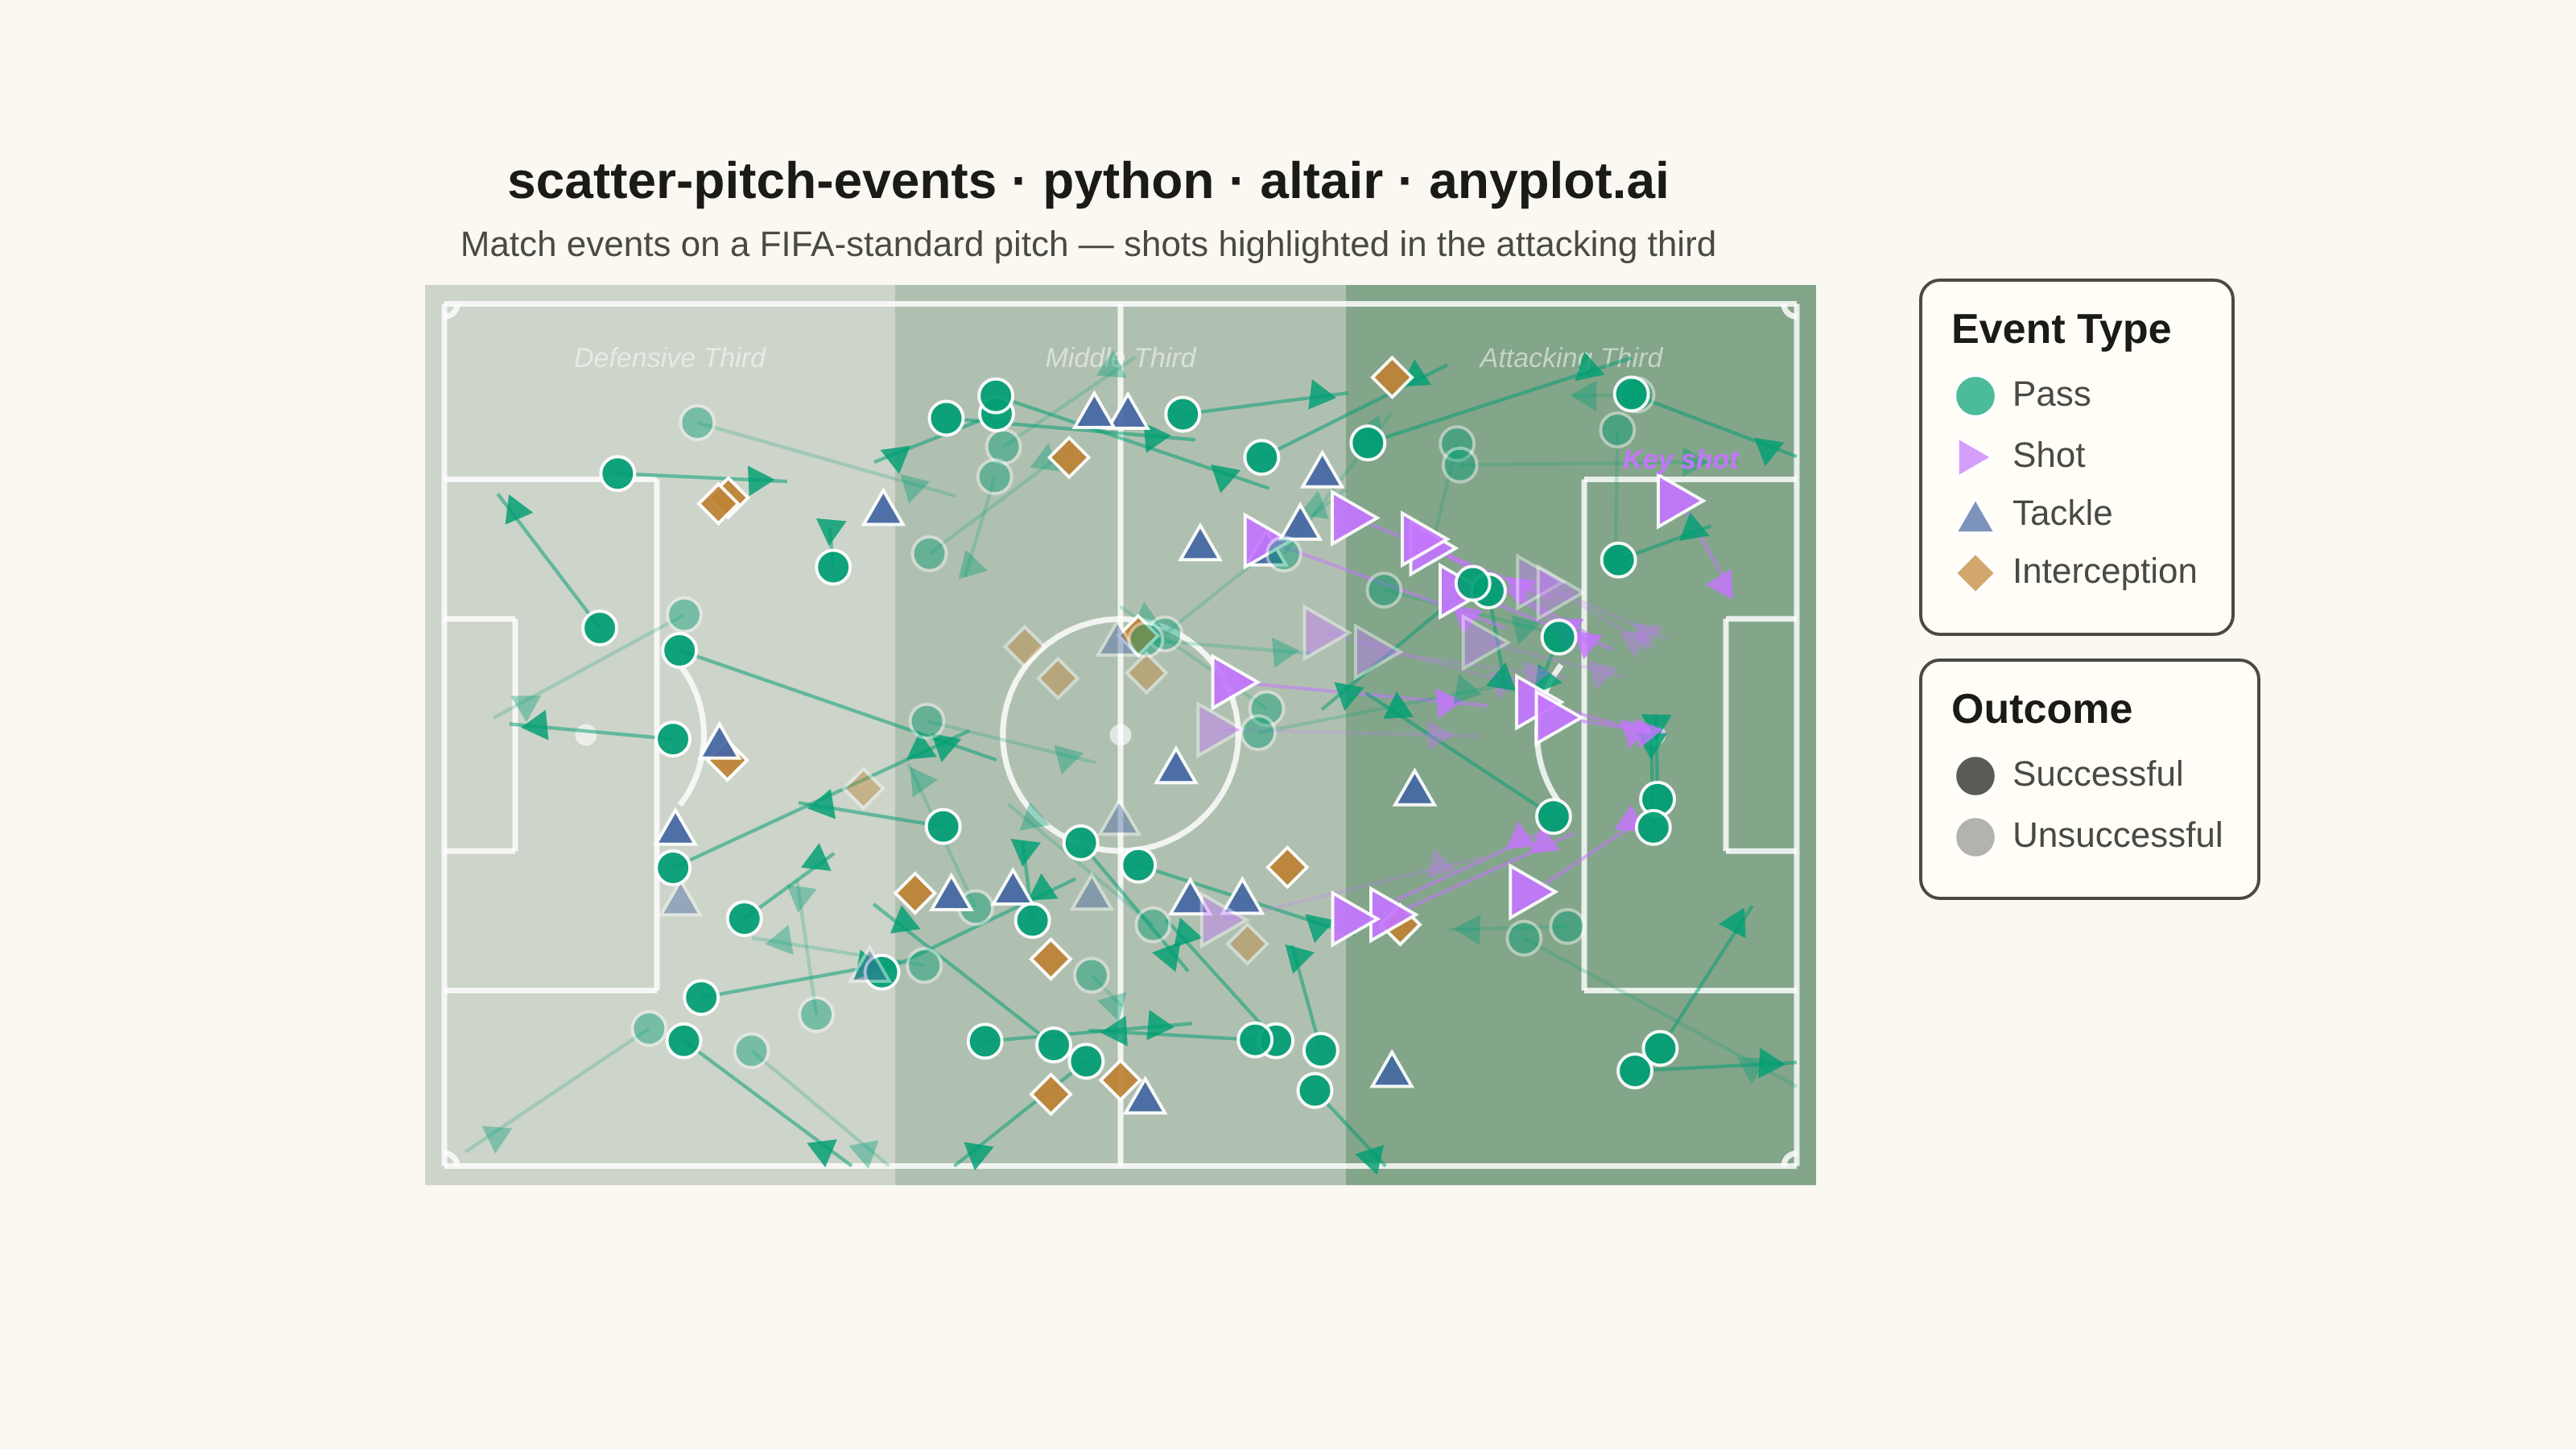
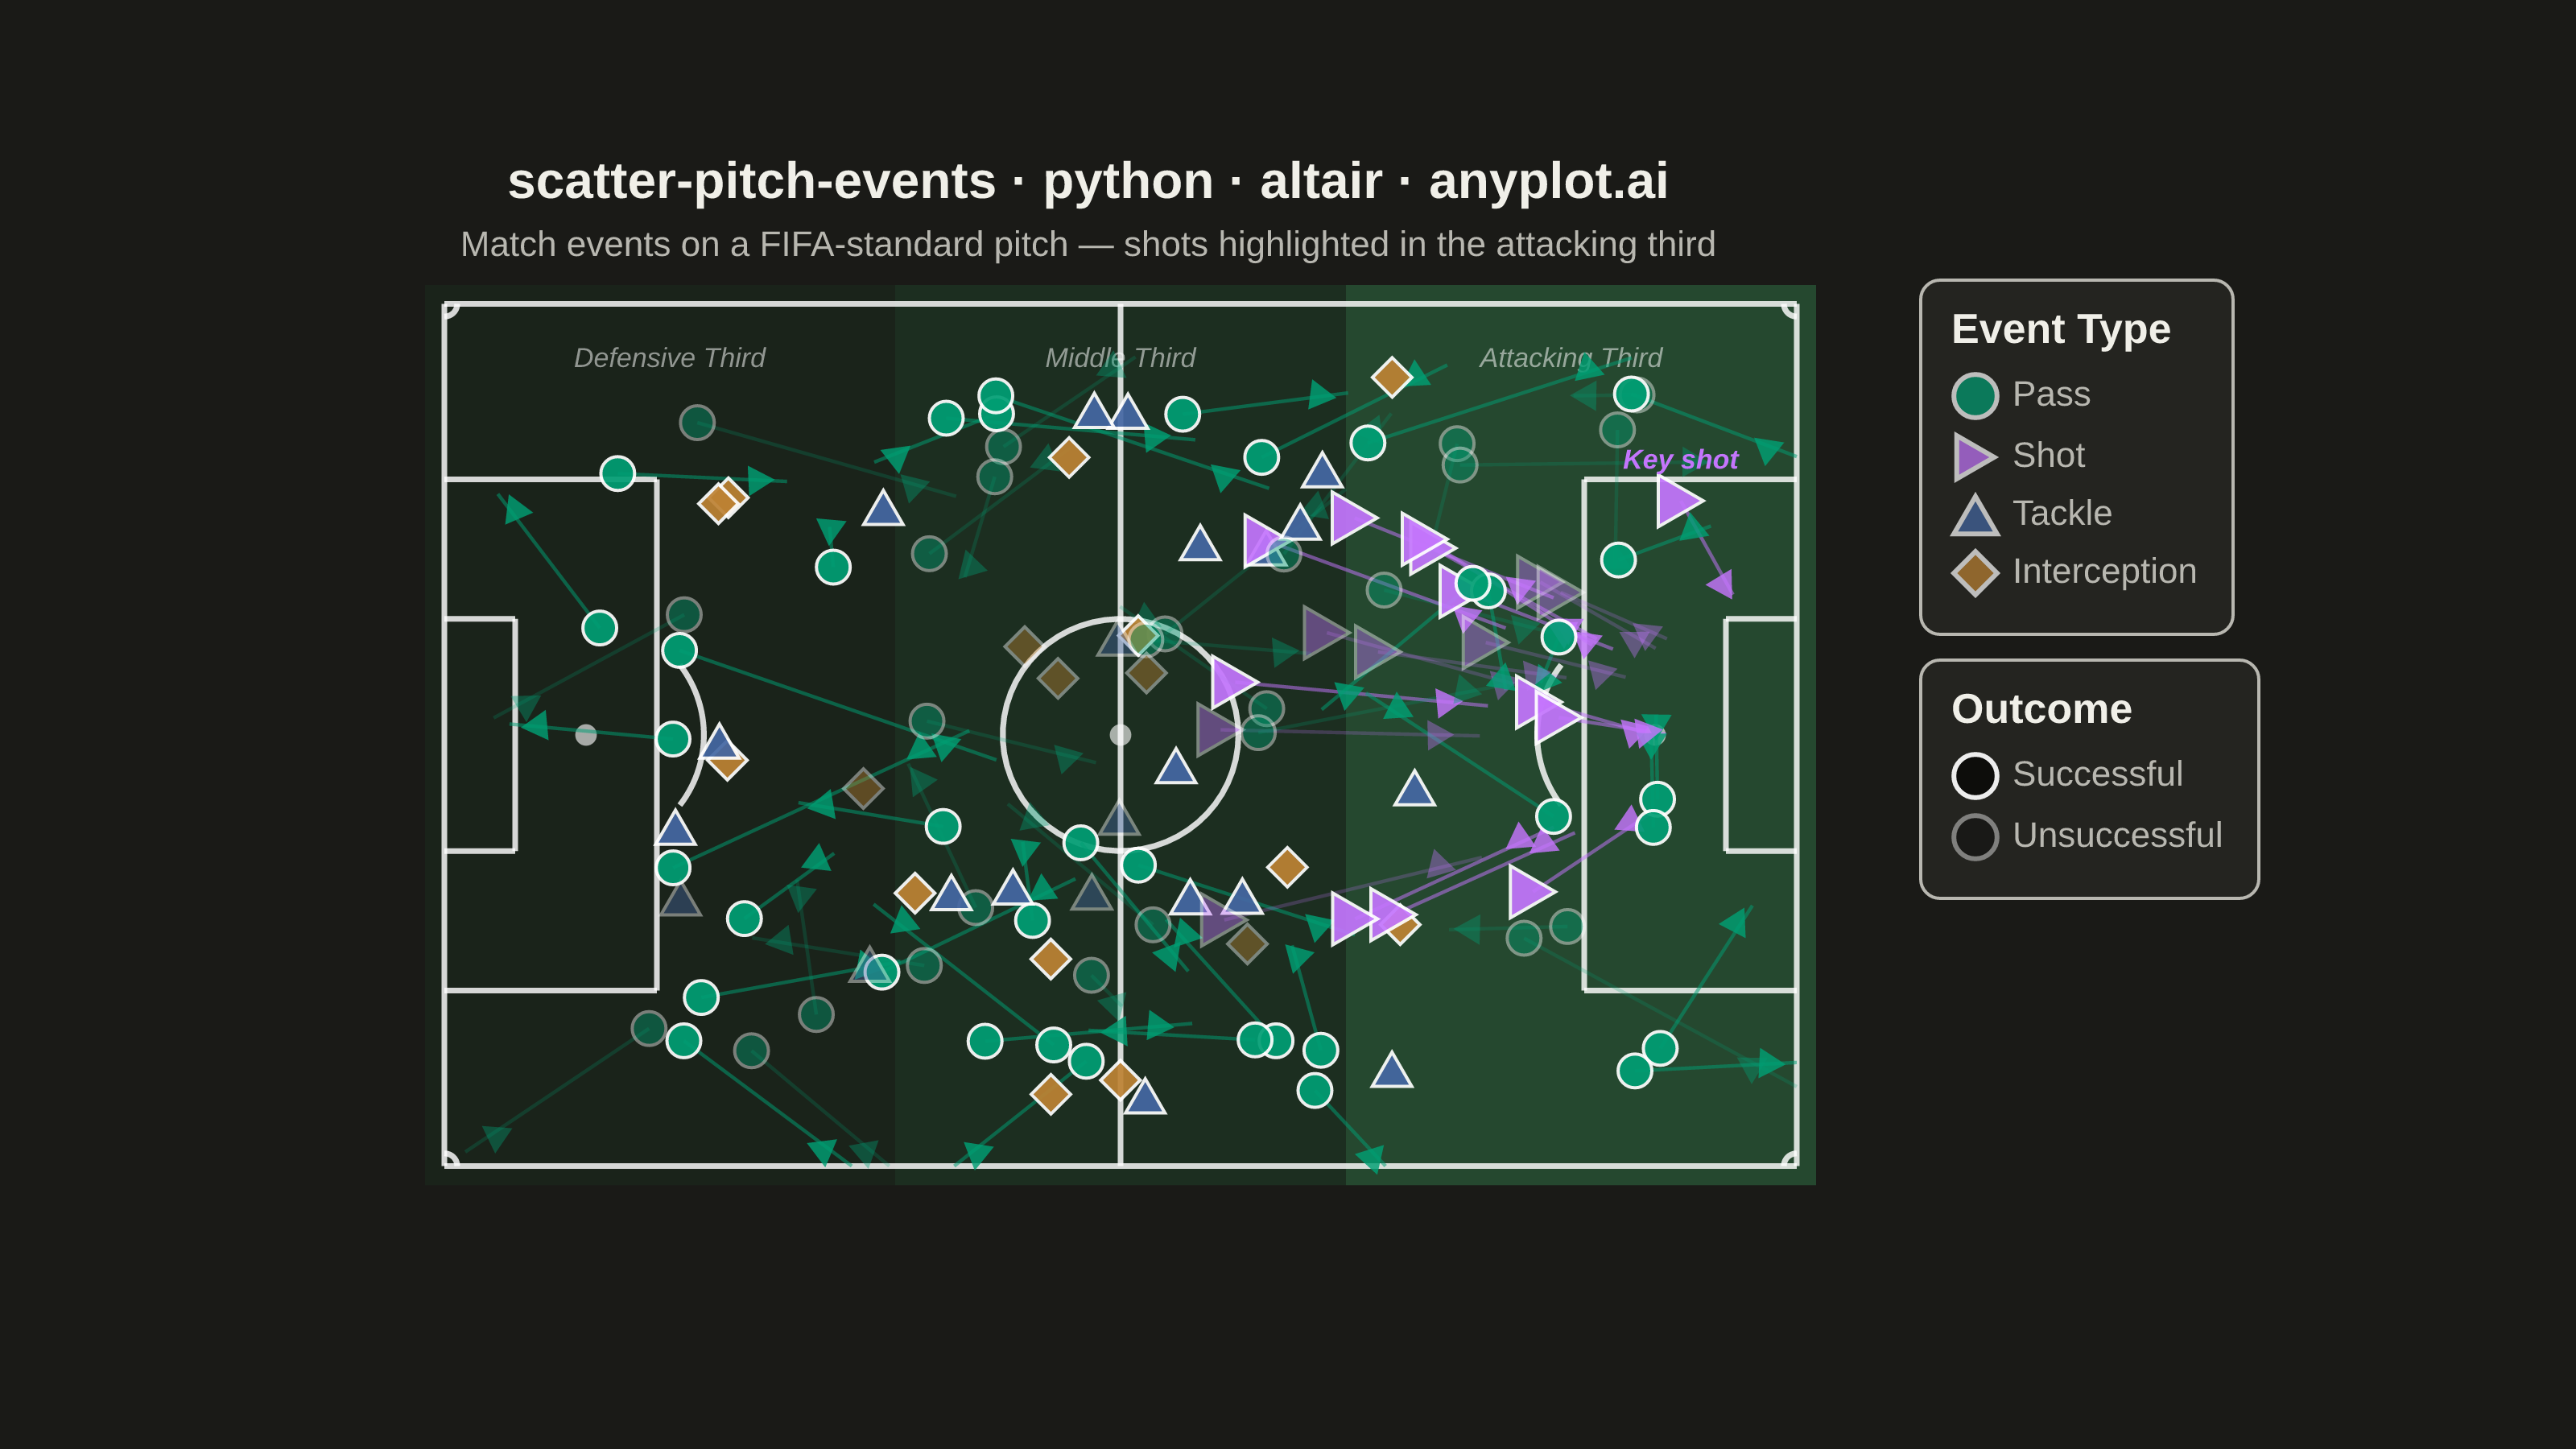
A soccer pitch event map positions match events (passes, shots, tackles, interceptions) as markers on an accurately scaled football pitch diagram. The pitch is drawn with standard markings including penalty areas, center circle, goal areas, and halfway line. Each event type uses distinct markers and colors, with directional arrows for passes and shots. This visualization is essential for tactical match analysis, scouting, and coaching in football analytics.
""" anyplot.ai
scatter-pitch-events: Soccer Pitch Event Map
Library: altair 6.2.1 | Python 3.13.14
Quality: 89/100 | Updated: 2026-06-21
"""

import os
import sys


# Remove script directory from sys.path to avoid importing local altair.py
_script_dir = os.path.dirname(os.path.abspath(__file__))
if _script_dir in sys.path:
    sys.path.remove(_script_dir)

import altair as alt
import numpy as np
import pandas as pd
from PIL import Image


# Theme tokens
THEME = os.getenv("ANYPLOT_THEME", "light")
PAGE_BG = "#FAF8F1" if THEME == "light" else "#1A1A17"
ELEVATED_BG = "#FFFDF6" if THEME == "light" else "#242420"
INK = "#1A1A17" if THEME == "light" else "#F0EFE8"
INK_SOFT = "#4A4A44" if THEME == "light" else "#B8B7B0"

# Imprint palette — canonical positions 1–4 for event categories
color_domain = ["Pass", "Shot", "Tackle", "Interception"]
color_range = ["#009E73", "#C475FD", "#4467A3", "#BD8233"]

# Data
np.random.seed(42)
n_events = 120
event_types = np.random.choice(["Pass", "Shot", "Tackle", "Interception"], size=n_events, p=[0.50, 0.15, 0.20, 0.15])

x = np.zeros(n_events)
y = np.zeros(n_events)
end_x = np.zeros(n_events)
end_y = np.zeros(n_events)

for i, etype in enumerate(event_types):
    if etype == "Pass":
        x[i] = np.random.uniform(10, 95)
        y[i] = np.random.uniform(5, 63)
        end_x[i] = np.clip(x[i] + np.random.uniform(-15, 25), 0, 105)
        end_y[i] = np.clip(y[i] + np.random.uniform(-12, 12), 0, 68)
    elif etype == "Shot":
        x[i] = np.random.uniform(60, 98)
        y[i] = np.random.uniform(15, 53)
        # Shorter trajectory (45%) to reduce arrow congestion near goal
        target_x = 105
        target_y = 34 + np.random.uniform(-4, 4)
        end_x[i] = x[i] + 0.45 * (target_x - x[i])
        end_y[i] = y[i] + 0.45 * (target_y - y[i])
    elif etype == "Tackle":
        x[i] = np.random.uniform(15, 80)
        y[i] = np.random.uniform(5, 63)
    elif etype == "Interception":
        x[i] = np.random.uniform(20, 75)
        y[i] = np.random.uniform(5, 63)

outcomes = np.where(np.random.random(n_events) < 0.65, "Successful", "Unsuccessful")
df = pd.DataFrame({"x": x, "y": y, "end_x": end_x, "end_y": end_y, "event_type": event_types, "outcome": outcomes})

# Per-type marker sizes: smaller passes reduce midfield congestion
size_map = {"Pass": 110, "Shot": 260, "Tackle": 150, "Interception": 150}
df["marker_size"] = df["event_type"].map(size_map)

# Arrowhead positions at 85% along each trajectory
arrows_df = df[df["event_type"].isin(["Pass", "Shot"])].copy()
arrow_frac = 0.85
arrows_df["arrow_x"] = arrows_df["x"] + arrow_frac * (arrows_df["end_x"] - arrows_df["x"])
arrows_df["arrow_y"] = arrows_df["y"] + arrow_frac * (arrows_df["end_y"] - arrows_df["y"])
dx = arrows_df["end_x"] - arrows_df["x"]
dy = arrows_df["end_y"] - arrows_df["y"]
arrows_df["angle"] = np.degrees(np.arctan2(dy, dx))

# Annotation: deepest shot in the attacking third
key_shot = df[df["event_type"] == "Shot"].nlargest(1, "x").copy()
key_shot["callout"] = "Key shot"

# Pitch zones — green gradient with pronounced opacity to highlight attacking third
zones_data = pd.DataFrame(
    {
        "x": [-1.5, 35, 70],
        "y": [-1.5, -1.5, -1.5],
        "x2": [35, 70, 106.5],
        "y2": [69.5, 69.5, 69.5],
        "fill": ["#1a472a", "#1f5432", "#2d6a3f"],
        "zone_opacity": [0.20, 0.34, 0.58],
    }
)

# Zone labels — typographic hierarchy that names each pitch third
zone_labels_data = pd.DataFrame(
    {"x": [17.5, 52.5, 87.5], "y": [64.8, 64.8, 64.8], "label": ["Defensive Third", "Middle Third", "Attacking Third"]}
)

# Pitch markings — standard FIFA dimensions (105m × 68m)
lines_data = pd.DataFrame(
    {
        "x": [0, 0, 105, 0, 52.5, 0, 16.5, 16.5, 0, 5.5, 5.5, 105, 88.5, 88.5, 105, 99.5, 99.5],
        "y": [0, 0, 0, 68, 0, 13.84, 13.84, 54.16, 24.84, 24.84, 43.16, 13.84, 13.84, 54.16, 24.84, 24.84, 43.16],
        "x2": [105, 0, 105, 105, 52.5, 16.5, 16.5, 0, 5.5, 5.5, 0, 88.5, 88.5, 105, 99.5, 99.5, 105],
        "y2": [0, 68, 68, 68, 68, 13.84, 54.16, 54.16, 24.84, 43.16, 43.16, 13.84, 54.16, 54.16, 24.84, 43.16, 43.16],
    }
)

theta = np.linspace(0, 2 * np.pi, 60)
center_circle = pd.DataFrame({"x": 52.5 + 9.15 * np.cos(theta), "y": 34 + 9.15 * np.sin(theta), "order": range(60)})

arc_theta = np.linspace(-0.65, 0.65, 30)
left_arc = pd.DataFrame({"x": 11 + 9.15 * np.cos(arc_theta), "y": 34 + 9.15 * np.sin(arc_theta), "order": range(30)})
right_arc = pd.DataFrame(
    {"x": 94 + 9.15 * np.cos(np.pi - arc_theta), "y": 34 + 9.15 * np.sin(np.pi - arc_theta), "order": range(30)}
)

corner_arcs = []
for cx, cy, t_start, t_end in [
    (0, 0, 0, np.pi / 2),
    (0, 68, -np.pi / 2, 0),
    (105, 0, np.pi / 2, np.pi),
    (105, 68, np.pi, 3 * np.pi / 2),
]:
    t = np.linspace(t_start, t_end, 15)
    corner_arcs.append(pd.DataFrame({"x": cx + 1 * np.cos(t), "y": cy + 1 * np.sin(t), "order": range(15)}))

spots = pd.DataFrame({"x": [52.5, 11, 94], "y": [34, 34, 34]})

# Shared axis config — hidden for pitch diagram
x_axis = alt.X(
    "x:Q",
    scale=alt.Scale(domain=[-1.5, 106.5]),
    axis=alt.Axis(title=None, labels=False, ticks=False, grid=False, domain=False),
)
y_axis = alt.Y(
    "y:Q",
    scale=alt.Scale(domain=[-1.5, 69.5]),
    axis=alt.Axis(title=None, labels=False, ticks=False, grid=False, domain=False),
)

# Interactive selection: click legend to filter event types (HTML export feature)
event_select = alt.selection_point(fields=["event_type"], bind="legend")

# Zone background layers — full-domain coverage for clean pitch look
zone_layers = []
for _, row in zones_data.iterrows():
    zone_layers.append(
        alt.Chart(pd.DataFrame({"x": [row["x"]], "y": [row["y"]], "x2": [row["x2"]], "y2": [row["y2"]]}))
        .mark_rect(color=row["fill"], opacity=row["zone_opacity"])
        .encode(x="x:Q", y="y:Q", x2="x2:Q", y2="y2:Q")
    )

# Zone label layer — italic white labels establish typographic hierarchy
zone_label_layer = (
    alt.Chart(zone_labels_data)
    .mark_text(fontSize=8.5, fontStyle="italic", color="rgba(255,255,255,0.52)", align="center", baseline="top")
    .encode(
        x=alt.X("x:Q", scale=alt.Scale(domain=[-1.5, 106.5])),
        y=alt.Y("y:Q", scale=alt.Scale(domain=[-1.5, 69.5])),
        text="label:N",
    )
)

# Pitch structure — white lines on dark green
pitch_lines = (
    alt.Chart(lines_data)
    .mark_rule(color="rgba(255,255,255,0.82)", strokeWidth=1.8)
    .encode(x="x:Q", y="y:Q", x2="x2:Q", y2="y2:Q")
)
circle_layer = (
    alt.Chart(center_circle)
    .mark_line(color="rgba(255,255,255,0.82)", strokeWidth=1.8, filled=False)
    .encode(x=x_axis, y=y_axis, order="order:O")
)
left_arc_layer = (
    alt.Chart(left_arc)
    .mark_line(color="rgba(255,255,255,0.82)", strokeWidth=1.8)
    .encode(x=x_axis, y=y_axis, order="order:O")
)
right_arc_layer = (
    alt.Chart(right_arc)
    .mark_line(color="rgba(255,255,255,0.82)", strokeWidth=1.8)
    .encode(x=x_axis, y=y_axis, order="order:O")
)
corner_layers = [
    alt.Chart(ca).mark_line(color="rgba(255,255,255,0.82)", strokeWidth=1.8).encode(x=x_axis, y=y_axis, order="order:O")
    for ca in corner_arcs
]
spot_layer = (
    alt.Chart(spots).mark_point(color="rgba(255,255,255,0.88)", size=45, filled=True).encode(x=x_axis, y=y_axis)
)

# Direction lines for passes and shots — filtered by interactive selection
arrow_lines = (
    alt.Chart(arrows_df)
    .mark_rule(strokeWidth=1.1)
    .transform_filter(event_select)
    .encode(
        x="x:Q",
        y="y:Q",
        x2="end_x:Q",
        y2="end_y:Q",
        color=alt.Color("event_type:N", scale=alt.Scale(domain=color_domain, range=color_range), legend=None),
        opacity=alt.Opacity(
            "outcome:N", scale=alt.Scale(domain=["Successful", "Unsuccessful"], range=[0.52, 0.22]), legend=None
        ),
    )
)
arrowheads = (
    alt.Chart(arrows_df)
    .mark_point(shape="triangle-right", filled=True, size=90, stroke=None)
    .transform_filter(event_select)
    .encode(
        x=alt.X("arrow_x:Q", scale=alt.Scale(domain=[-1.5, 106.5]), axis=None),
        y=alt.Y("arrow_y:Q", scale=alt.Scale(domain=[-1.5, 69.5]), axis=None),
        color=alt.Color("event_type:N", scale=alt.Scale(domain=color_domain, range=color_range), legend=None),
        angle=alt.Angle("angle:Q", scale=alt.Scale(domain=[-180, 180], range=[-180, 180])),
        opacity=alt.Opacity(
            "outcome:N", scale=alt.Scale(domain=["Successful", "Unsuccessful"], range=[0.82, 0.38]), legend=None
        ),
    )
)

# Event markers — shape + color + size + opacity encodings with legend-bound selection
event_points = (
    alt.Chart(df)
    .mark_point(filled=True, stroke="#ffffff", strokeWidth=1.0)
    .add_params(event_select)
    .transform_filter(event_select)
    .encode(
        x=x_axis,
        y=y_axis,
        color=alt.Color(
            "event_type:N",
            scale=alt.Scale(domain=color_domain, range=color_range),
            legend=alt.Legend(
                title="Event Type",
                titleFontSize=13,
                titleFontWeight="bold",
                labelFontSize=11,
                symbolSize=180,
                orient="right",
            ),
        ),
        shape=alt.Shape(
            "event_type:N",
            scale=alt.Scale(
                domain=["Pass", "Shot", "Tackle", "Interception"],
                range=["circle", "triangle-right", "triangle-up", "diamond"],
            ),
            legend=None,
        ),
        size=alt.Size("marker_size:Q", scale=alt.Scale(domain=[110, 260], range=[110, 260]), legend=None),
        opacity=alt.Opacity(
            "outcome:N",
            scale=alt.Scale(domain=["Successful", "Unsuccessful"], range=[0.92, 0.42]),
            legend=alt.Legend(
                title="Outcome",
                titleFontSize=13,
                titleFontWeight="bold",
                labelFontSize=11,
                symbolSize=180,
                orient="right",
            ),
        ),
        tooltip=[
            alt.Tooltip("event_type:N", title="Event"),
            alt.Tooltip("outcome:N", title="Outcome"),
            alt.Tooltip("x:Q", title="X (m)", format=".1f"),
            alt.Tooltip("y:Q", title="Y (m)", format=".1f"),
        ],
    )
)

# Annotation callout — labels the deepest shot to anchor the attacking-third story
callout_layer = (
    alt.Chart(key_shot)
    .mark_text(
        align="center", baseline="bottom", fontSize=8.5, fontStyle="italic", fontWeight="bold", color="#C475FD", dy=-8
    )
    .encode(
        x=alt.X("x:Q", scale=alt.Scale(domain=[-1.5, 106.5])),
        y=alt.Y("y:Q", scale=alt.Scale(domain=[-1.5, 69.5])),
        text="callout:N",
    )
)

# Compose all layers — inner view sized to maintain FIFA 105:68 pitch proportions
title_str = "scatter-pitch-events · python · altair · anyplot.ai"
chart = (
    alt.layer(
        *zone_layers,
        zone_label_layer,
        pitch_lines,
        circle_layer,
        left_arc_layer,
        right_arc_layer,
        *corner_layers,
        spot_layer,
        arrow_lines,
        arrowheads,
        event_points,
        callout_layer,
    )
    .properties(
        width=480,
        height=315,
        background=PAGE_BG,
        title=alt.Title(
            title_str,
            fontSize=16,
            fontWeight="bold",
            color=INK,
            subtitle="Match events on a FIFA-standard pitch — shots highlighted in the attacking third",
            subtitleFontSize=11,
            subtitleColor=INK_SOFT,
            subtitlePadding=6,
        ),
    )
    .configure_view(fill=PAGE_BG, strokeWidth=0)
    .configure_axis(
        domainColor=INK_SOFT, tickColor=INK_SOFT, gridColor=INK, gridOpacity=0.12, labelColor=INK_SOFT, titleColor=INK
    )
    .configure_title(color=INK)
    .configure_legend(
        fillColor=ELEVATED_BG,
        strokeColor=INK_SOFT,
        labelColor=INK_SOFT,
        titleColor=INK,
        padding=10,
        cornerRadius=6,
        titlePadding=6,
    )
    .resolve_scale(
        color="independent", opacity="independent", shape="independent", angle="independent", size="independent"
    )
    .interactive()
)

# Save PNG and pad to exact 3200×1800 target
TW, TH = 3200, 1800
chart.save(f"plot-{THEME}.png", scale_factor=4.0)
_img = Image.open(f"plot-{THEME}.png").convert("RGB")
_w, _h = _img.size
if _w > TW or _h > TH:
    raise SystemExit(
        f"altair vl-convert produced {_w}×{_h}, exceeds target {TW}×{TH}. "
        f"Shrink chart .properties(width=, height=) values and re-render."
    )
if _w < TW or _h < TH:
    _canvas = Image.new("RGB", (TW, TH), PAGE_BG)
    _canvas.paste(_img, ((TW - _w) // 2, (TH - _h) // 2))
    _canvas.save(f"plot-{THEME}.png")

# Save interactive HTML
chart.save(f"plot-{THEME}.html")
Runnable source as JSON, for any HTTP client: https://api.anyplot.ai/specs/scatter-pitch-events/altair/code. Any spec id and library id listed in llms-full.txt fit the same URL shape; every URL below is complete and callable.
{
  "spec_id": "scatter-pitch-events",
  "language": "python",
  "library": "altair",
  "page": "https://anyplot.ai/scatter-pitch-events/python/altair",
  "hub": "https://anyplot.ai/scatter-pitch-events",
  "code_json": "https://api.anyplot.ai/specs/scatter-pitch-events/altair/code",
  "spec_json": "https://api.anyplot.ai/specs/scatter-pitch-events",
  "render_light_png": "https://storage.googleapis.com/anyplot-images/plots/scatter-pitch-events/python/altair/plot-light.png",
  "render_dark_png": "https://storage.googleapis.com/anyplot-images/plots/scatter-pitch-events/python/altair/plot-dark.png",
  "interactive_light_html": "https://storage.googleapis.com/anyplot-images/plots/scatter-pitch-events/python/altair/plot-light.html",
  "interactive_dark_html": "https://storage.googleapis.com/anyplot-images/plots/scatter-pitch-events/python/altair/plot-dark.html",
  "quality_score": 89.0,
  "license": "MIT",
  "guide": "https://anyplot.ai/llms.txt"
}
Part of Soccer Pitch Event Map on anyplot.ai.