The same plot in 14 other libraries — Python: Altair, Bokeh, lets-plot, Matplotlib, Plotly, plotnine, Pygal, Seaborn; R: ggplot2; JavaScript: Chart.js, D3.js, Apache ECharts, Highcharts, MUI X Charts. Compare all 15 side by side: Soccer Pitch Event Map in Python, R, Julia and JavaScript.
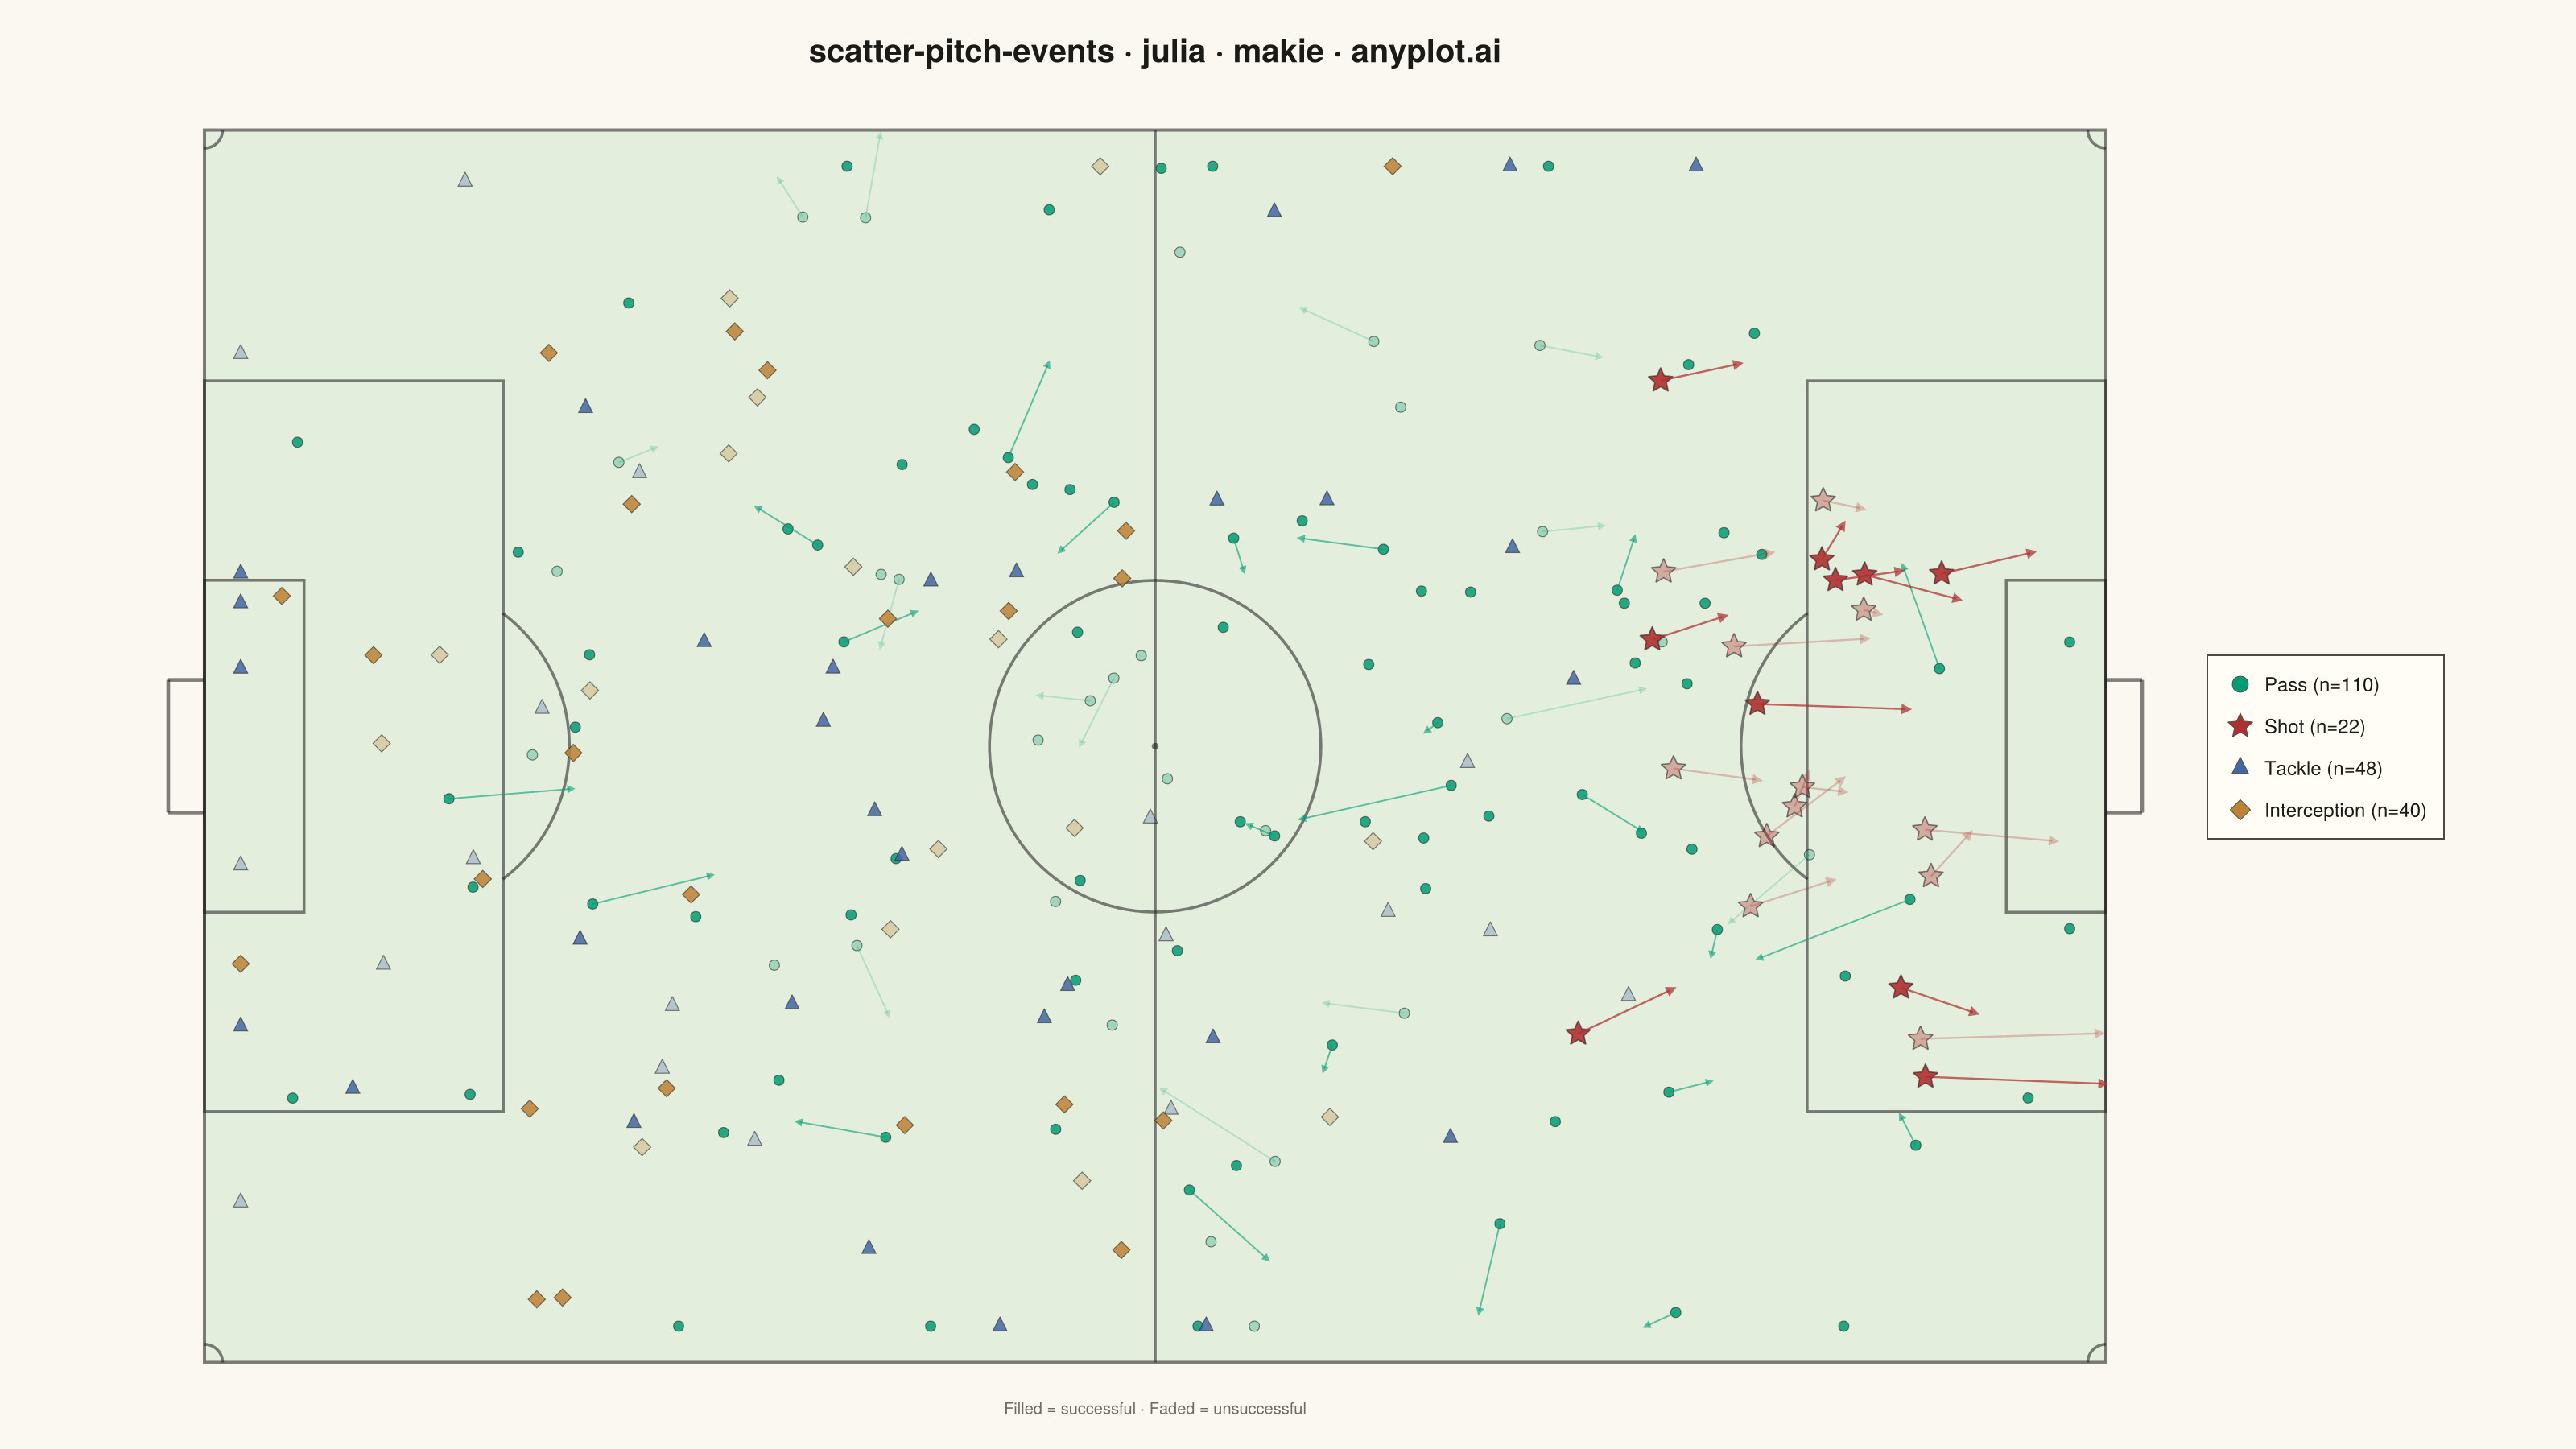
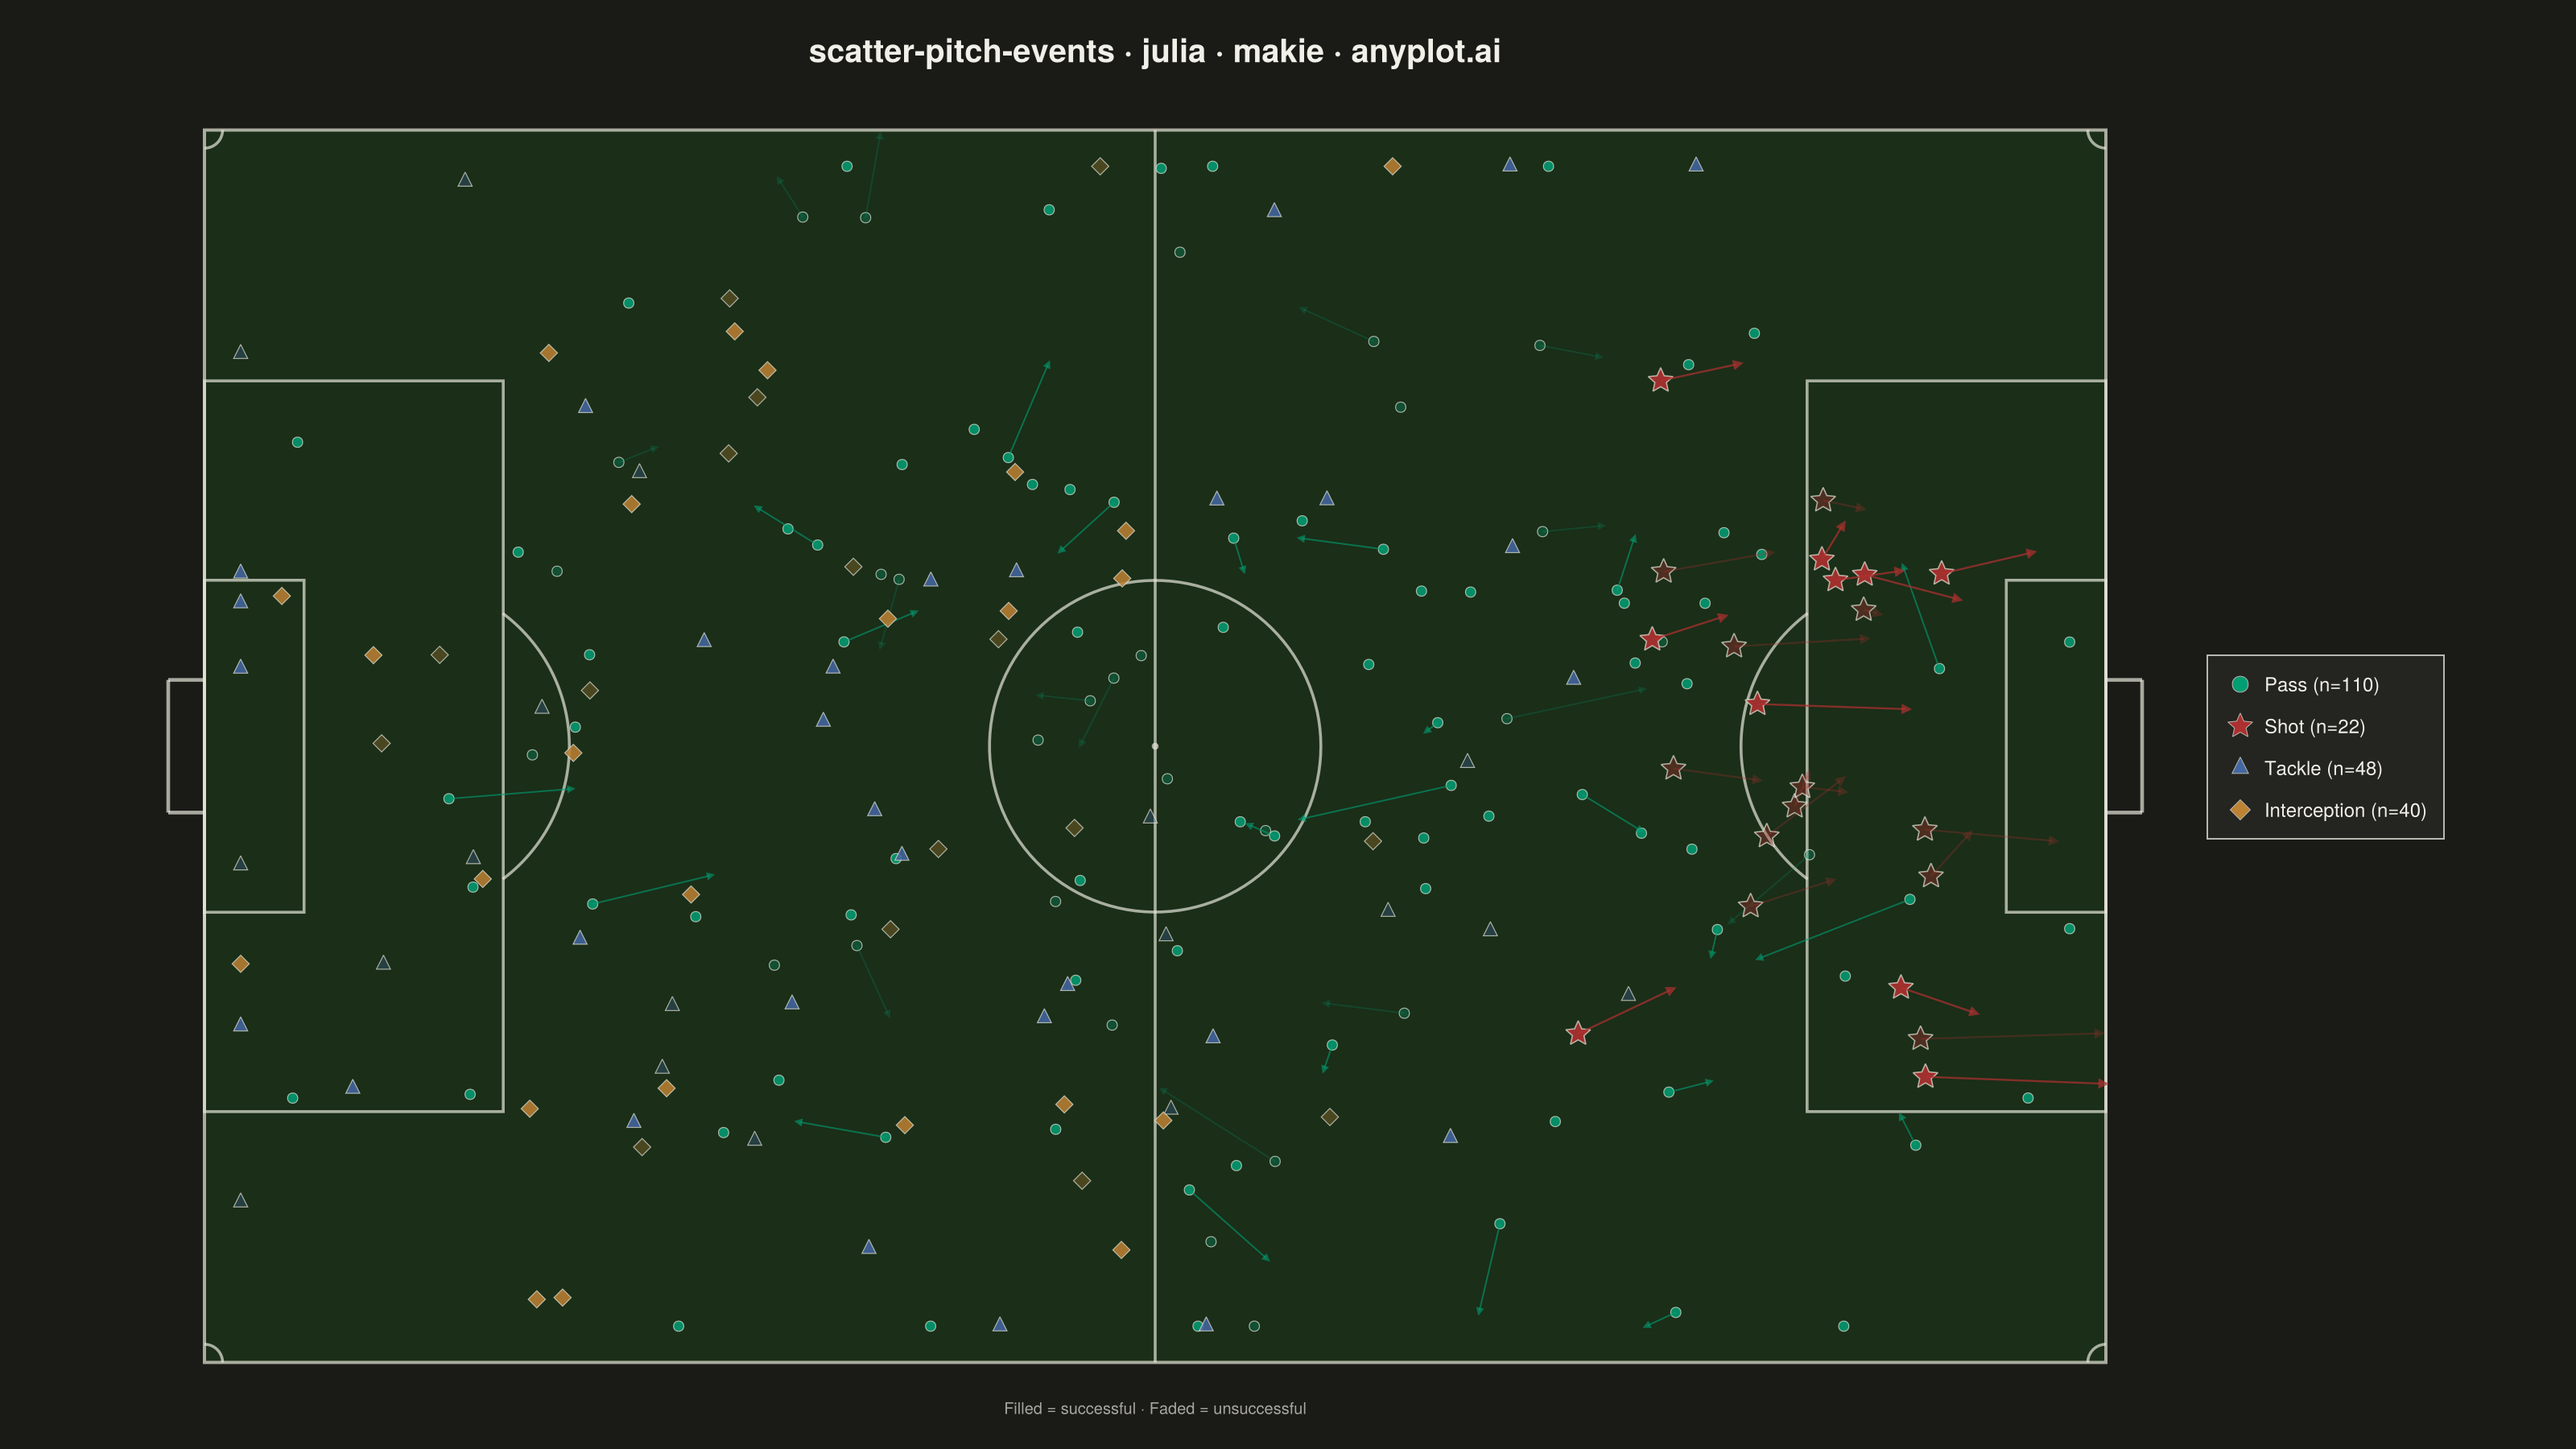
A soccer pitch event map positions match events (passes, shots, tackles, interceptions) as markers on an accurately scaled football pitch diagram. The pitch is drawn with standard markings including penalty areas, center circle, goal areas, and halfway line. Each event type uses distinct markers and colors, with directional arrows for passes and shots. This visualization is essential for tactical match analysis, scouting, and coaching in football analytics.
# anyplot.ai
# scatter-pitch-events: Soccer Pitch Event Map
# Library: makie 0.22.10 | Julia 1.11.9
# Quality: 93/100 | Created: 2026-06-21

using CairoMakie
using Colors
using Random

Random.seed!(42)

# Theme tokens
const THEME       = get(ENV, "ANYPLOT_THEME", "light")
const PAGE_BG     = THEME == "light" ? colorant"#FAF8F1" : colorant"#1A1A17"
const ELEVATED_BG = THEME == "light" ? colorant"#FFFDF6" : colorant"#242420"
const INK         = THEME == "light" ? colorant"#1A1A17" : colorant"#F0EFE8"
const INK_SOFT    = THEME == "light" ? colorant"#4A4A44" : colorant"#B8B7B0"
const INK_MUTED   = THEME == "light" ? colorant"#6B6A63" : colorant"#A8A79F"

# Imprint palette — event types mapped semantically
const COL_PASS          = colorant"#009E73"  # green — pass (constructive, positive action)
const COL_SHOT          = colorant"#AE3030"  # matte red — shot (aggressive, goal attempt)
const COL_TACKLE        = colorant"#4467A3"  # blue — tackle (defensive)
const COL_INTERCEPTION  = colorant"#BD8233"  # ochre — interception (opportunistic)

# Pitch surface: green tones that work on both themes
const PITCH_FILL  = THEME == "light" ? RGBAf(0.13, 0.55, 0.13, 0.10) : RGBAf(0.13, 0.55, 0.13, 0.18)
const PITCH_LINE  = THEME == "light" ? RGBAf(0.1, 0.1, 0.1, 0.55) : RGBAf(0.9, 0.9, 0.85, 0.70)

# Pitch dimensions (FIFA standard)
const PW = 105.0   # pitch width  (x)
const PH = 68.0    # pitch height (y)

# --- Data -------------------------------------------------------------------
n_events = 220

# Passes — distributed across pitch, mostly in middle and attacking third
n_pass = 110
pass_x = clamp.(randn(n_pass) .* 25 .+ 58, 2, 103)
pass_y = clamp.(randn(n_pass) .* 18 .+ 34, 2, 66)
pass_dx = randn(n_pass) .* 6
pass_dy = randn(n_pass) .* 4
pass_success = rand(n_pass) .> 0.25  # 75% success rate

# Shots — clustered in attacking third, near penalty area
n_shot = 22
shot_x = clamp.(randn(n_shot) .* 8 .+ 88, 75, 103)
shot_y = clamp.(randn(n_shot) .* 12 .+ 34, 10, 58)
shot_dx = clamp.(randn(n_shot) .* 4 .+ 6, 1, 14)
shot_dy = randn(n_shot) .* 3
shot_success = rand(n_shot) .> 0.72  # ~28% on target

# Tackles — spread across defensive and middle thirds
n_tackle = 48
tackle_x = clamp.(randn(n_tackle) .* 22 .+ 42, 2, 95)
tackle_y = clamp.(randn(n_tackle) .* 18 .+ 34, 2, 66)
tackle_success = rand(n_tackle) .> 0.40

# Interceptions — defensive half
n_inter = 40
inter_x = clamp.(randn(n_inter) .* 18 .+ 35, 2, 80)
inter_y = clamp.(randn(n_inter) .* 18 .+ 34, 2, 66)
inter_success = rand(n_inter) .> 0.35

# --- Figure -----------------------------------------------------------------
fig = Figure(
    size            = (1600, 900),
    fontsize        = 14,
    backgroundcolor = PAGE_BG,
)

title_str = "scatter-pitch-events · julia · makie · anyplot.ai"
n_chars = length(title_str)
title_sz = n_chars > 67 ? round(Int, 20 * 67 / n_chars) : 20

ax = Axis(
    fig[1, 1];
    title              = title_str,
    titlesize          = title_sz,
    titlecolor         = INK,
    backgroundcolor    = PAGE_BG,
    aspect             = DataAspect(),
    topspinevisible    = false,
    rightspinevisible  = false,
    leftspinevisible   = false,
    bottomspinevisible = false,
    xgridvisible       = false,
    ygridvisible       = false,
    xticksvisible      = false,
    yticksvisible      = false,
    xticklabelsvisible = false,
    yticklabelsvisible = false,
)

# --- Draw pitch -------------------------------------------------------------
# Pitch fill
poly!(ax,
    [Point2f(0, 0), Point2f(PW, 0), Point2f(PW, PH), Point2f(0, PH)];
    color = PITCH_FILL, strokecolor = PITCH_LINE, strokewidth = 2.0,
)

# Subtle zone shading: very light red tint on the attacking third
attack_zone_alpha = THEME == "light" ? 0.045f0 : 0.08f0
poly!(ax,
    [Point2f(70, 0), Point2f(PW, 0), Point2f(PW, PH), Point2f(70, PH)];
    color = RGBAf(COL_SHOT.r, COL_SHOT.g, COL_SHOT.b, attack_zone_alpha), strokewidth = 0,
)

lw = 1.8  # line width for markings

# Halfway line
lines!(ax, [PW/2, PW/2], [0, PH]; color = PITCH_LINE, linewidth = lw)

# Centre circle (radius 9.15m)
θ = LinRange(0, 2π, 120)
lines!(ax, PW/2 .+ 9.15 .* cos.(θ), PH/2 .+ 9.15 .* sin.(θ);
       color = PITCH_LINE, linewidth = lw)
scatter!(ax, [PW/2], [PH/2]; color = PITCH_LINE, markersize = 6)

# Left penalty area (16.5m deep × 40.32m wide, centred)
penalty_y_lo = (PH - 40.32) / 2
penalty_y_hi = (PH + 40.32) / 2
poly!(ax,
    [Point2f(0, penalty_y_lo), Point2f(16.5, penalty_y_lo),
     Point2f(16.5, penalty_y_hi), Point2f(0, penalty_y_hi)];
    color = RGBAf(0, 0, 0, 0), strokecolor = PITCH_LINE, strokewidth = lw,
)

# Right penalty area
poly!(ax,
    [Point2f(PW - 16.5, penalty_y_lo), Point2f(PW, penalty_y_lo),
     Point2f(PW, penalty_y_hi), Point2f(PW - 16.5, penalty_y_hi)];
    color = RGBAf(0, 0, 0, 0), strokecolor = PITCH_LINE, strokewidth = lw,
)

# Left goal area (5.5m deep × 18.32m wide)
goal_y_lo = (PH - 18.32) / 2
goal_y_hi = (PH + 18.32) / 2
poly!(ax,
    [Point2f(0, goal_y_lo), Point2f(5.5, goal_y_lo),
     Point2f(5.5, goal_y_hi), Point2f(0, goal_y_hi)];
    color = RGBAf(0, 0, 0, 0), strokecolor = PITCH_LINE, strokewidth = lw,
)

# Right goal area
poly!(ax,
    [Point2f(PW - 5.5, goal_y_lo), Point2f(PW, goal_y_lo),
     Point2f(PW, goal_y_hi), Point2f(PW - 5.5, goal_y_hi)];
    color = RGBAf(0, 0, 0, 0), strokecolor = PITCH_LINE, strokewidth = lw,
)

# Left penalty arc (radius 9.15m, centred on penalty spot at 11m)
arc_angles_left = LinRange(-0.93, 0.93, 60)
lines!(ax,
    11.0 .+ 9.15 .* cos.(arc_angles_left),
    PH/2 .+ 9.15 .* sin.(arc_angles_left);
    color = PITCH_LINE, linewidth = lw,
)

# Right penalty arc
arc_angles_right = LinRange(π - 0.93, π + 0.93, 60)
lines!(ax,
    (PW - 11.0) .+ 9.15 .* cos.(arc_angles_right),
    PH/2 .+ 9.15 .* sin.(arc_angles_right);
    color = PITCH_LINE, linewidth = lw,
)

# Corner arcs (radius 1m)
corner_r = 1.0
for (cx, cy, a1, a2) in [
        (0.0, 0.0,  0.0,      π/2),
        (PW,  0.0,  π/2,      π),
        (PW,  PH,   π,        3π/2),
        (0.0, PH,   3π/2,     2π),
    ]
    θc = LinRange(a1, a2, 30)
    lines!(ax, cx .+ corner_r .* cos.(θc), cy .+ corner_r .* sin.(θc);
           color = PITCH_LINE, linewidth = lw)
end

# Left goal posts
lines!(ax, [-2.0, -2.0], [(PH - 7.32)/2, (PH + 7.32)/2]; color = PITCH_LINE, linewidth = lw + 0.5)
lines!(ax, [-2.0, 0.0],  [(PH - 7.32)/2, (PH - 7.32)/2]; color = PITCH_LINE, linewidth = lw + 0.5)
lines!(ax, [-2.0, 0.0],  [(PH + 7.32)/2, (PH + 7.32)/2]; color = PITCH_LINE, linewidth = lw + 0.5)

# Right goal posts
lines!(ax, [PW + 2.0, PW + 2.0], [(PH - 7.32)/2, (PH + 7.32)/2]; color = PITCH_LINE, linewidth = lw + 0.5)
lines!(ax, [PW, PW + 2.0], [(PH - 7.32)/2, (PH - 7.32)/2]; color = PITCH_LINE, linewidth = lw + 0.5)
lines!(ax, [PW, PW + 2.0], [(PH + 7.32)/2, (PH + 7.32)/2]; color = PITCH_LINE, linewidth = lw + 0.5)

# Pitch-third dividers (subtle dashed lines) and zone labels for tactical context
divider_color = RGBAf(PITCH_LINE.r, PITCH_LINE.g, PITCH_LINE.b, 0.28)
lines!(ax, [35.0, 35.0], [0.0, PH]; color = divider_color, linewidth = 1.1, linestyle = :dash)
lines!(ax, [70.0, 70.0], [0.0, PH]; color = divider_color, linewidth = 1.1, linestyle = :dash)

# Zone labels (inside pitch, near top edge)
zone_label_color = RGBAf(INK_SOFT.r, INK_SOFT.g, INK_SOFT.b, 0.55)
for (xc, lbl) in [(17.5, "Defensive"), (52.5, "Midfield"), (87.5, "Attacking")]
    text!(ax, xc, PH - 1.5;
        text     = lbl,
        color    = zone_label_color,
        fontsize = 8,
        align    = (:center, :top),
    )
end

# "Shot Zone" annotation near the right penalty arc
text!(ax, 97.5, 56.0;
    text     = "Shot Zone",
    color    = RGBAf(COL_SHOT.r, COL_SHOT.g, COL_SHOT.b, 0.60),
    fontsize = 8,
    align    = (:center, :center),
)

# --- Plot events ------------------------------------------------------------
# Alpha for unsuccessful (lower opacity)
pass_alpha   = [s ? 0.85f0 : 0.30f0 for s in pass_success]
shot_alpha   = [s ? 0.90f0 : 0.35f0 for s in shot_success]
tackle_alpha = [s ? 0.85f0 : 0.30f0 for s in tackle_success]
inter_alpha  = [s ? 0.85f0 : 0.30f0 for s in inter_success]

# Passes — circles with directional arrows
scatter!(ax, pass_x, pass_y;
    color      = [RGBAf(COL_PASS.r, COL_PASS.g, COL_PASS.b, a) for a in pass_alpha],
    marker     = :circle,
    markersize = 9,
    strokewidth = 0.6,
    strokecolor = PITCH_LINE,
)
# Arrows for a subset of passes (every 3rd) — styled by outcome for visual refinement
for i in 1:3:n_pass
    is_succ = pass_success[i]
    arrows!(ax,
        [pass_x[i]], [pass_y[i]],
        [pass_dx[i] * 0.6], [pass_dy[i] * 0.6];
        color     = RGBAf(COL_PASS.r, COL_PASS.g, COL_PASS.b, pass_alpha[i] * (is_succ ? 0.82 : 0.35)),
        arrowsize = is_succ ? 8 : 5,
        linewidth  = is_succ ? 1.3 : 0.5,
    )
end

# Shots — stars with directional arrows
scatter!(ax, shot_x, shot_y;
    color      = [RGBAf(COL_SHOT.r, COL_SHOT.g, COL_SHOT.b, a) for a in shot_alpha],
    marker     = :star5,
    markersize = 18,
    strokewidth = 0.8,
    strokecolor = PITCH_LINE,
)
for i in 1:n_shot
    arrows!(ax,
        [shot_x[i]], [shot_y[i]],
        [shot_dx[i] * 0.7], [shot_dy[i] * 0.7];
        color     = RGBAf(COL_SHOT.r, COL_SHOT.g, COL_SHOT.b, shot_alpha[i] * 0.8),
        arrowsize = 9,
        linewidth  = 1.2,
    )
end

# Tackles — upward triangles
scatter!(ax, tackle_x, tackle_y;
    color      = [RGBAf(COL_TACKLE.r, COL_TACKLE.g, COL_TACKLE.b, a) for a in tackle_alpha],
    marker     = :utriangle,
    markersize = 12,
    strokewidth = 0.6,
    strokecolor = PITCH_LINE,
)

# Interceptions — diamonds
scatter!(ax, inter_x, inter_y;
    color      = [RGBAf(COL_INTERCEPTION.r, COL_INTERCEPTION.g, COL_INTERCEPTION.b, a) for a in inter_alpha],
    marker     = :diamond,
    markersize = 12,
    strokewidth = 0.6,
    strokecolor = PITCH_LINE,
)

# Set axis limits with small padding for goals
xlims!(ax, -4, PW + 4)
ylims!(ax, -3, PH + 3)

# --- Legend -----------------------------------------------------------------
leg_elements = [
    MarkerElement(color = COL_PASS,         marker = :circle,    markersize = 14, strokewidth = 0.5, strokecolor = INK_SOFT),
    MarkerElement(color = COL_SHOT,         marker = :star5,     markersize = 18, strokewidth = 0.5, strokecolor = INK_SOFT),
    MarkerElement(color = COL_TACKLE,       marker = :utriangle, markersize = 14, strokewidth = 0.5, strokecolor = INK_SOFT),
    MarkerElement(color = COL_INTERCEPTION, marker = :diamond,   markersize = 14, strokewidth = 0.5, strokecolor = INK_SOFT),
]
leg_labels = ["Pass (n=$n_pass)", "Shot (n=$n_shot)", "Tackle (n=$n_tackle)", "Interception (n=$n_inter)"]

Legend(
    fig[1, 2], leg_elements, leg_labels;
    framecolor   = INK_SOFT,
    framevisible = true,
    backgroundcolor = ELEVATED_BG,
    labelcolor   = INK,
    titlecolor   = INK,
    title        = "Event Type\n(filled = successful)",
    titlesize    = 13,
    labelsize    = 12,
    rowgap       = 6,
    padding      = (10, 10, 8, 8),
)

# Outcome note
text!(ax, 52.5, -2.0;
    text      = "Filled = successful · Faded = unsuccessful",
    color     = INK_MUTED,
    fontsize  = 12,
    align     = (:center, :top),
)

colsize!(fig.layout, 1, Relative(0.82))

# --- Save -------------------------------------------------------------------
save("plot-$(THEME).png", fig; px_per_unit = 2)
Runnable source as JSON, for any HTTP client: https://api.anyplot.ai/specs/scatter-pitch-events/makie/code. Any spec id and library id listed in llms-full.txt fit the same URL shape; every URL below is complete and callable.
{
  "spec_id": "scatter-pitch-events",
  "language": "julia",
  "library": "makie",
  "page": "https://anyplot.ai/scatter-pitch-events/julia/makie",
  "hub": "https://anyplot.ai/scatter-pitch-events",
  "code_json": "https://api.anyplot.ai/specs/scatter-pitch-events/makie/code",
  "spec_json": "https://api.anyplot.ai/specs/scatter-pitch-events",
  "render_light_png": "https://storage.googleapis.com/anyplot-images/plots/scatter-pitch-events/julia/makie/plot-light.png",
  "render_dark_png": "https://storage.googleapis.com/anyplot-images/plots/scatter-pitch-events/julia/makie/plot-dark.png",
  "quality_score": 93.0,
  "license": "MIT",
  "guide": "https://anyplot.ai/llms.txt"
}
Part of Soccer Pitch Event Map on anyplot.ai.