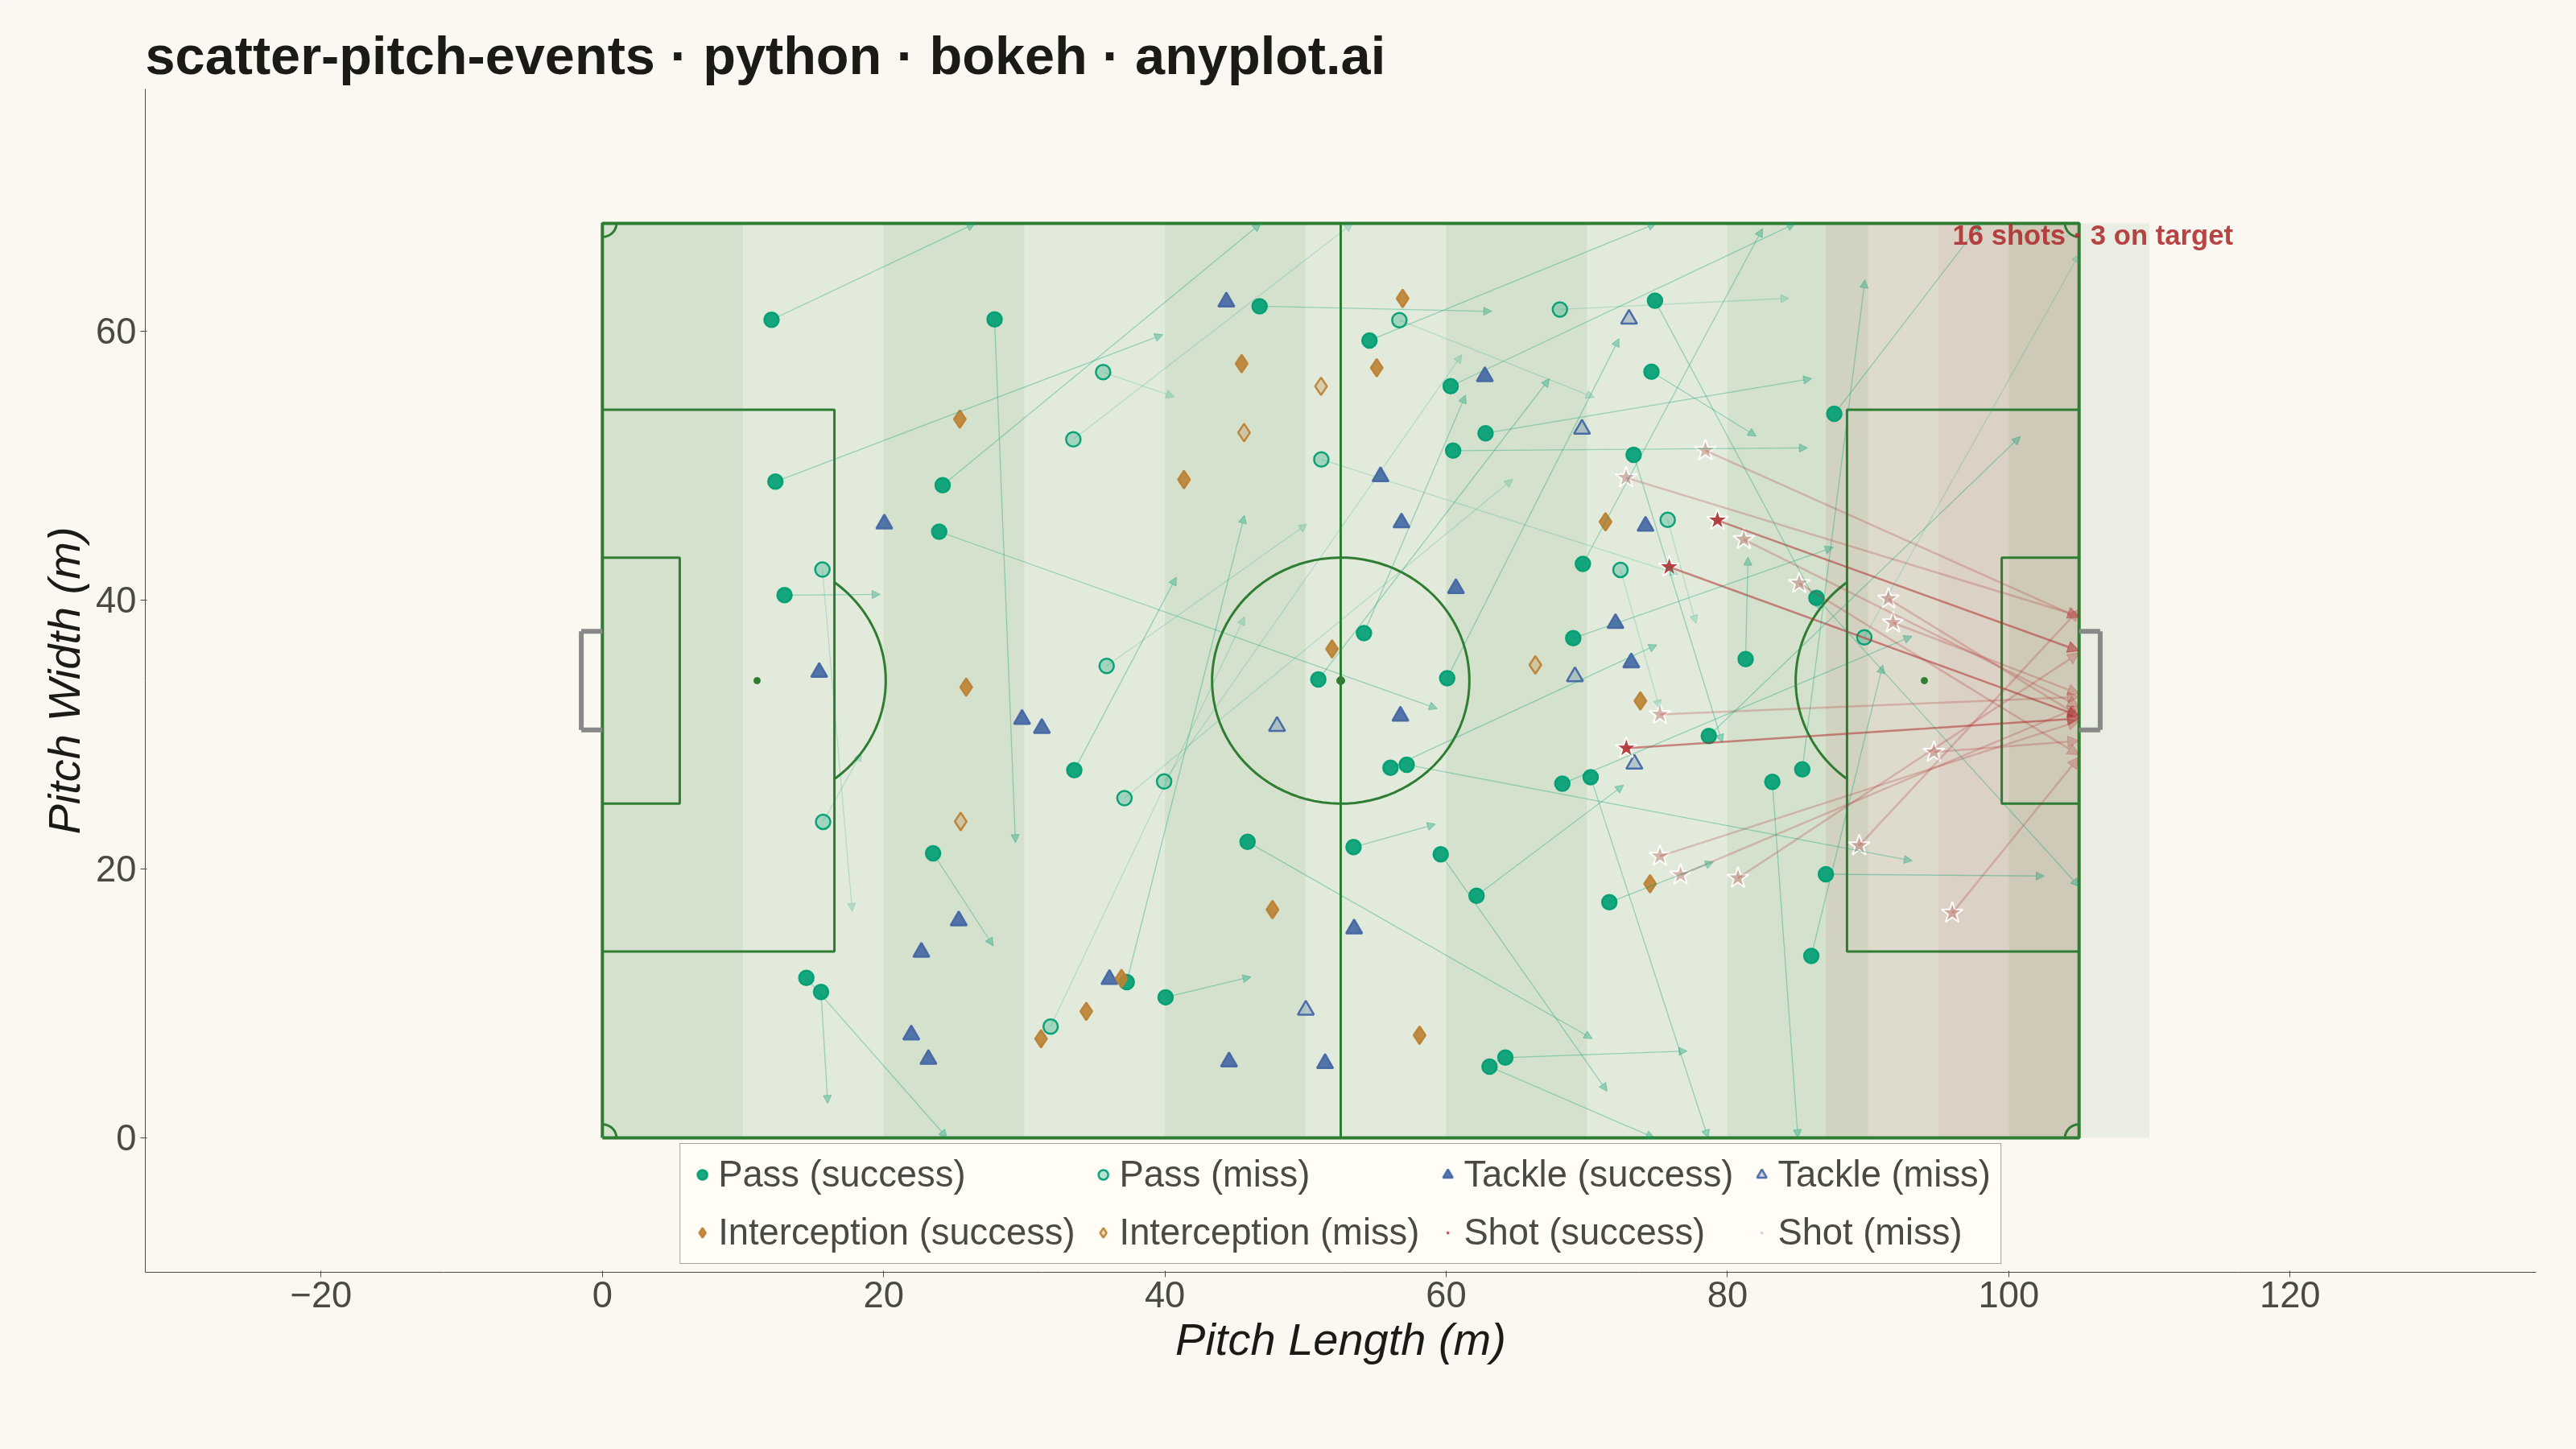
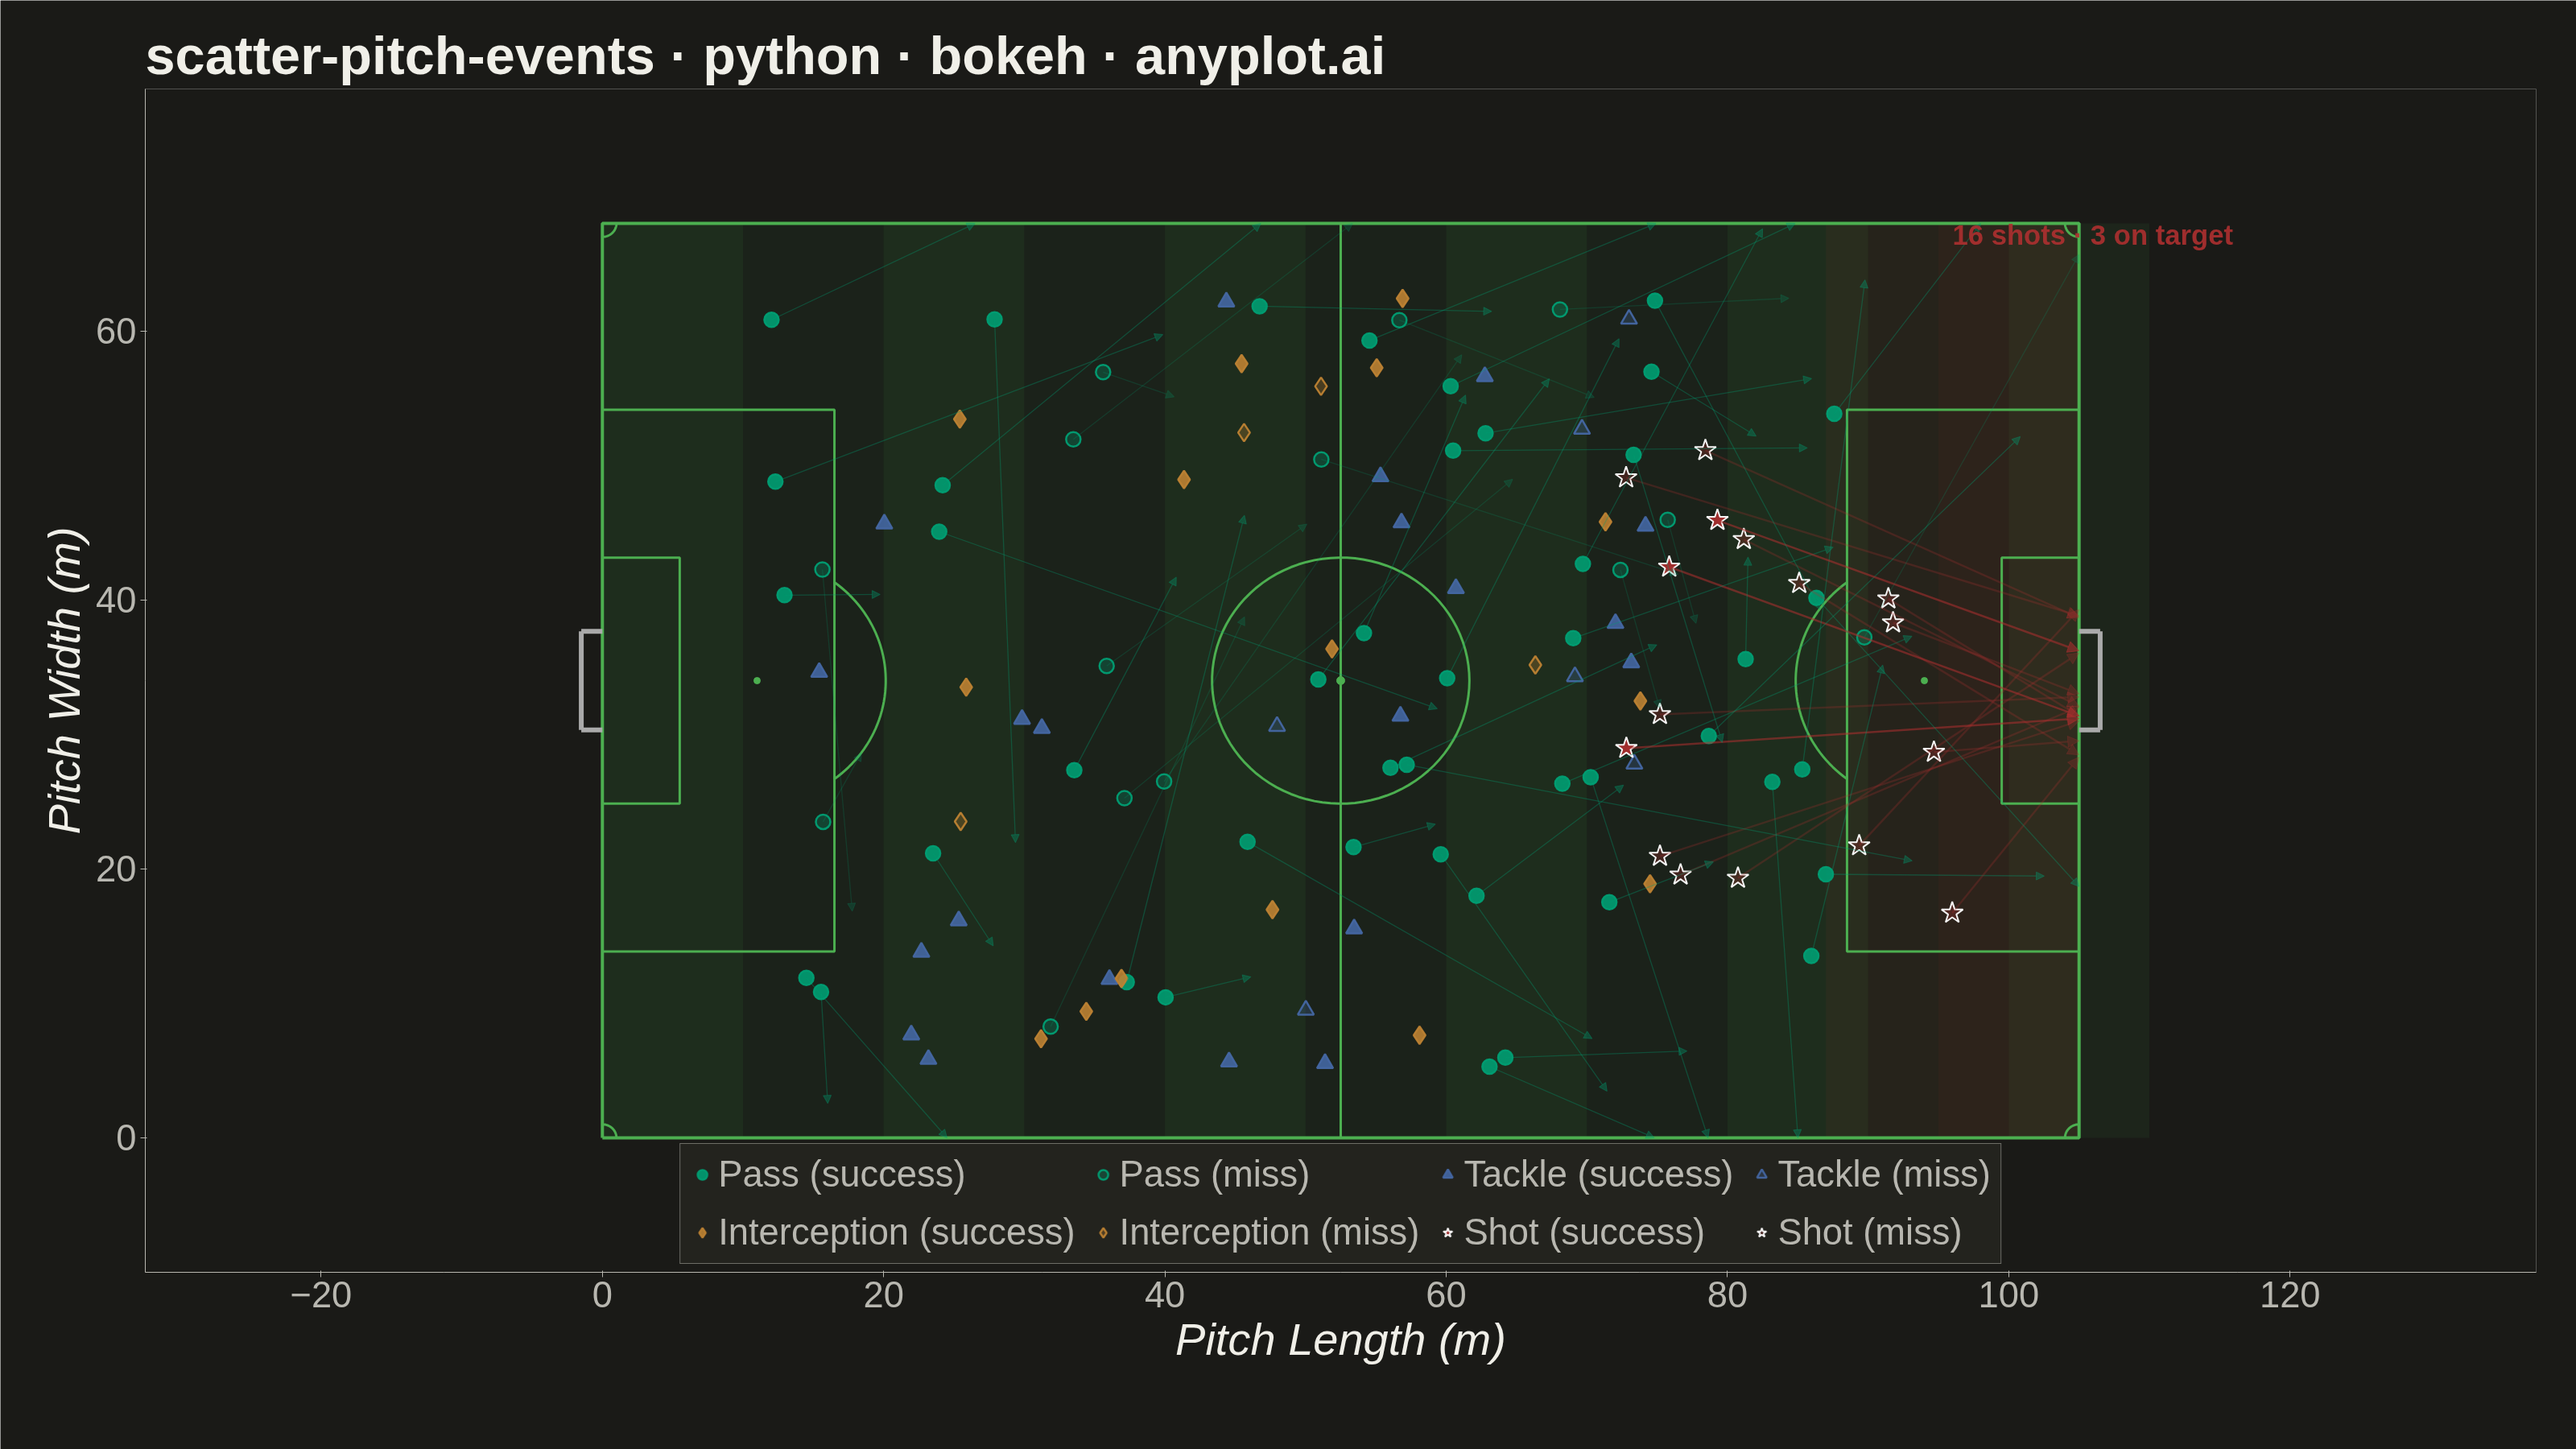
A soccer pitch event map positions match events (passes, shots, tackles, interceptions) as markers on an accurately scaled football pitch diagram. The pitch is drawn with standard markings including penalty areas, center circle, goal areas, and halfway line. Each event type uses distinct markers and colors, with directional arrows for passes and shots. This visualization is essential for tactical match analysis, scouting, and coaching in football analytics.
""" anyplot.ai
scatter-pitch-events: Soccer Pitch Event Map
Library: bokeh 3.9.1 | Python 3.13.14
Quality: 88/100 | Updated: 2026-06-21
"""

import os
import sys


# Prevent self-import: this file is named bokeh.py, which shadows the installed
# bokeh package when its directory sits at the front of sys.path.
_this_dir = os.path.dirname(os.path.abspath(__file__))
sys.path = [p for p in sys.path if os.path.abspath(p or ".") != _this_dir]

import time
from pathlib import Path

import numpy as np
import pandas as pd
from bokeh.io import output_file, save
from bokeh.models import Arrow, ColumnDataSource, Label, NormalHead, Range1d
from bokeh.plotting import figure
from selenium import webdriver
from selenium.webdriver.chrome.options import Options


# Theme tokens (see prompts/default-style-guide.md "Theme-adaptive Chrome")
THEME = os.getenv("ANYPLOT_THEME", "light")
PAGE_BG = "#FAF8F1" if THEME == "light" else "#1A1A17"
ELEVATED_BG = "#FFFDF6" if THEME == "light" else "#242420"
INK = "#1A1A17" if THEME == "light" else "#F0EFE8"
INK_SOFT = "#4A4A44" if THEME == "light" else "#B8B7B0"

# Imprint palette — semantic assignments for soccer event types
PASS_COLOR = "#009E73"  # position 1 (brand green) — passes, first series
SHOT_COLOR = "#AE3030"  # position 5 (matte red) — shots, danger/goal semantic
TACKLE_COLOR = "#4467A3"  # position 3 (blue) — tackles
INTERCEPT_COLOR = "#BD8233"  # position 4 (ochre) — interceptions

event_colors = {"pass": PASS_COLOR, "shot": SHOT_COLOR, "tackle": TACKLE_COLOR, "interception": INTERCEPT_COLOR}
event_markers = {"pass": "circle", "shot": "star", "tackle": "triangle", "interception": "diamond"}
event_sizes = {"pass": 18, "shot": 28, "tackle": 20, "interception": 22}

# Data
np.random.seed(42)
n_events = 120

event_types = np.random.choice(["pass", "shot", "tackle", "interception"], size=n_events, p=[0.45, 0.15, 0.22, 0.18])

x_start = np.zeros(n_events)
y_start = np.zeros(n_events)
x_end = np.zeros(n_events)
y_end = np.zeros(n_events)
outcomes = []

for i, etype in enumerate(event_types):
    if etype == "pass":
        x_start[i] = np.random.uniform(10, 90)
        y_start[i] = np.random.uniform(5, 63)
        angle = np.random.uniform(-np.pi / 2, np.pi / 2)
        dist = np.random.uniform(5, 40)
        x_end[i] = np.clip(x_start[i] + dist * np.cos(angle), 0, 105)
        y_end[i] = np.clip(y_start[i] + dist * np.sin(angle), 0, 68)
        outcomes.append(np.random.choice(["successful", "unsuccessful"], p=[0.78, 0.22]))
    elif etype == "shot":
        x_start[i] = np.random.uniform(70, 100)
        y_start[i] = np.random.uniform(15, 53)
        x_end[i] = 105
        y_end[i] = np.random.uniform(28, 40)
        outcomes.append(np.random.choice(["successful", "unsuccessful"], p=[0.30, 0.70]))
    elif etype == "tackle":
        x_start[i] = np.random.uniform(15, 75)
        y_start[i] = np.random.uniform(5, 63)
        x_end[i] = x_start[i]
        y_end[i] = y_start[i]
        outcomes.append(np.random.choice(["successful", "unsuccessful"], p=[0.65, 0.35]))
    else:
        x_start[i] = np.random.uniform(20, 80)
        y_start[i] = np.random.uniform(5, 63)
        x_end[i] = x_start[i]
        y_end[i] = y_start[i]
        outcomes.append(np.random.choice(["successful", "unsuccessful"], p=[0.72, 0.28]))

outcomes = np.array(outcomes)
df = pd.DataFrame(
    {"x": x_start, "y": y_start, "x_end": x_end, "y_end": y_end, "event_type": event_types, "outcome": outcomes}
)

# Pitch styling (theme-adaptive)
PITCH_FILL = "#3d8b45" if THEME == "light" else "#2a6030"
PITCH_LINE = "#2E7D32" if THEME == "light" else "#4CAF50"
GOAL_COLOR = "#888888" if THEME == "light" else "#AAAAAA"

# Plot — 3200x1800 landscape, toolbar disabled to avoid height drift.
# match_aspect=True would resize the canvas to enforce equal axis scales, breaking
# the 3200x1800 contract. Instead, data ranges are chosen so that
# x_range/y_range ≈ (3200-230)/(1800-270) = 2970/1530 ≈ 1.941, giving equal
# pixels-per-meter on both axes without distorting the pitch geometry.
p = figure(
    width=3200,
    height=1800,
    title="scatter-pitch-events · python · bokeh · anyplot.ai",
    x_range=Range1d(-32.5, 137.5),
    y_range=Range1d(-10, 78),
    toolbar_location=None,
    min_border_bottom=220,
    min_border_left=180,
    min_border_top=110,
    min_border_right=50,
)

# Pitch background
p.rect(x=52.5, y=34, width=105, height=68, fill_color=PITCH_FILL, fill_alpha=0.12, line_color=None)

# Mow-pattern stripes
for stripe_x in range(0, 105, 10):
    stripe_alpha = 0.08 if (stripe_x // 10) % 2 == 0 else 0.0
    p.rect(x=stripe_x + 5, y=34, width=10, height=68, fill_color=PITCH_LINE, fill_alpha=stripe_alpha, line_color=None)

# Danger zone gradient (attacking third)
p.rect(x=96, y=34, width=18, height=68, fill_color=SHOT_COLOR, fill_alpha=0.08, line_color=None)
p.rect(x=100, y=34, width=10, height=68, fill_color=SHOT_COLOR, fill_alpha=0.05, line_color=None)

# Pitch outline
p.line([0, 105, 105, 0, 0], [0, 0, 68, 68, 0], line_color=PITCH_LINE, line_width=4)

# Halfway line
p.line([52.5, 52.5], [0, 68], line_color=PITCH_LINE, line_width=3)

# Center circle and spot
theta = np.linspace(0, 2 * np.pi, 100)
p.line(52.5 + 9.15 * np.cos(theta), 34 + 9.15 * np.sin(theta), line_color=PITCH_LINE, line_width=3)
p.scatter([52.5], [34], size=10, color=PITCH_LINE)

# Penalty areas
p.line([0, 16.5, 16.5, 0], [13.85, 13.85, 54.15, 54.15], line_color=PITCH_LINE, line_width=3)
p.line([105, 88.5, 88.5, 105], [13.85, 13.85, 54.15, 54.15], line_color=PITCH_LINE, line_width=3)

# Goal areas
p.line([0, 5.5, 5.5, 0], [24.85, 24.85, 43.15, 43.15], line_color=PITCH_LINE, line_width=3)
p.line([105, 99.5, 99.5, 105], [24.85, 24.85, 43.15, 43.15], line_color=PITCH_LINE, line_width=3)

# Penalty spots and arcs
p.scatter([11, 94], [34, 34], size=8, color=PITCH_LINE)
arc_theta = np.linspace(-0.93, 0.93, 50)
p.line(11 + 9.15 * np.cos(arc_theta), 34 + 9.15 * np.sin(arc_theta), line_color=PITCH_LINE, line_width=3)
p.line(94 - 9.15 * np.cos(arc_theta), 34 + 9.15 * np.sin(arc_theta), line_color=PITCH_LINE, line_width=3)

# Corner arcs
for cx, cy, a0, a1 in [
    (0, 0, 0, np.pi / 2),
    (105, 0, np.pi / 2, np.pi),
    (105, 68, np.pi, 3 * np.pi / 2),
    (0, 68, 3 * np.pi / 2, 2 * np.pi),
]:
    ca = np.linspace(a0, a1, 25)
    p.line(cx + 1 * np.cos(ca), cy + 1 * np.sin(ca), line_color=PITCH_LINE, line_width=3)

# Goal posts
p.line([-1.5, 0], [30.34, 30.34], line_color=GOAL_COLOR, line_width=6)
p.line([-1.5, 0], [37.66, 37.66], line_color=GOAL_COLOR, line_width=6)
p.line([-1.5, -1.5], [30.34, 37.66], line_color=GOAL_COLOR, line_width=6)
p.line([105, 106.5], [30.34, 30.34], line_color=GOAL_COLOR, line_width=6)
p.line([105, 106.5], [37.66, 37.66], line_color=GOAL_COLOR, line_width=6)
p.line([106.5, 106.5], [30.34, 37.66], line_color=GOAL_COLOR, line_width=6)

# Directional arrows for passes and shots
arrow_data = df[df["event_type"].isin(["pass", "shot"])]
for _, row in arrow_data.iterrows():
    color = event_colors[row["event_type"]]
    is_pass = row["event_type"] == "pass"
    alpha = (
        (0.35 if row["outcome"] == "successful" else 0.20)
        if is_pass
        else (0.55 if row["outcome"] == "successful" else 0.25)
    )
    lw = 2.5 if row["event_type"] == "shot" else 1.3
    head_size = 14 if row["event_type"] == "shot" else 10
    p.add_layout(
        Arrow(
            end=NormalHead(size=head_size, fill_color=color, fill_alpha=alpha, line_color=color, line_alpha=alpha),
            x_start=row["x"],
            y_start=row["y"],
            x_end=row["x_end"],
            y_end=row["y_end"],
            line_color=color,
            line_alpha=alpha,
            line_width=lw,
        )
    )

# Event markers — shots drawn last for visual emphasis
for etype in ["pass", "tackle", "interception", "shot"]:
    for outcome in ["successful", "unsuccessful"]:
        mask = (df["event_type"] == etype) & (df["outcome"] == outcome)
        subset = df[mask]
        if len(subset) == 0:
            continue
        color = event_colors[etype]
        fill_alpha = 0.90 if outcome == "successful" else 0.28
        border_color = "white" if etype == "shot" else color
        line_w = 2 if etype == "shot" else 2.5
        source = ColumnDataSource(data={"x": subset["x"].values, "y": subset["y"].values})
        p.scatter(
            x="x",
            y="y",
            source=source,
            marker=event_markers[etype],
            size=event_sizes[etype],
            fill_color=color,
            fill_alpha=fill_alpha,
            line_color=border_color,
            line_width=line_w,
            line_alpha=0.95,
            legend_label=f"{etype.capitalize()} ({'success' if outcome == 'successful' else 'miss'})",
        )

# Storytelling annotation — danger zone shot summary
shot_data = df[df["event_type"] == "shot"]
n_shots = len(shot_data)
n_on_target = len(shot_data[shot_data["outcome"] == "successful"])
p.add_layout(
    Label(
        x=96,
        y=66,
        text=f"{n_shots} shots · {n_on_target} on target",
        text_font_size="26pt",
        text_color=SHOT_COLOR,
        text_font_style="bold",
        text_alpha=0.9,
    )
)

# Legend — single row to reduce density
p.legend.location = "bottom_center"
p.legend.orientation = "horizontal"
p.legend.label_text_font_size = "34pt"
p.legend.label_text_color = INK_SOFT
p.legend.glyph_width = 30
p.legend.glyph_height = 30
p.legend.spacing = 20
p.legend.padding = 12
p.legend.background_fill_alpha = 0.92
p.legend.background_fill_color = ELEVATED_BG
p.legend.border_line_color = INK_SOFT
p.legend.border_line_width = 1
p.legend.ncols = 4
p.legend.click_policy = "hide"

# Style
p.title.text_font_size = "50pt"
p.title.text_color = INK
p.title.text_font_style = "bold"

p.xaxis.axis_label = "Pitch Length (m)"
p.yaxis.axis_label = "Pitch Width (m)"
p.xaxis.axis_label_text_font_size = "42pt"
p.yaxis.axis_label_text_font_size = "42pt"
p.xaxis.major_label_text_font_size = "34pt"
p.yaxis.major_label_text_font_size = "34pt"
p.xaxis.axis_label_text_color = INK
p.yaxis.axis_label_text_color = INK
p.xaxis.major_label_text_color = INK_SOFT
p.yaxis.major_label_text_color = INK_SOFT

p.xaxis.axis_line_color = INK_SOFT
p.yaxis.axis_line_color = INK_SOFT
p.xaxis.major_tick_line_color = INK_SOFT
p.yaxis.major_tick_line_color = INK_SOFT
p.xaxis.minor_tick_line_color = None
p.yaxis.minor_tick_line_color = None

p.grid.grid_line_color = None

p.background_fill_color = PAGE_BG
p.border_fill_color = PAGE_BG
p.outline_line_color = None

# Save interactive HTML
output_file(f"plot-{THEME}.html", title="scatter-pitch-events · python · bokeh · anyplot.ai")
save(p)

# Save PNG via Selenium; CDP override forces exact W×H viewport regardless of browser chrome
W, H = 3200, 1800
opts = Options()
for arg in (
    "--headless=new",
    "--no-sandbox",
    "--disable-dev-shm-usage",
    "--disable-gpu",
    f"--window-size={W},{H}",
    "--hide-scrollbars",
):
    opts.add_argument(arg)
driver = webdriver.Chrome(options=opts)
driver.execute_cdp_cmd(
    "Emulation.setDeviceMetricsOverride", {"width": W, "height": H, "deviceScaleFactor": 1, "mobile": False}
)
driver.get(f"file://{Path(f'plot-{THEME}.html').resolve()}")
time.sleep(3)
driver.save_screenshot(f"plot-{THEME}.png")
driver.quit()
Runnable source as JSON, for any HTTP client: https://api.anyplot.ai/specs/scatter-pitch-events/bokeh/code. Any spec id and library id listed in llms-full.txt fit the same URL shape; every URL below is complete and callable.
{
  "spec_id": "scatter-pitch-events",
  "language": "python",
  "library": "bokeh",
  "page": "https://anyplot.ai/scatter-pitch-events/python/bokeh",
  "hub": "https://anyplot.ai/scatter-pitch-events",
  "code_json": "https://api.anyplot.ai/specs/scatter-pitch-events/bokeh/code",
  "spec_json": "https://api.anyplot.ai/specs/scatter-pitch-events",
  "render_light_png": "https://storage.googleapis.com/anyplot-images/plots/scatter-pitch-events/python/bokeh/plot-light.png",
  "render_dark_png": "https://storage.googleapis.com/anyplot-images/plots/scatter-pitch-events/python/bokeh/plot-dark.png",
  "interactive_light_html": "https://storage.googleapis.com/anyplot-images/plots/scatter-pitch-events/python/bokeh/plot-light.html",
  "interactive_dark_html": "https://storage.googleapis.com/anyplot-images/plots/scatter-pitch-events/python/bokeh/plot-dark.html",
  "quality_score": 88.0,
  "license": "MIT",
  "guide": "https://anyplot.ai/llms.txt"
}
Part of Soccer Pitch Event Map on anyplot.ai.