The same plot in 14 other libraries — JavaScript: Chart.js, D3.js, Highcharts, MUI X Charts; Python: Altair, Bokeh, lets-plot, Matplotlib, Plotly, plotnine, Pygal, Seaborn; R: ggplot2; Julia: Makie.jl. Compare all 15 side by side: Soccer Pitch Event Map in Python, R, Julia and JavaScript.
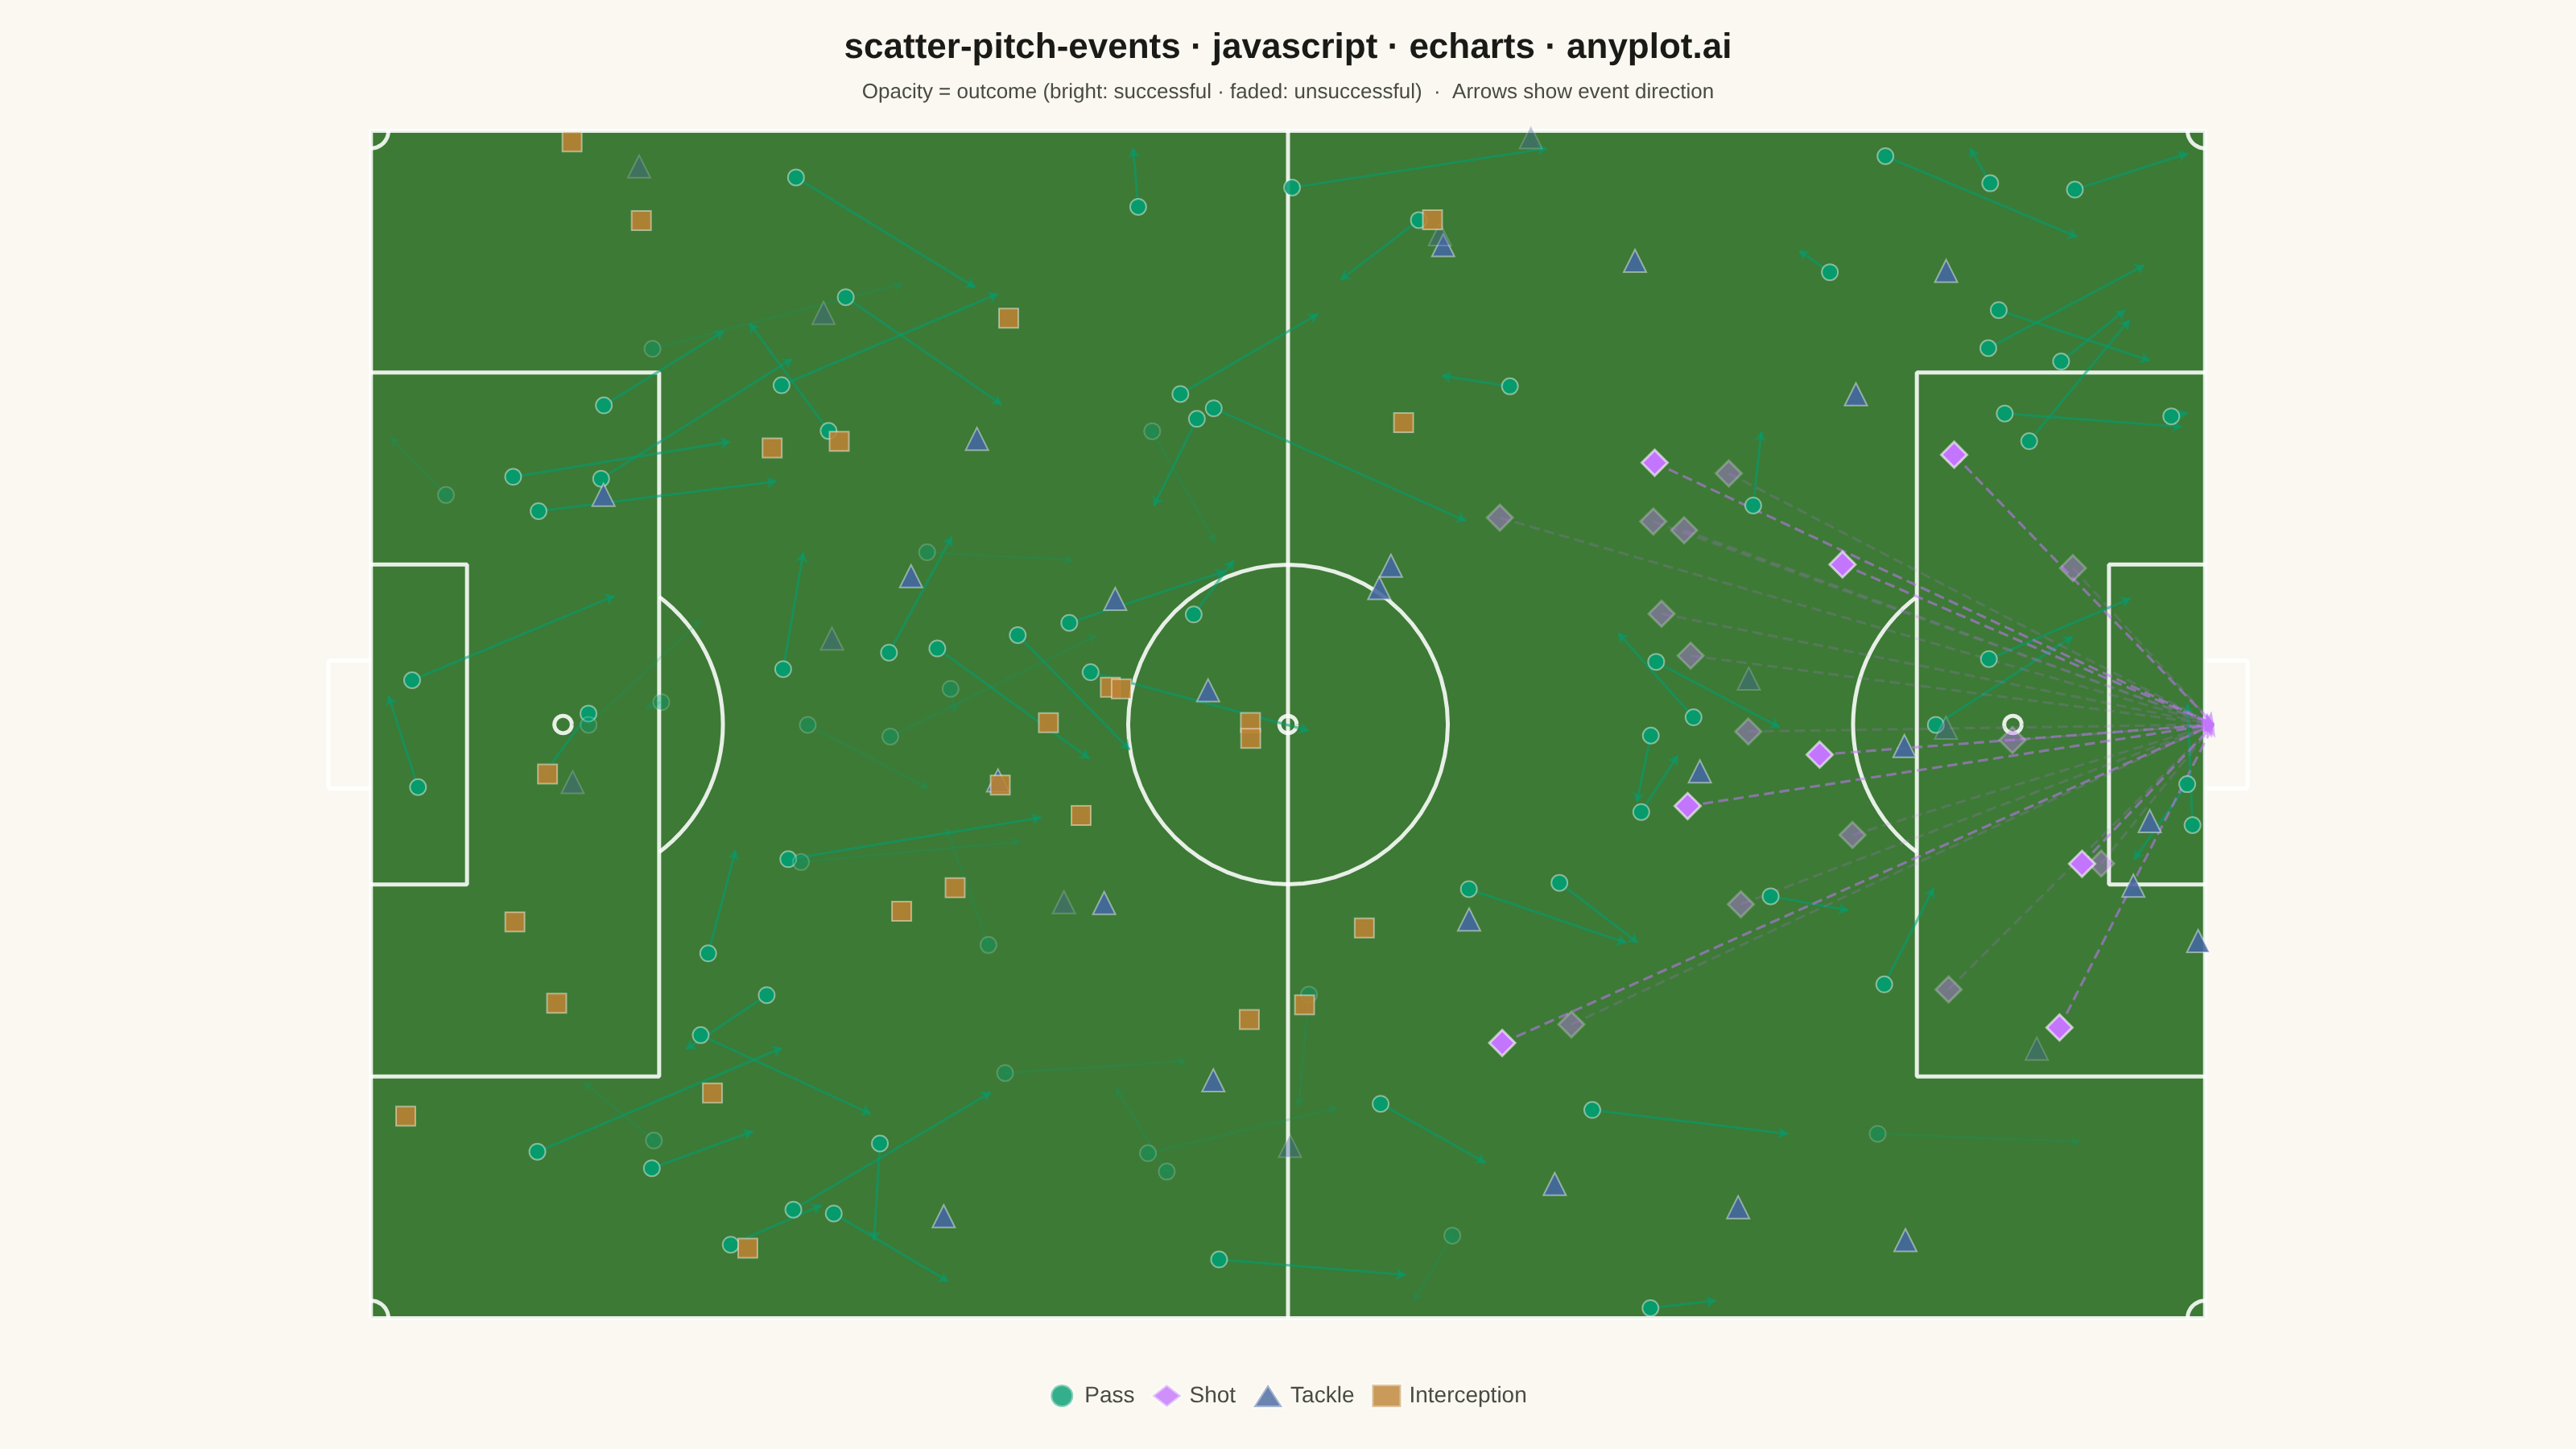
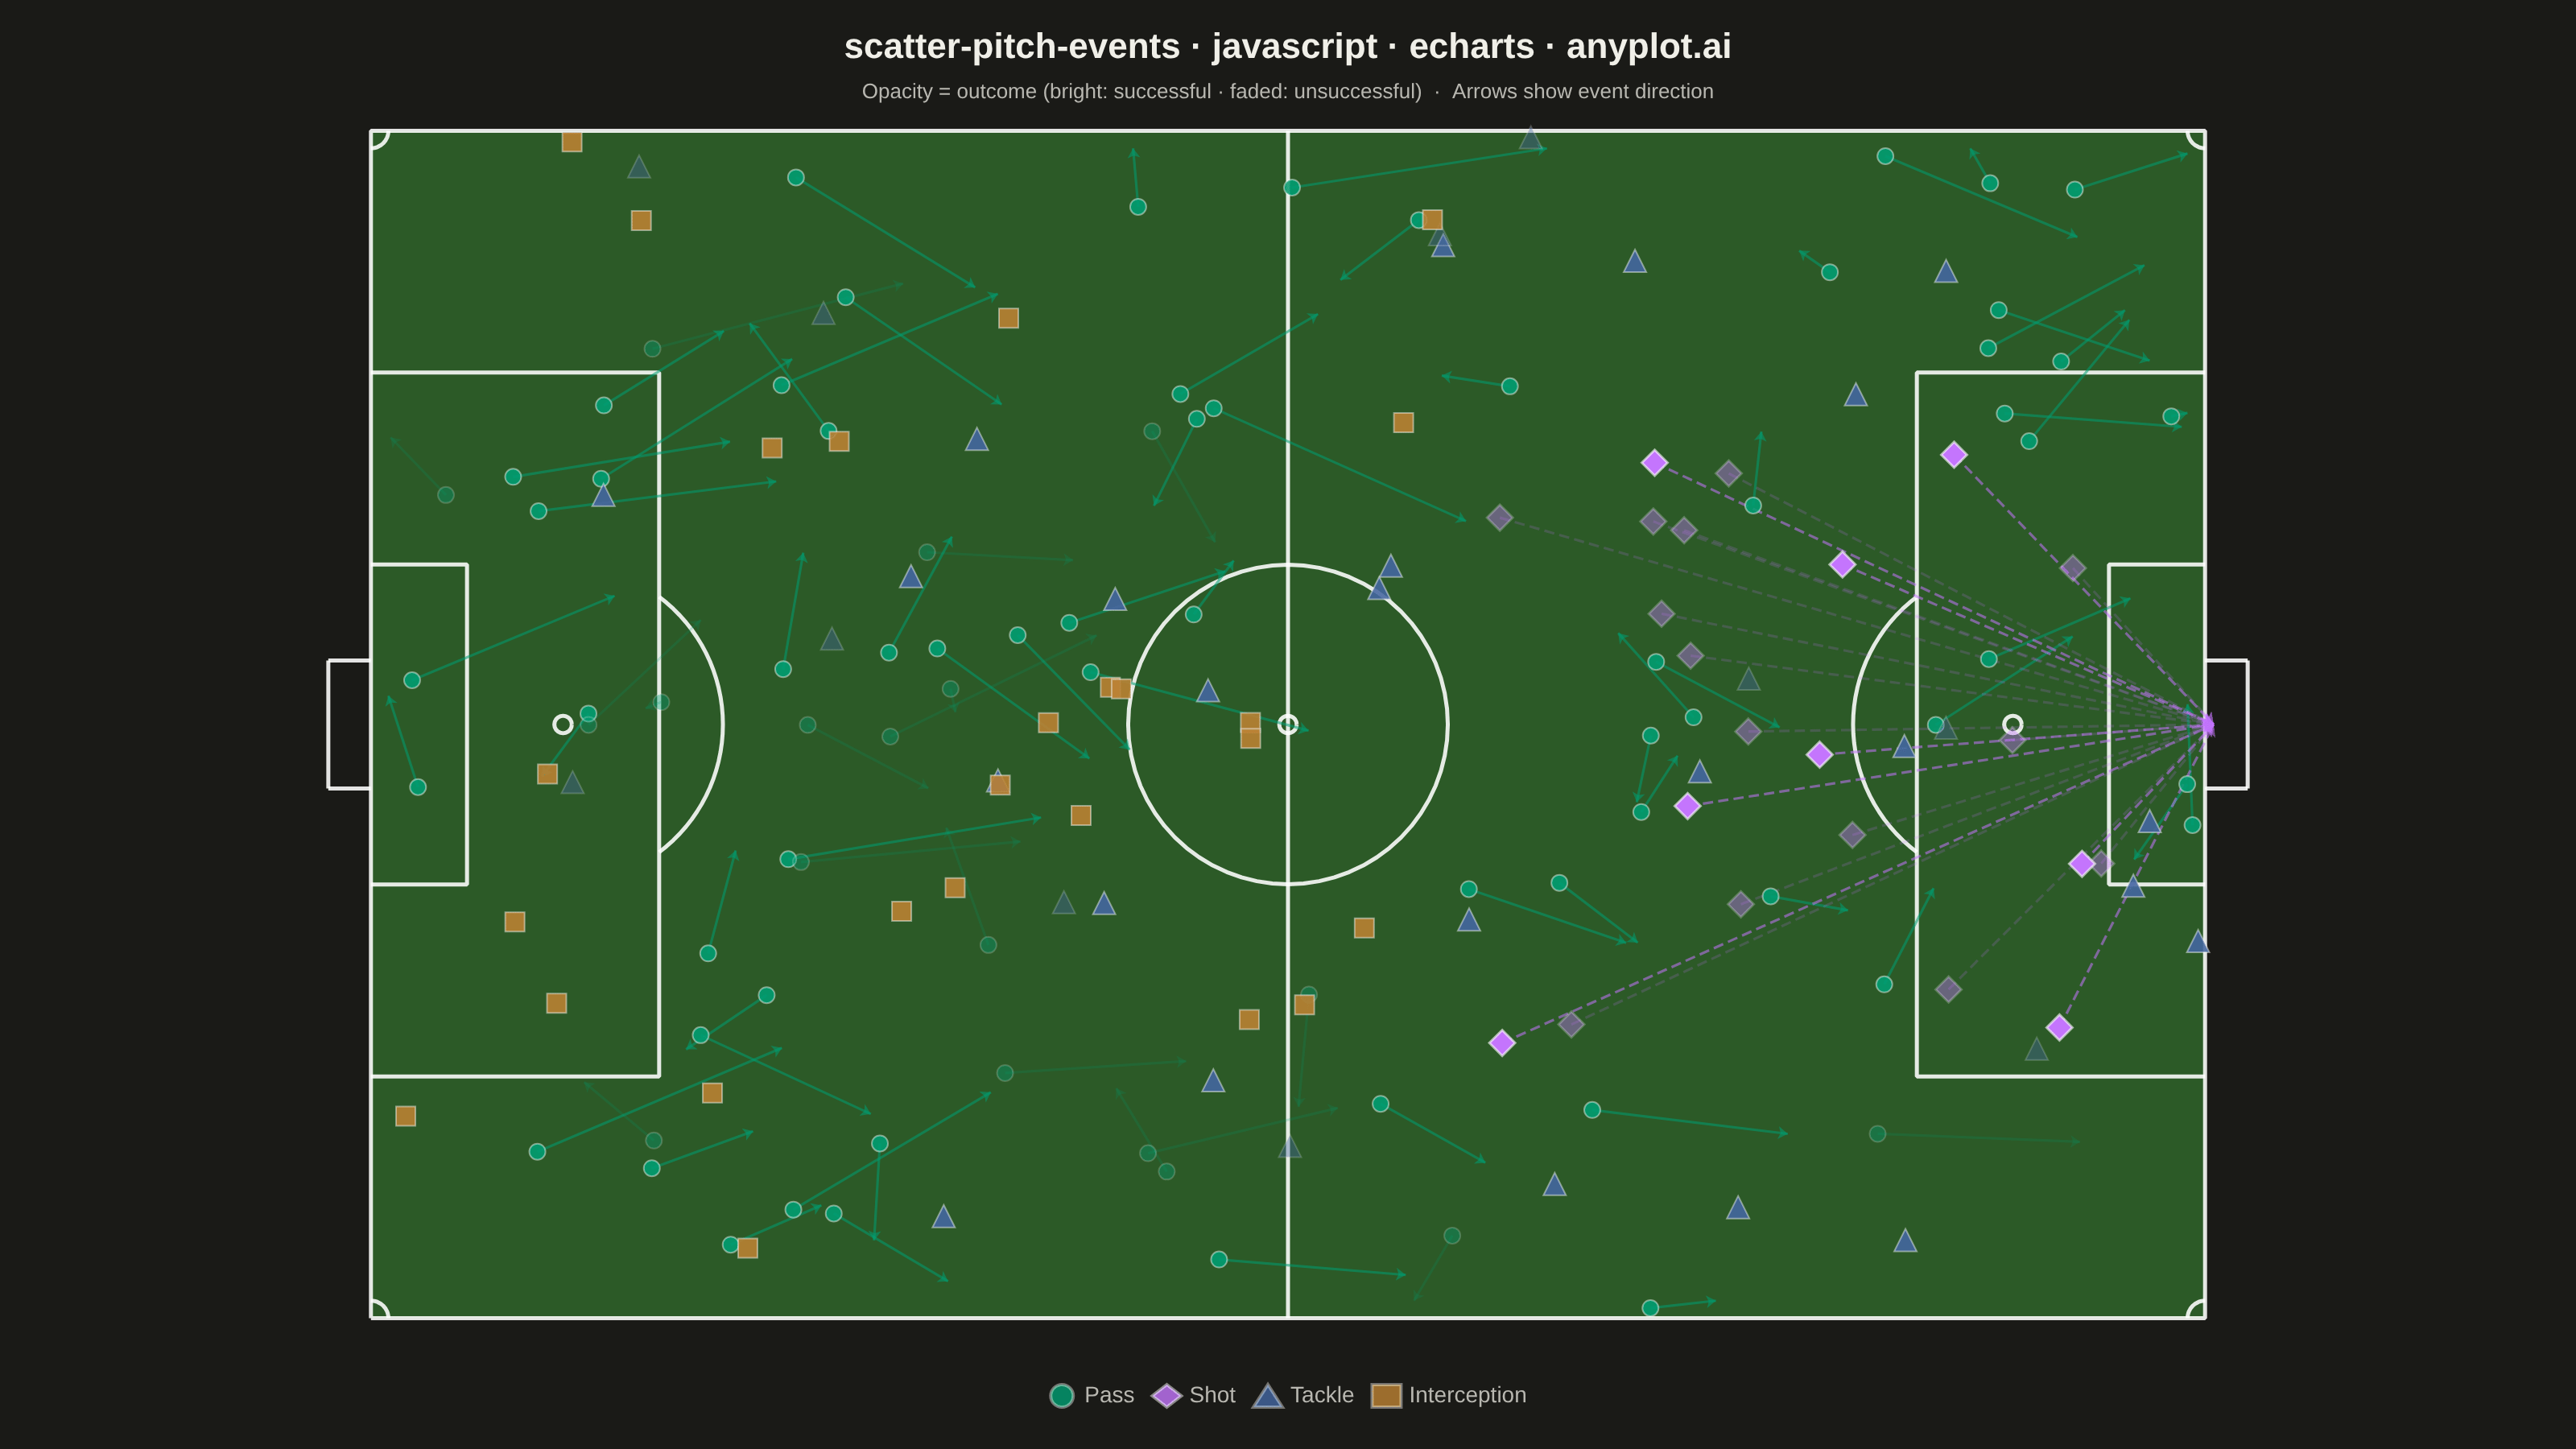
A soccer pitch event map positions match events (passes, shots, tackles, interceptions) as markers on an accurately scaled football pitch diagram. The pitch is drawn with standard markings including penalty areas, center circle, goal areas, and halfway line. Each event type uses distinct markers and colors, with directional arrows for passes and shots. This visualization is essential for tactical match analysis, scouting, and coaching in football analytics.
// anyplot.ai
// scatter-pitch-events: Soccer Pitch Event Map
// Library: echarts 5.5.1 | JavaScript 22.22.3
// Quality: 90/100 | Created: 2026-06-21

const t = window.ANYPLOT_TOKENS;
const THEME = window.ANYPLOT_THEME;

// Seeded LCG for reproducible data
let seed = 42;
function rng() {
  seed = (seed * 1664525 + 1013904223) >>> 0;
  return seed / 4294967296;
}

// Pitch constants (FIFA standard, metres)
const PW = 105, PH = 68;
const PITCH_GREEN = THEME === 'dark' ? '#2C5A27' : '#3D7A35';
const PITCH_LINE  = 'rgba(255,255,255,0.88)';

// Geometry helpers
function circlePts(cx, cy, r, n = 64) {
  const pts = [];
  for (let i = 0; i <= n; i++) {
    const a = (i / n) * 2 * Math.PI;
    pts.push([cx + r * Math.cos(a), cy + r * Math.sin(a)]);
  }
  return pts;
}

function arcPts(cx, cy, r, a0, a1, n = 32) {
  const pts = [];
  for (let i = 0; i <= n; i++) {
    const a = a0 + (i / n) * (a1 - a0);
    pts.push([cx + r * Math.cos(a), cy + r * Math.sin(a)]);
  }
  return pts;
}

function mkLine(data) {
  return {
    type: 'line',
    data,
    symbol: 'none',
    lineStyle: { color: PITCH_LINE, width: 2.5 },
    z: 2,
    silent: true,
    legendHoverLink: false,
    emphasis: { disabled: true },
  };
}

// Pitch marking bounds (FIFA)
const PA_Y1   = (PH - 40.32) / 2;         // 13.84 — penalty area bottom
const PA_Y2   = PH - PA_Y1;               // 54.16 — penalty area top
const GA_Y1   = (PH - 18.32) / 2;         // 24.84 — goal area bottom
const GA_Y2   = PH - GA_Y1;               // 43.16 — goal area top
const PARC    = Math.acos(5.5 / 9.15);    // penalty arc half-angle (~0.926 rad)

const pitchSeries = [
  mkLine([[0,0],[PW,0],[PW,PH],[0,PH],[0,0]]),                  // outer boundary
  mkLine([[PW/2,0],[PW/2,PH]]),                                  // halfway line
  mkLine(circlePts(PW/2, PH/2, 9.15)),                          // center circle
  mkLine(circlePts(PW/2, PH/2, 0.5, 20)),                       // center spot
  mkLine([[0,PA_Y1],[16.5,PA_Y1],[16.5,PA_Y2],[0,PA_Y2]]),      // left penalty area
  mkLine([[0,GA_Y1],[5.5,GA_Y1],[5.5,GA_Y2],[0,GA_Y2]]),        // left goal area
  mkLine(circlePts(11, PH/2, 0.5, 20)),                         // left penalty spot
  mkLine(arcPts(11, PH/2, 9.15, -PARC, PARC)),                  // left penalty arc
  mkLine([[PW,PA_Y1],[88.5,PA_Y1],[88.5,PA_Y2],[PW,PA_Y2]]),    // right penalty area
  mkLine([[PW,GA_Y1],[99.5,GA_Y1],[99.5,GA_Y2],[PW,GA_Y2]]),    // right goal area
  mkLine(circlePts(94, PH/2, 0.5, 20)),                         // right penalty spot
  mkLine(arcPts(94, PH/2, 9.15, Math.PI-PARC, Math.PI+PARC)),  // right penalty arc
  mkLine(arcPts(0,  0,  1, 0,           Math.PI/2)),            // corner arcs
  mkLine(arcPts(PW, 0,  1, Math.PI/2,   Math.PI)),
  mkLine(arcPts(PW, PH, 1, Math.PI,     3*Math.PI/2)),
  mkLine(arcPts(0,  PH, 1, 3*Math.PI/2, 2*Math.PI)),
  mkLine([[-2.44,30.34],[0,30.34]]),                             // left goal
  mkLine([[-2.44,37.66],[0,37.66]]),
  mkLine([[-2.44,30.34],[-2.44,37.66]]),
  mkLine([[PW,30.34],[PW+2.44,30.34]]),                          // right goal
  mkLine([[PW,37.66],[PW+2.44,37.66]]),
  mkLine([[PW+2.44,30.34],[PW+2.44,37.66]]),
];

// Generate event data
const passes = [], shots = [], tackles = [], intercepts = [];

for (let i = 0; i < 80; i++) {
  const x1 = rng() * PW, y1 = rng() * PH;
  const x2 = Math.max(1, Math.min(PW-1, x1 + (rng()-0.25)*20));
  const y2 = Math.max(1, Math.min(PH-1, y1 + (rng()-0.5)*14));
  passes.push({ x1, y1, x2, y2, ok: rng() > 0.28 });
}
for (let i = 0; i < 22; i++) {
  shots.push({ x: 62 + rng()*40, y: 14 + rng()*40, ok: rng() > 0.68 });
}
for (let i = 0; i < 35; i++) {
  tackles.push({ x: rng()*PW, y: rng()*PH, ok: rng() > 0.38 });
}
for (let i = 0; i < 25; i++) {
  intercepts.push({ x: rng()*PW*0.65, y: rng()*PH });
}

// Arrow data for lines series (pass trajectories, shot vectors to goal)
const passArrows = passes.map(p => ({
  coords: [[p.x1,p.y1],[p.x2,p.y2]],
  lineStyle: { opacity: p.ok ? 0.55 : 0.18 },
}));
const shotArrows = shots.map(s => ({
  coords: [[s.x,s.y],[PW+0.5, PH/2]],
  lineStyle: { opacity: s.ok ? 0.55 : 0.18 },
}));

const eventSeries = [
  // Pass arrows
  {
    type: 'lines', coordinateSystem: 'cartesian2d',
    data: passArrows,
    symbol: ['none','arrow'], symbolSize: 6,
    effect: { show: false },
    lineStyle: { color: t.palette[0], width: 1.6 },
    z: 4, silent: true, legendHoverLink: false,
  },
  // Shot trajectories (dashed arrow to goal)
  {
    type: 'lines', coordinateSystem: 'cartesian2d',
    data: shotArrows,
    symbol: ['none','arrow'], symbolSize: 7,
    effect: { show: false },
    lineStyle: { color: t.palette[1], width: 1.6, type: 'dashed' },
    z: 4, silent: true, legendHoverLink: false,
  },
  // Pass markers — circles, palette[0] = #009E73 (first series)
  {
    type: 'scatter', name: 'Pass',
    data: passes.map(p => ({ value: [p.x1,p.y1], itemStyle: { opacity: p.ok ? 0.88 : 0.38 } })),
    symbol: 'circle', symbolSize: 10,
    itemStyle: { color: t.palette[0], borderColor: 'rgba(255,255,255,0.5)', borderWidth: 1 },
    z: 6,
  },
  // Shot markers — diamonds
  {
    type: 'scatter', name: 'Shot',
    data: shots.map(s => ({ value: [s.x,s.y], itemStyle: { opacity: s.ok ? 1.0 : 0.4 } })),
    symbol: 'diamond', symbolSize: 16,
    itemStyle: { color: t.palette[1], borderColor: 'rgba(255,255,255,0.6)', borderWidth: 1.5 },
    z: 7,
  },
  // Tackle markers — triangles
  {
    type: 'scatter', name: 'Tackle',
    data: tackles.map(s => ({ value: [s.x,s.y], itemStyle: { opacity: s.ok ? 0.88 : 0.38 } })),
    symbol: 'triangle', symbolSize: 14,
    itemStyle: { color: t.palette[2], borderColor: 'rgba(255,255,255,0.5)', borderWidth: 1 },
    z: 6,
  },
  // Interception markers — squares
  {
    type: 'scatter', name: 'Interception',
    data: intercepts.map(s => ({ value: [s.x,s.y], itemStyle: { opacity: 0.88 } })),
    symbol: 'rect', symbolSize: 12,
    itemStyle: { color: t.palette[3], borderColor: 'rgba(255,255,255,0.5)', borderWidth: 1 },
    z: 6,
  },
];

// Pitch surface background via markArea on empty scatter
const bgSeries = {
  type: 'scatter',
  data: [],
  z: 0, silent: true, legendHoverLink: false,
  markArea: {
    silent: true, z: 0,
    itemStyle: { color: PITCH_GREEN, opacity: 1, borderWidth: 0 },
    emphasis: { disabled: true },
    data: [[{ coord: [0,0] }, { coord: [PW,PH] }]],
  },
};

// Aspect ratio: X range (-4 to 109) = 113 units, Y range (-1.5 to 69.5) = 71 units
// CSS mount 1600×900; grid top/bottom = 65 each → grid H = 770 px
// Grid W = 770 × (113/71) = 1226 → left/right margin = (1600-1226)/2 = 187
const chart = echarts.init(document.getElementById('container'));

chart.setOption({
  animation: false,
  color: t.palette,
  backgroundColor: t.pageBg,

  title: {
    text: 'scatter-pitch-events · javascript · echarts · anyplot.ai',
    subtext: 'Opacity = outcome (bright: successful · faded: unsuccessful)  ·  Arrows show event direction',
    left: 'center',
    top: 14,
    textStyle: { color: t.ink, fontSize: 22, fontWeight: 'bold' },
    subtextStyle: { color: t.inkSoft, fontSize: 13 },
  },

  legend: {
    data: ['Pass', 'Shot', 'Tackle', 'Interception'],
    bottom: 20,
    textStyle: { color: t.inkSoft, fontSize: 14 },
    itemWidth: 18, itemHeight: 14,
  },

  tooltip: {
    trigger: 'item',
    formatter: p => {
      if (!['Pass','Shot','Tackle','Interception'].includes(p.seriesName)) return '';
      return `${p.seriesName}<br/>x: ${p.value[0].toFixed(1)}m, y: ${p.value[1].toFixed(1)}m`;
    },
  },

  grid: { left: 187, right: 187, top: 65, bottom: 65 },

  xAxis: {
    type: 'value', min: -4, max: 109,
    show: false, splitLine: { show: false },
  },
  yAxis: {
    type: 'value', min: -1.5, max: 69.5,
    show: false, splitLine: { show: false },
  },

  series: [bgSeries, ...pitchSeries, ...eventSeries],
});
Runnable source as JSON, for any HTTP client: https://api.anyplot.ai/specs/scatter-pitch-events/echarts/code. Any spec id and library id listed in llms-full.txt fit the same URL shape; every URL below is complete and callable.
{
  "spec_id": "scatter-pitch-events",
  "language": "javascript",
  "library": "echarts",
  "page": "https://anyplot.ai/scatter-pitch-events/javascript/echarts",
  "hub": "https://anyplot.ai/scatter-pitch-events",
  "code_json": "https://api.anyplot.ai/specs/scatter-pitch-events/echarts/code",
  "spec_json": "https://api.anyplot.ai/specs/scatter-pitch-events",
  "render_light_png": "https://storage.googleapis.com/anyplot-images/plots/scatter-pitch-events/javascript/echarts/plot-light.png",
  "render_dark_png": "https://storage.googleapis.com/anyplot-images/plots/scatter-pitch-events/javascript/echarts/plot-dark.png",
  "interactive_light_html": "https://storage.googleapis.com/anyplot-images/plots/scatter-pitch-events/javascript/echarts/plot-light.html",
  "interactive_dark_html": "https://storage.googleapis.com/anyplot-images/plots/scatter-pitch-events/javascript/echarts/plot-dark.html",
  "quality_score": 90.0,
  "license": "MIT",
  "guide": "https://anyplot.ai/llms.txt"
}
Part of Soccer Pitch Event Map on anyplot.ai.