The same plot in 14 other libraries — JavaScript: Chart.js, D3.js, Apache ECharts, MUI X Charts; Python: Altair, Bokeh, lets-plot, Matplotlib, Plotly, plotnine, Pygal, Seaborn; R: ggplot2; Julia: Makie.jl. Compare all 15 side by side: Soccer Pitch Event Map in Python, R, Julia and JavaScript.
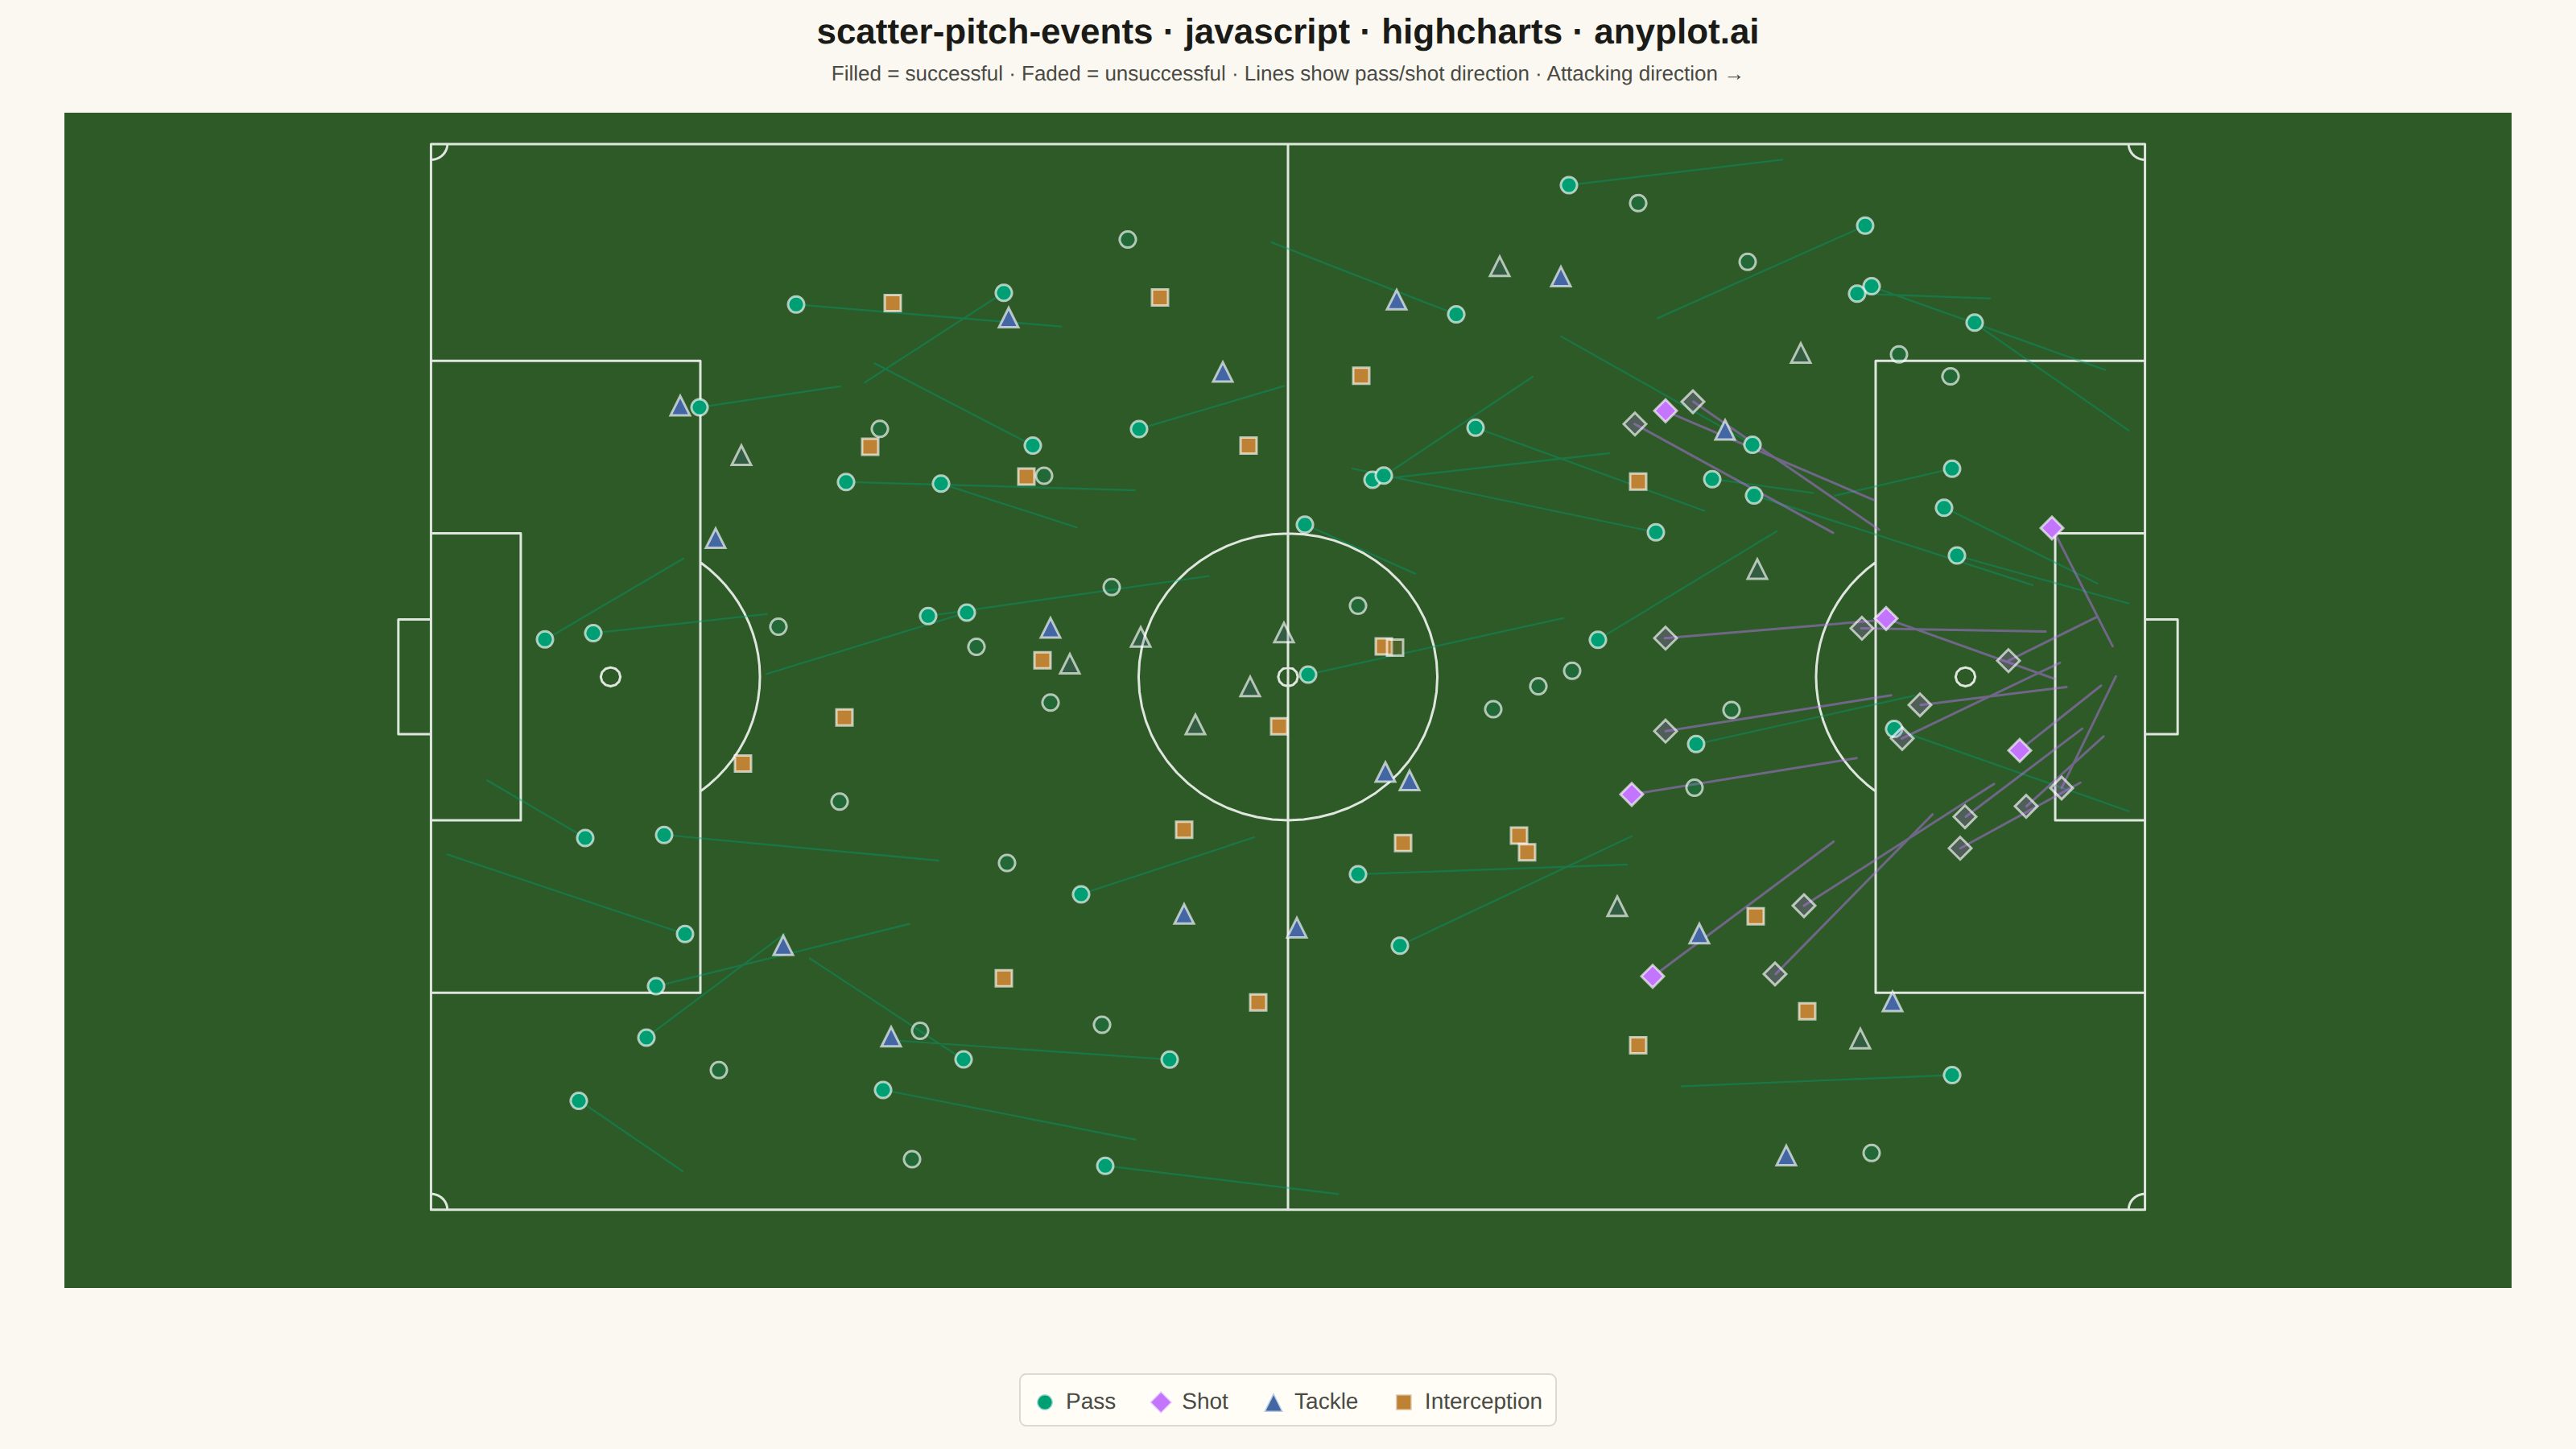
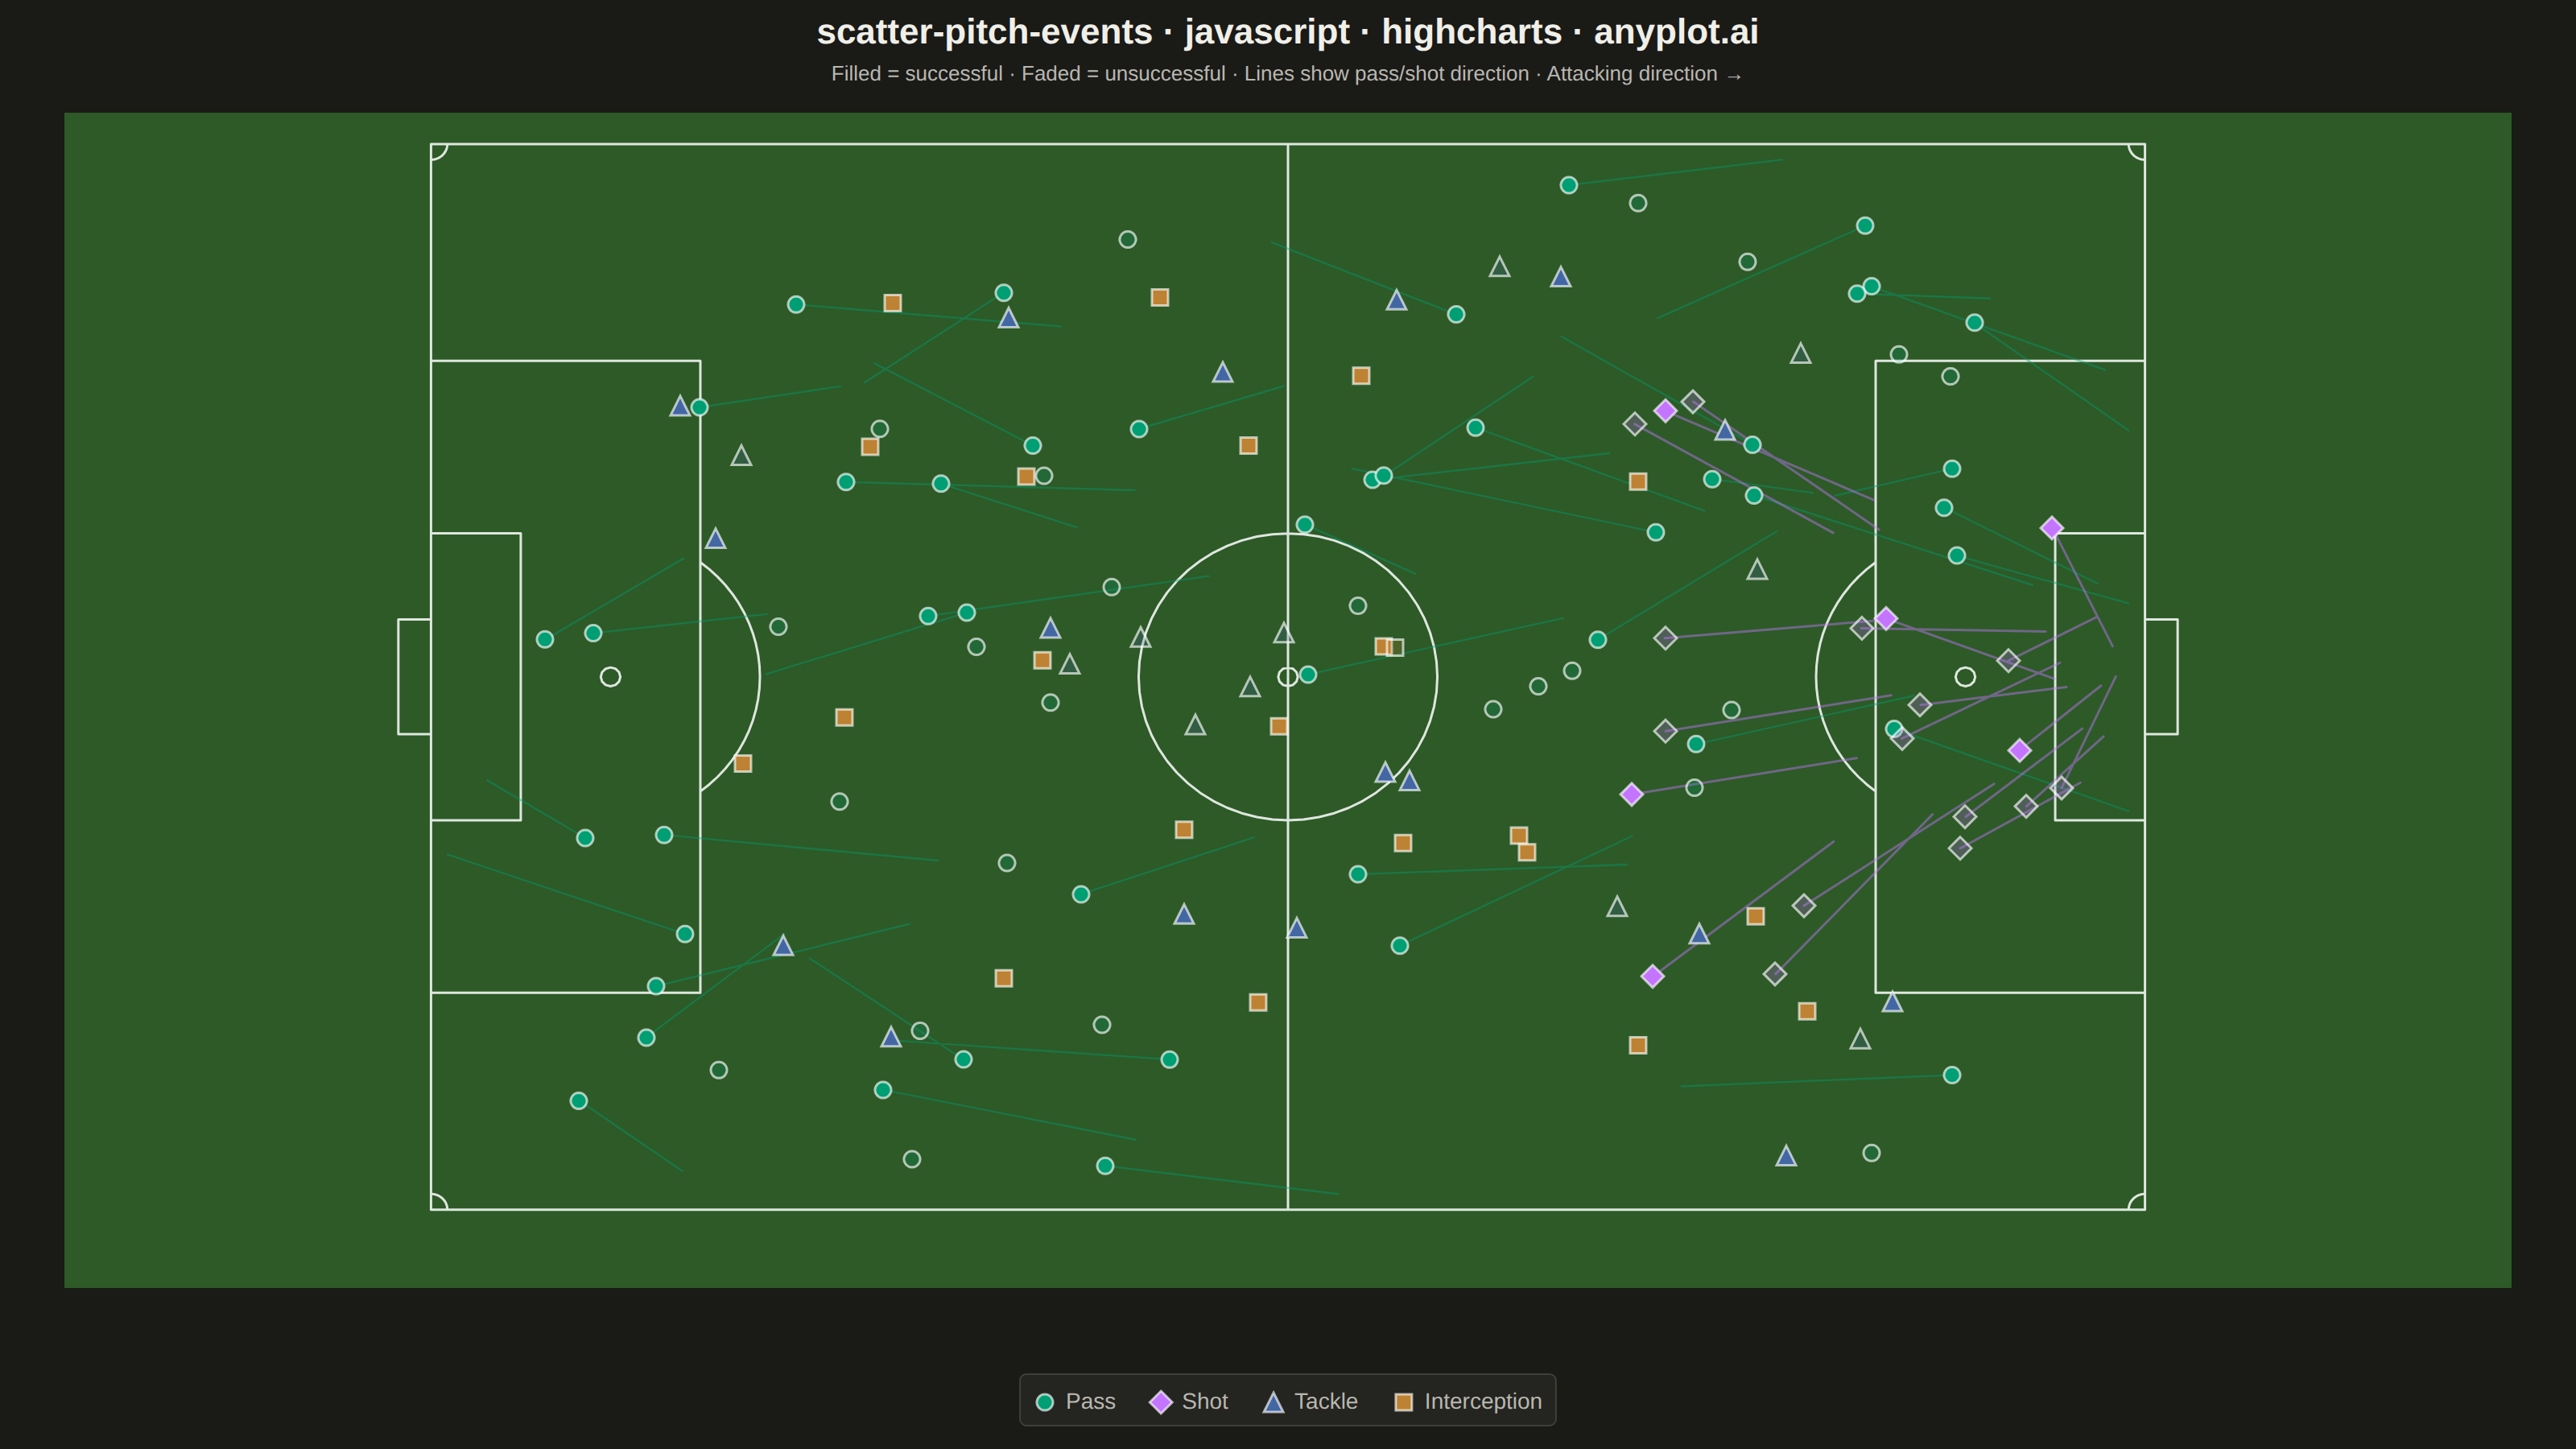
A soccer pitch event map positions match events (passes, shots, tackles, interceptions) as markers on an accurately scaled football pitch diagram. The pitch is drawn with standard markings including penalty areas, center circle, goal areas, and halfway line. Each event type uses distinct markers and colors, with directional arrows for passes and shots. This visualization is essential for tactical match analysis, scouting, and coaching in football analytics.
// anyplot.ai
// scatter-pitch-events: Soccer Pitch Event Map
// Library: highcharts 12.6.0 | JavaScript 22.22.3
// Quality: 93/100 | Created: 2026-06-21
//# anyplot-orientation: landscape

const t = window.ANYPLOT_TOKENS;
const THEME = window.ANYPLOT_THEME;

// Deterministic LCG RNG (seed 42)
let _s = 42;
const rng = () => { _s = Math.imul(_s, 1664525) + 1013904223 | 0; return (_s >>> 0) / 4294967296; };

// Hex → rgba helper
const rgba = (hex, a) => {
    const r = parseInt(hex.slice(1, 3), 16);
    const g = parseInt(hex.slice(3, 5), 16);
    const b = parseInt(hex.slice(5, 7), 16);
    return `rgba(${r},${g},${b},${a})`;
};

// FIFA pitch dimensions (meters)
const PW = 105, PH = 68;

// Pitch appearance — grass color is semantic (always green regardless of theme)
const GRASS_BG = '#2d5a27';
const PITCH_LINE = 'rgba(255,255,255,0.85)';

// Imprint palette — canonical order for 4 event categories (first = brand green)
const C_PASS  = t.palette[0]; // #009E73 brand green  — passes
const C_SHOT  = t.palette[1]; // #C475FD lavender     — shots
const C_TACK  = t.palette[2]; // #4467A3 blue         — tackles
const C_INTER = t.palette[3]; // #BD8233 ochre        — interceptions

// White outline makes markers pop against dark grass
const MARK_LINE = 'rgba(255,255,255,0.65)';
const MARK_LW   = 1.5;

// --- Circle / arc point generators ---
const circlePts = (cx, cy, r, n = 60) =>
    Array.from({ length: n + 1 }, (_, i) => ({
        x: cx + r * Math.cos((i / n) * 2 * Math.PI),
        y: cy + r * Math.sin((i / n) * 2 * Math.PI)
    }));

const arcPts = (cx, cy, r, a0, a1, n = 24) =>
    Array.from({ length: n + 1 }, (_, i) => {
        const a = a0 + (i / n) * (a1 - a0);
        return { x: cx + r * Math.cos(a), y: cy + r * Math.sin(a) };
    });

// --- Pitch markings as null-separated line segments ---
function buildPitchLines() {
    const d = [];
    const seg = pts => { if (d.length) d.push(null); d.push(...pts); };

    // Outer boundary
    seg([{ x: 0, y: 0 }, { x: PW, y: 0 }, { x: PW, y: PH }, { x: 0, y: PH }, { x: 0, y: 0 }]);
    // Halfway line
    seg([{ x: PW / 2, y: 0 }, { x: PW / 2, y: PH }]);
    // Center circle (r = 9.15 m)
    seg(circlePts(PW / 2, PH / 2, 9.15));
    // Center spot
    seg(circlePts(PW / 2, PH / 2, 0.6, 12));
    // Left penalty area (16.5 m deep, 40.32 m wide)
    seg([{ x: 0, y: 13.84 }, { x: 16.5, y: 13.84 }, { x: 16.5, y: 54.16 }, { x: 0, y: 54.16 }]);
    // Right penalty area
    seg([{ x: PW, y: 13.84 }, { x: 88.5, y: 13.84 }, { x: 88.5, y: 54.16 }, { x: PW, y: 54.16 }]);
    // Left goal area (5.5 m deep, 18.32 m wide)
    seg([{ x: 0, y: 24.84 }, { x: 5.5, y: 24.84 }, { x: 5.5, y: 43.16 }, { x: 0, y: 43.16 }]);
    // Right goal area
    seg([{ x: PW, y: 24.84 }, { x: 99.5, y: 24.84 }, { x: 99.5, y: 43.16 }, { x: PW, y: 43.16 }]);
    // Penalty spots (at 11 m from each goal line)
    seg(circlePts(11, PH / 2, 0.6, 12));
    seg(circlePts(94, PH / 2, 0.6, 12));
    // Penalty arcs — portions of r=9.15 circle outside each penalty area
    const la = Math.acos((16.5 - 11) / 9.15); // ~53.1°
    seg(arcPts(11, PH / 2, 9.15, -la, la));
    const ra = Math.acos((94 - 88.5) / 9.15);
    seg(arcPts(94, PH / 2, 9.15, Math.PI - ra, Math.PI + ra));
    // Corner arcs (r = 1 m, quarter circles facing pitch interior)
    seg(arcPts(0,  0,  1, 0,            Math.PI / 2));
    seg(arcPts(PW, 0,  1, Math.PI / 2,  Math.PI));
    seg(arcPts(0,  PH, 1, -Math.PI / 2, 0));
    seg(arcPts(PW, PH, 1, Math.PI,      3 * Math.PI / 2));
    // Goals (2 m depth, 7.32 m wide — centered at y = 34)
    seg([{ x: 0, y: 30.34 }, { x: -2, y: 30.34 }, { x: -2, y: 37.66 }, { x: 0, y: 37.66 }]);
    seg([{ x: PW, y: 30.34 }, { x: PW + 2, y: 30.34 }, { x: PW + 2, y: 37.66 }, { x: PW, y: 37.66 }]);

    return d;
}

// --- Event data generation (all using rng() in fixed order for determinism) ---

// Passes: spread across the full pitch
const passes = Array.from({ length: 70 }, () => ({
    x: 5 + rng() * 90, y: 2 + rng() * 64, suc: rng() > 0.28,
    ex: 0, ey: 0
}));
passes.forEach(p => {
    const dx = (rng() * 0.6 + 0.25) * 22 * (rng() > 0.3 ? 1 : -1);
    const dy = (rng() - 0.5) * 14;
    p.ex = Math.min(104, Math.max(1, p.x + dx));
    p.ey = Math.min(67, Math.max(1, p.y + dy));
});

// Shots: concentrated in attacking third
const shots = Array.from({ length: 20 }, () => ({
    x: 72 + rng() * 28, y: 12 + rng() * 44, suc: rng() > 0.72,
    ex: 0, ey: 0
}));
shots.forEach(s => {
    const goalY = 27 + rng() * 14; // target point in goal opening
    const dx = PW - s.x, dy = goalY - s.y;
    const dist = Math.sqrt(dx * dx + dy * dy);
    const tLen = Math.min(dist * 0.65, 14); // arrow length (fraction toward goal)
    s.ex = s.x + (dx / dist) * tLen;
    s.ey = s.y + (dy / dist) * tLen;
});

// Tackles: distributed mid-field to defensive third
const tackles = Array.from({ length: 28 }, () => ({
    x: 10 + rng() * 80, y: 3 + rng() * 62, suc: rng() > 0.42
}));

// Interceptions: mid-field zone
const inters = Array.from({ length: 22 }, () => ({
    x: 15 + rng() * 70, y: 3 + rng() * 62, suc: rng() > 0.25
}));

// Build null-separated arrow line data from events with end coords
const arrowData = evts => {
    const d = [];
    evts.forEach(e => { if (d.length) d.push(null); d.push({ x: e.x, y: e.y }, { x: e.ex, y: e.ey }); });
    return d;
};

// Per-point outcome encoding: solid fill = successful, faded fill = unsuccessful
const markerData = (evts, color) => evts.map(e => ({
    x: e.x, y: e.y,
    marker: { fillColor: e.suc ? color : rgba(color, 0.22) }
}));

// X-axis padding to maintain 105:68 pitch aspect ratio
// Plot area CSS: (1600-80) × (900-170) = 1520 × 730 px  (margins top=70,right=40,bottom=100,left=40)
// px/m constrained by height: 730 / (68+4) ≈ 10.14; x range = 1520 / 10.14 ≈ 150 m
const X_PAD = ((1520 / (730 / (PH + 4))) - PW) / 2; // ≈ 22.4 m each side

Highcharts.chart("container", {
    chart: {
        type: "scatter",
        backgroundColor: "transparent",
        plotBackgroundColor: GRASS_BG,
        animation: false,
        style: { fontFamily: "inherit" },
        margin: [70, 40, 100, 40],
    },
    credits: { enabled: false },
    colors: t.palette,
    title: {
        text: "scatter-pitch-events · javascript · highcharts · anyplot.ai",
        style: { color: t.ink, fontSize: "22px", fontWeight: "600" }
    },
    subtitle: {
        text: "Filled = successful · Faded = unsuccessful · Lines show pass/shot direction · Attacking direction →",
        style: { color: t.inkSoft, fontSize: "13px" }
    },
    xAxis: {
        min: -X_PAD, max: PW + X_PAD,
        lineWidth: 0, tickWidth: 0, gridLineWidth: 0,
        labels: { enabled: false },
        title: { text: null },
    },
    yAxis: {
        min: -2, max: PH + 2,
        lineWidth: 0, tickWidth: 0, gridLineWidth: 0,
        labels: { enabled: false },
        title: { text: null },
    },
    legend: {
        enabled: true,
        align: 'center',
        verticalAlign: 'bottom',
        layout: 'horizontal',
        itemStyle: { color: t.inkSoft, fontSize: "14px" },
        itemHoverStyle: { color: t.ink },
        backgroundColor: t.elevatedBg,
        borderColor: t.grid,
        borderWidth: 1,
        borderRadius: 4,
        padding: 8,
    },
    tooltip: { enabled: false },
    plotOptions: {
        series: { animation: false },
        scatter: {
            enableMouseTracking: false,
            marker: { lineWidth: MARK_LW, lineColor: MARK_LINE },
        },
        line: {
            enableMouseTracking: false,
            marker: { enabled: false },
            connectNulls: false,
        },
    },
    series: [
        // Pitch markings (white lines on grass)
        {
            type: 'line', name: '_pitch',
            data: buildPitchLines(),
            color: PITCH_LINE, lineWidth: 1.5,
            showInLegend: false, zIndex: 1,
        },
        // Pass trajectory lines (successful passes only)
        {
            type: 'line', name: '_passArrows',
            data: arrowData(passes.filter(p => p.suc)),
            color: rgba(C_PASS, 0.4), lineWidth: 1.2,
            showInLegend: false, zIndex: 2,
        },
        // Shot trajectory lines (all shots, toward goal)
        {
            type: 'line', name: '_shotArrows',
            data: arrowData(shots),
            color: rgba(C_SHOT, 0.45), lineWidth: 1.5,
            showInLegend: false, zIndex: 2,
        },
        // Pass events — circle markers
        {
            type: 'scatter', name: 'Pass',
            data: markerData(passes, C_PASS),
            color: C_PASS,
            marker: { symbol: 'circle', radius: 5, lineColor: MARK_LINE, lineWidth: MARK_LW },
            zIndex: 4,
        },
        // Shot events — diamond markers
        {
            type: 'scatter', name: 'Shot',
            data: markerData(shots, C_SHOT),
            color: C_SHOT,
            marker: { symbol: 'diamond', radius: 7, lineColor: MARK_LINE, lineWidth: MARK_LW },
            zIndex: 4,
        },
        // Tackle events — triangle markers
        {
            type: 'scatter', name: 'Tackle',
            data: markerData(tackles, C_TACK),
            color: C_TACK,
            marker: { symbol: 'triangle', radius: 6, lineColor: MARK_LINE, lineWidth: MARK_LW },
            zIndex: 4,
        },
        // Interception events — square markers
        {
            type: 'scatter', name: 'Interception',
            data: markerData(inters, C_INTER),
            color: C_INTER,
            marker: { symbol: 'square', radius: 5, lineColor: MARK_LINE, lineWidth: MARK_LW },
            zIndex: 4,
        },
    ],
});
Runnable source as JSON, for any HTTP client: https://api.anyplot.ai/specs/scatter-pitch-events/highcharts/code. Any spec id and library id listed in llms-full.txt fit the same URL shape; every URL below is complete and callable.
{
  "spec_id": "scatter-pitch-events",
  "language": "javascript",
  "library": "highcharts",
  "page": "https://anyplot.ai/scatter-pitch-events/javascript/highcharts",
  "hub": "https://anyplot.ai/scatter-pitch-events",
  "code_json": "https://api.anyplot.ai/specs/scatter-pitch-events/highcharts/code",
  "spec_json": "https://api.anyplot.ai/specs/scatter-pitch-events",
  "render_light_png": "https://storage.googleapis.com/anyplot-images/plots/scatter-pitch-events/javascript/highcharts/plot-light.png",
  "render_dark_png": "https://storage.googleapis.com/anyplot-images/plots/scatter-pitch-events/javascript/highcharts/plot-dark.png",
  "interactive_light_html": "https://storage.googleapis.com/anyplot-images/plots/scatter-pitch-events/javascript/highcharts/plot-light.html",
  "interactive_dark_html": "https://storage.googleapis.com/anyplot-images/plots/scatter-pitch-events/javascript/highcharts/plot-dark.html",
  "quality_score": 93.0,
  "license": "MIT",
  "guide": "https://anyplot.ai/llms.txt"
}
Part of Soccer Pitch Event Map on anyplot.ai.