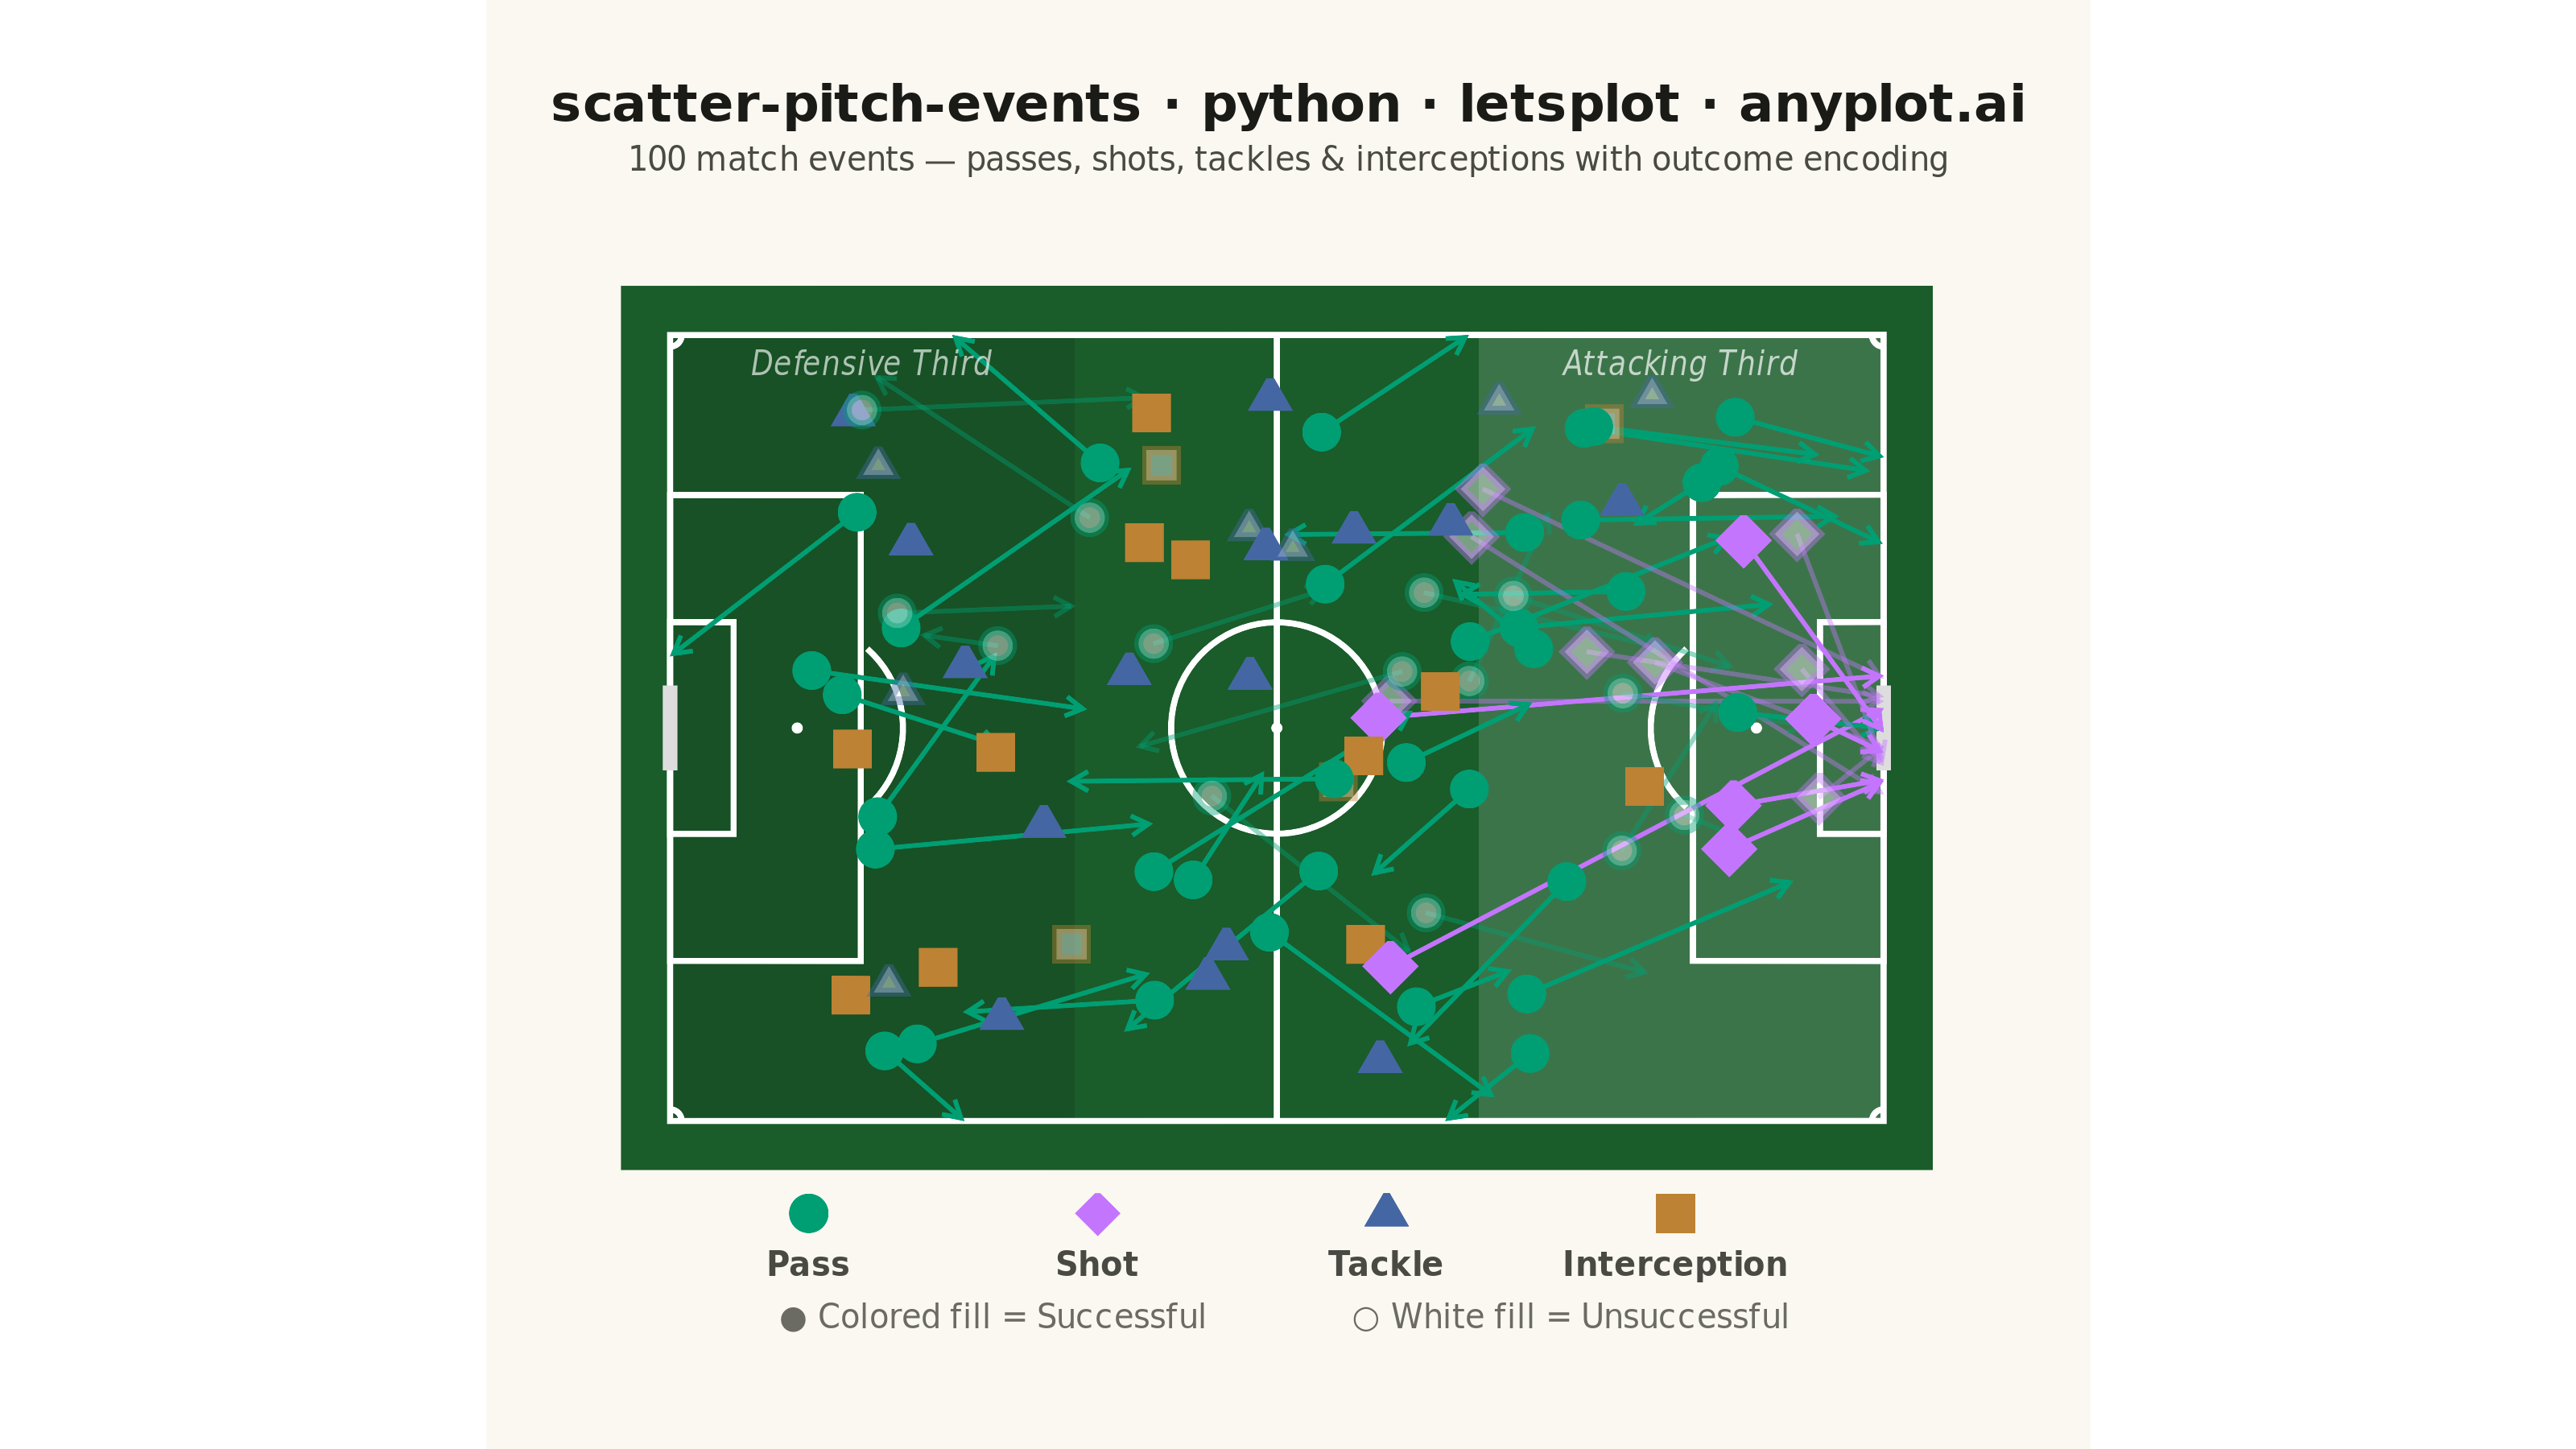
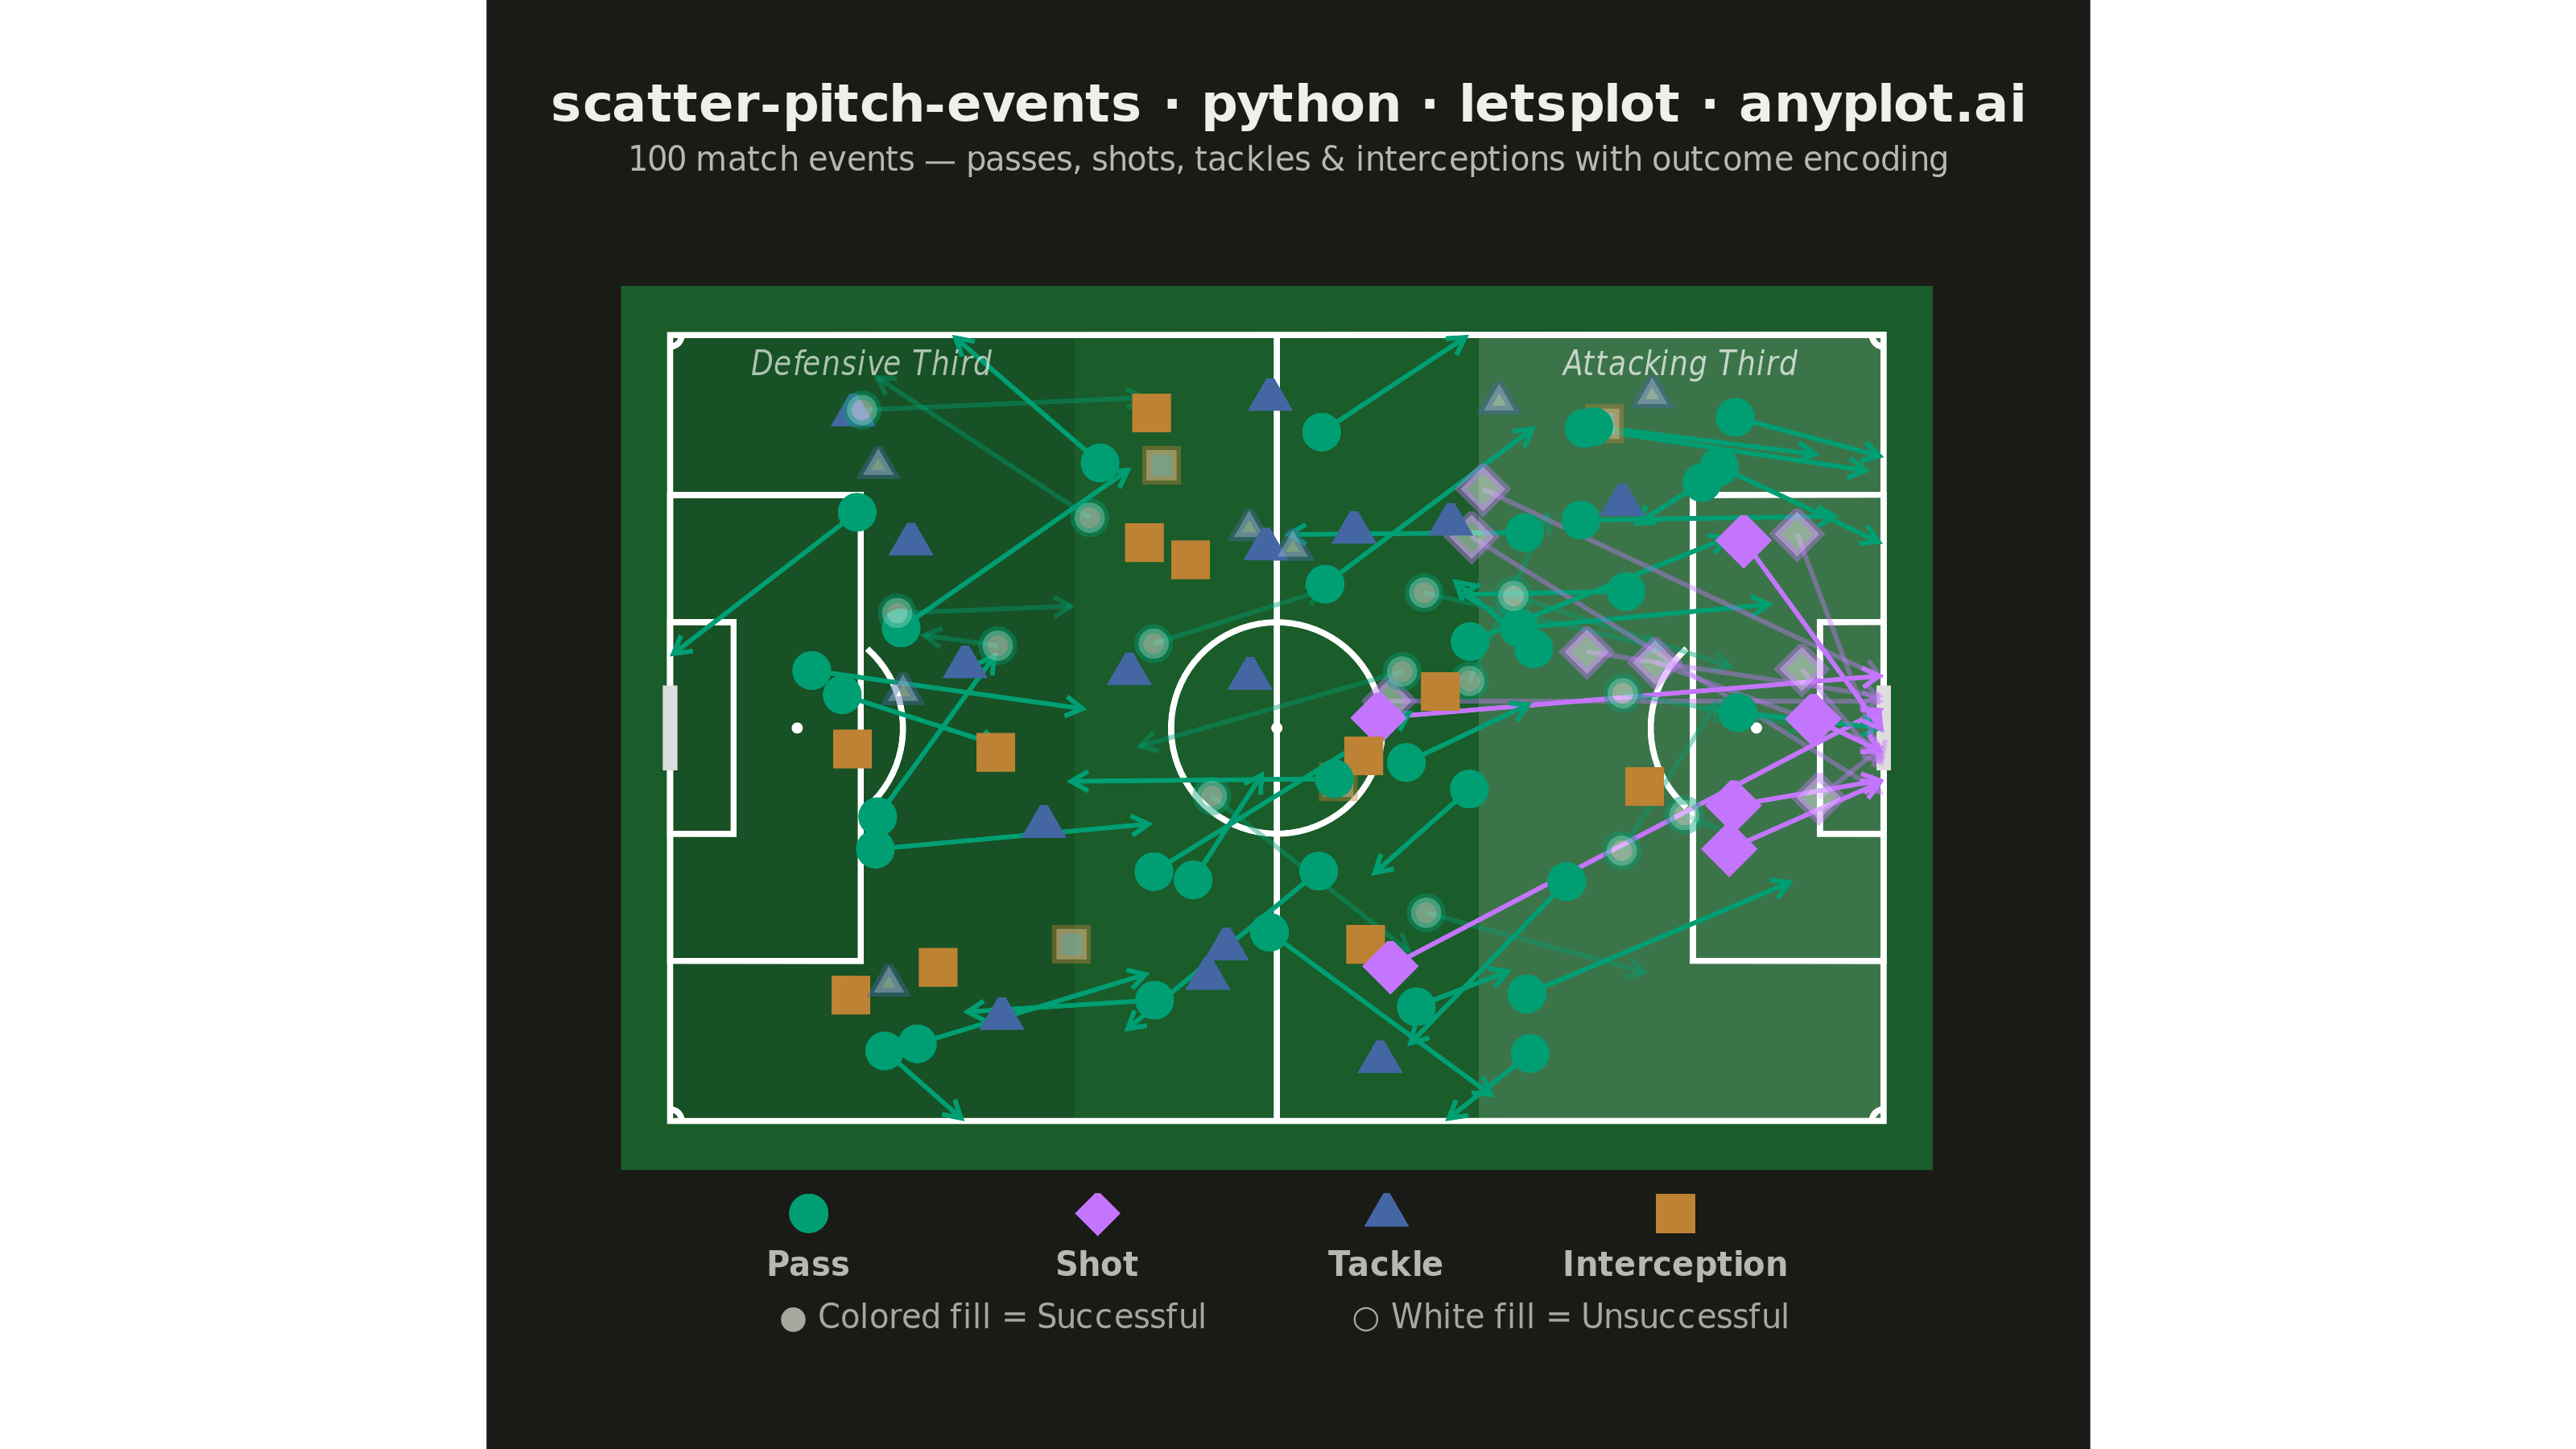
A soccer pitch event map positions match events (passes, shots, tackles, interceptions) as markers on an accurately scaled football pitch diagram. The pitch is drawn with standard markings including penalty areas, center circle, goal areas, and halfway line. Each event type uses distinct markers and colors, with directional arrows for passes and shots. This visualization is essential for tactical match analysis, scouting, and coaching in football analytics.
""" anyplot.ai
scatter-pitch-events: Soccer Pitch Event Map
Library: letsplot 4.10.1 | Python 3.13.14
Quality: 87/100 | Updated: 2026-06-21
"""

import os

import numpy as np
import pandas as pd
from lets_plot import (
    LetsPlot,
    aes,
    arrow,
    coord_fixed,
    element_rect,
    element_text,
    geom_path,
    geom_point,
    geom_rect,
    geom_segment,
    geom_text,
    ggplot,
    ggsave,
    ggsize,
    labs,
    layer_tooltips,
    scale_alpha_identity,
    scale_color_identity,
    scale_fill_identity,
    scale_shape_identity,
    scale_size_identity,
    theme,
    theme_void,
    xlim,
    ylim,
)


LetsPlot.setup_html()

# Theme tokens (Imprint palette, theme-adaptive chrome)
THEME = os.getenv("ANYPLOT_THEME", "light")
PAGE_BG = "#FAF8F1" if THEME == "light" else "#1A1A17"
INK = "#1A1A17" if THEME == "light" else "#F0EFE8"
INK_SOFT = "#4A4A44" if THEME == "light" else "#B8B7B0"
INK_MUTED = "#6B6A63" if THEME == "light" else "#A8A79F"

# Pitch color is data context — stays constant across themes
PITCH_GREEN = "#1A5C2A"  # darker forest green keeps #009E73 markers visually distinct
PITCH_LINE = "#FFFFFF"

# Imprint palette (canonical order) mapped to 4 event types
IMPRINT_PALETTE = ["#009E73", "#C475FD", "#4467A3", "#BD8233", "#AE3030", "#2ABCCD", "#954477", "#99B314"]
pass_color = IMPRINT_PALETTE[0]  # brand green
shot_color = IMPRINT_PALETTE[1]  # lavender
tackle_color = IMPRINT_PALETTE[2]  # blue
intercept_color = IMPRINT_PALETTE[3]  # ochre

color_map = {"Pass": pass_color, "Shot": shot_color, "Tackle": tackle_color, "Interception": intercept_color}
shape_map = {"Pass": 21, "Shot": 23, "Tackle": 24, "Interception": 22}

# Data
np.random.seed(42)
n_events = 100
event_types = np.random.choice(["Pass", "Shot", "Tackle", "Interception"], size=n_events, p=[0.45, 0.15, 0.22, 0.18])
success_rates = {"Pass": 0.78, "Shot": 0.30, "Tackle": 0.60, "Interception": 0.70}
outcomes = [
    np.random.choice(["Successful", "Unsuccessful"], p=[success_rates[et], 1 - success_rates[et]]) for et in event_types
]

x_pos, y_pos, x_end, y_end = [], [], [], []
for et in event_types:
    if et == "Pass":
        x = np.random.uniform(10, 95)
        y = np.random.uniform(5, 63)
        dx = np.random.uniform(5, 25) * np.random.choice([-1, 1], p=[0.2, 0.8])
        dy = np.random.uniform(-15, 15)
        xe, ye = np.clip(x + dx, 0, 105), np.clip(y + dy, 0, 68)
    elif et == "Shot":
        x = np.random.uniform(55, 100)
        y = np.random.uniform(10, 58)
        xe, ye = 105.0, np.random.uniform(28, 40)
    else:
        x = np.random.uniform(15, 85)
        y = np.random.uniform(5, 63)
        xe, ye = x, y
    x_pos.append(x)
    y_pos.append(y)
    x_end.append(xe)
    y_end.append(ye)

df = pd.DataFrame(
    {"x": x_pos, "y": y_pos, "x_end": x_end, "y_end": y_end, "event_type": event_types, "outcome": outcomes}
)
df["color"] = df["event_type"].map(color_map)
df["shape"] = df["event_type"].map(shape_map)
# Clearer alpha encoding: successful=1.0 opaque, unsuccessful=0.42 semi-transparent
df["alpha"] = np.where(df["outcome"] == "Successful", 1.0, 0.42)
df["fill"] = np.where(df["outcome"] == "Successful", df["color"], "#FFFFFF")
df["marker_size"] = np.where(df["event_type"] == "Shot", 4.5, 3.0)

df_arrows = df[df["event_type"].isin(["Pass", "Shot"])].copy()

# Pitch geometry
theta = np.linspace(0, 2 * np.pi, 80)
df_center_circle = pd.DataFrame({"x": 52.5 + 9.15 * np.cos(theta), "y": 34 + 9.15 * np.sin(theta)})

theta_l = np.linspace(-np.pi / 2, np.pi / 2, 40)
arc_lx = 11 + 9.15 * np.cos(theta_l)
arc_ly = 34 + 9.15 * np.sin(theta_l)
df_left_arc = pd.DataFrame({"x": arc_lx[arc_lx >= 16.5], "y": arc_ly[arc_lx >= 16.5]})

theta_r = np.linspace(np.pi / 2, 3 * np.pi / 2, 40)
arc_rx = 94 + 9.15 * np.cos(theta_r)
arc_ry = 34 + 9.15 * np.sin(theta_r)
df_right_arc = pd.DataFrame({"x": arc_rx[arc_rx <= 88.5], "y": arc_ry[arc_rx <= 88.5]})

corner_arc_dfs = []
for cx, cy, t0, t1 in [
    (0, 0, 0, np.pi / 2),
    (0, 68, -np.pi / 2, 0),
    (105, 0, np.pi / 2, np.pi),
    (105, 68, np.pi, 3 * np.pi / 2),
]:
    t = np.linspace(t0, t1, 20)
    corner_arc_dfs.append(pd.DataFrame({"x": cx + np.cos(t), "y": cy + np.sin(t)}))

df_rects = pd.DataFrame(
    {
        "xmin": [0, 0, 0, 88.5, 99.5],
        "ymin": [0, 13.84, 24.84, 13.84, 24.84],
        "xmax": [105, 16.5, 5.5, 105, 105],
        "ymax": [68, 54.16, 43.16, 54.16, 43.16],
    }
)

# Zone highlights with improved visibility
df_attack_zone = pd.DataFrame({"xmin": [70], "ymin": [0], "xmax": [105], "ymax": [68]})
df_defend_zone = pd.DataFrame({"xmin": [0], "ymin": [0], "xmax": [35], "ymax": [68]})

# Custom legend below the pitch
legend_x = [12, 37, 62, 87]
df_legend_markers = pd.DataFrame(
    {
        "x": legend_x,
        "y": [-8.0] * 4,
        "color": [pass_color, shot_color, tackle_color, intercept_color],
        "shape": [21, 23, 24, 22],
        "fill": [pass_color, shot_color, tackle_color, intercept_color],
    }
)
df_legend_labels = pd.DataFrame({"x": legend_x, "y": [-12.5] * 4, "label": ["Pass", "Shot", "Tackle", "Interception"]})
df_outcome_text = pd.DataFrame(
    {"x": [28, 78], "y": [-17.0, -17.0], "label": ["● Colored fill = Successful", "○ White fill = Unsuccessful"]}
)

# Plot
plot = (
    ggplot()
    # Pitch surface
    + geom_rect(
        aes(xmin="xmin", ymin="ymin", xmax="xmax", ymax="ymax"),
        data=pd.DataFrame({"xmin": [-4], "ymin": [-4], "xmax": [109], "ymax": [72]}),
        fill=PITCH_GREEN,
        color=PITCH_GREEN,
    )
    # Zone highlights — alpha 0.15/0.12 for perceptibility (was 0.08/0.06)
    + geom_rect(
        aes(xmin="xmin", ymin="ymin", xmax="xmax", ymax="ymax"),
        data=df_attack_zone,
        fill="#FFFFFF",
        color="rgba(0,0,0,0)",
        alpha=0.15,
    )
    + geom_rect(
        aes(xmin="xmin", ymin="ymin", xmax="xmax", ymax="ymax"),
        data=df_defend_zone,
        fill="#000000",
        color="rgba(0,0,0,0)",
        alpha=0.12,
    )
    # Pitch markings
    + geom_rect(
        aes(xmin="xmin", ymin="ymin", xmax="xmax", ymax="ymax"),
        data=df_rects,
        fill="rgba(0,0,0,0)",
        color=PITCH_LINE,
        size=0.8,
    )
    + geom_segment(
        aes(x="x", y="y", xend="xend", yend="yend"),
        data=pd.DataFrame({"x": [52.5], "y": [0], "xend": [52.5], "yend": [68]}),
        color=PITCH_LINE,
        size=0.8,
    )
    + geom_segment(
        aes(x="x", y="y", xend="xend", yend="yend"),
        data=pd.DataFrame({"x": [0, 105], "y": [30.34, 30.34], "xend": [0, 105], "yend": [37.66, 37.66]}),
        color="#DDDDDD",
        size=2.0,
    )
    + geom_path(data=df_center_circle, mapping=aes(x="x", y="y"), color=PITCH_LINE, size=0.8)
    + geom_path(data=df_left_arc, mapping=aes(x="x", y="y"), color=PITCH_LINE, size=0.8)
    + geom_path(data=df_right_arc, mapping=aes(x="x", y="y"), color=PITCH_LINE, size=0.8)
    + geom_path(data=corner_arc_dfs[0], mapping=aes(x="x", y="y"), color=PITCH_LINE, size=0.8)
    + geom_path(data=corner_arc_dfs[1], mapping=aes(x="x", y="y"), color=PITCH_LINE, size=0.8)
    + geom_path(data=corner_arc_dfs[2], mapping=aes(x="x", y="y"), color=PITCH_LINE, size=0.8)
    + geom_path(data=corner_arc_dfs[3], mapping=aes(x="x", y="y"), color=PITCH_LINE, size=0.8)
    + geom_point(
        aes(x="x", y="y"), data=pd.DataFrame({"x": [52.5, 11, 94], "y": [34, 34, 34]}), color=PITCH_LINE, size=1.5
    )
    # Directional arrows for passes and shots
    + geom_segment(
        data=df_arrows,
        mapping=aes(x="x", y="y", xend="x_end", yend="y_end", color="color", alpha="alpha"),
        size=0.6,
        arrow=arrow(length=6, type="open"),
    )
    # Event markers (shots enlarged for tactical emphasis)
    + geom_point(
        data=df,
        mapping=aes(x="x", y="y", color="color", fill="fill", shape="shape", alpha="alpha", size="marker_size"),
        stroke=1.2,
        tooltips=layer_tooltips().line("@event_type").line("Outcome: @outcome").line("x=@x, y=@y"),
    )
    # Zone annotation labels
    + geom_text(
        data=pd.DataFrame({"x": [87.5], "y": [65.5], "label": ["Attacking Third"]}),
        mapping=aes(x="x", y="y", label="label"),
        size=5,
        color="#FFFFFF",
        alpha=0.7,
        fontface="italic",
    )
    + geom_text(
        data=pd.DataFrame({"x": [17.5], "y": [65.5], "label": ["Defensive Third"]}),
        mapping=aes(x="x", y="y", label="label"),
        size=5,
        color="#FFFFFF",
        alpha=0.65,
        fontface="italic",
    )
    # Custom legend markers and labels
    + geom_point(
        data=df_legend_markers,
        mapping=aes(x="x", y="y", color="color", fill="fill", shape="shape"),
        size=3.5,
        stroke=1.0,
    )
    + geom_text(
        data=df_legend_labels, mapping=aes(x="x", y="y", label="label"), size=5, color=INK_SOFT, fontface="bold"
    )
    + geom_text(data=df_outcome_text, mapping=aes(x="x", y="y", label="label"), size=5, color=INK_MUTED)
    + scale_color_identity()
    + scale_fill_identity()
    + scale_shape_identity()
    + scale_alpha_identity()
    + scale_size_identity()
    + coord_fixed(ratio=1)
    + xlim(-5, 112)
    + ylim(-20, 76)
    + labs(
        title="scatter-pitch-events · python · letsplot · anyplot.ai",
        subtitle="100 match events — passes, shots, tackles & interceptions with outcome encoding",
    )
    + theme_void()
    + theme(
        plot_title=element_text(size=16, hjust=0.5, color=INK, face="bold"),
        plot_subtitle=element_text(size=10, hjust=0.5, color=INK_SOFT),
        plot_background=element_rect(fill=PAGE_BG, color=PAGE_BG),
        plot_margin=[25, 15, 10, 15],
    )
    + ggsize(800, 450)
)

# Save PNG and HTML for this theme
ggsave(plot, f"plot-{THEME}.png", path=".", scale=4)
ggsave(plot, f"plot-{THEME}.html", path=".")
Runnable source as JSON, for any HTTP client: https://api.anyplot.ai/specs/scatter-pitch-events/letsplot/code. Any spec id and library id listed in llms-full.txt fit the same URL shape; every URL below is complete and callable.
{
  "spec_id": "scatter-pitch-events",
  "language": "python",
  "library": "letsplot",
  "page": "https://anyplot.ai/scatter-pitch-events/python/letsplot",
  "hub": "https://anyplot.ai/scatter-pitch-events",
  "code_json": "https://api.anyplot.ai/specs/scatter-pitch-events/letsplot/code",
  "spec_json": "https://api.anyplot.ai/specs/scatter-pitch-events",
  "render_light_png": "https://storage.googleapis.com/anyplot-images/plots/scatter-pitch-events/python/letsplot/plot-light.png",
  "render_dark_png": "https://storage.googleapis.com/anyplot-images/plots/scatter-pitch-events/python/letsplot/plot-dark.png",
  "interactive_light_html": "https://storage.googleapis.com/anyplot-images/plots/scatter-pitch-events/python/letsplot/plot-light.html",
  "interactive_dark_html": "https://storage.googleapis.com/anyplot-images/plots/scatter-pitch-events/python/letsplot/plot-dark.html",
  "quality_score": 87.0,
  "license": "MIT",
  "guide": "https://anyplot.ai/llms.txt"
}
Part of Soccer Pitch Event Map on anyplot.ai.