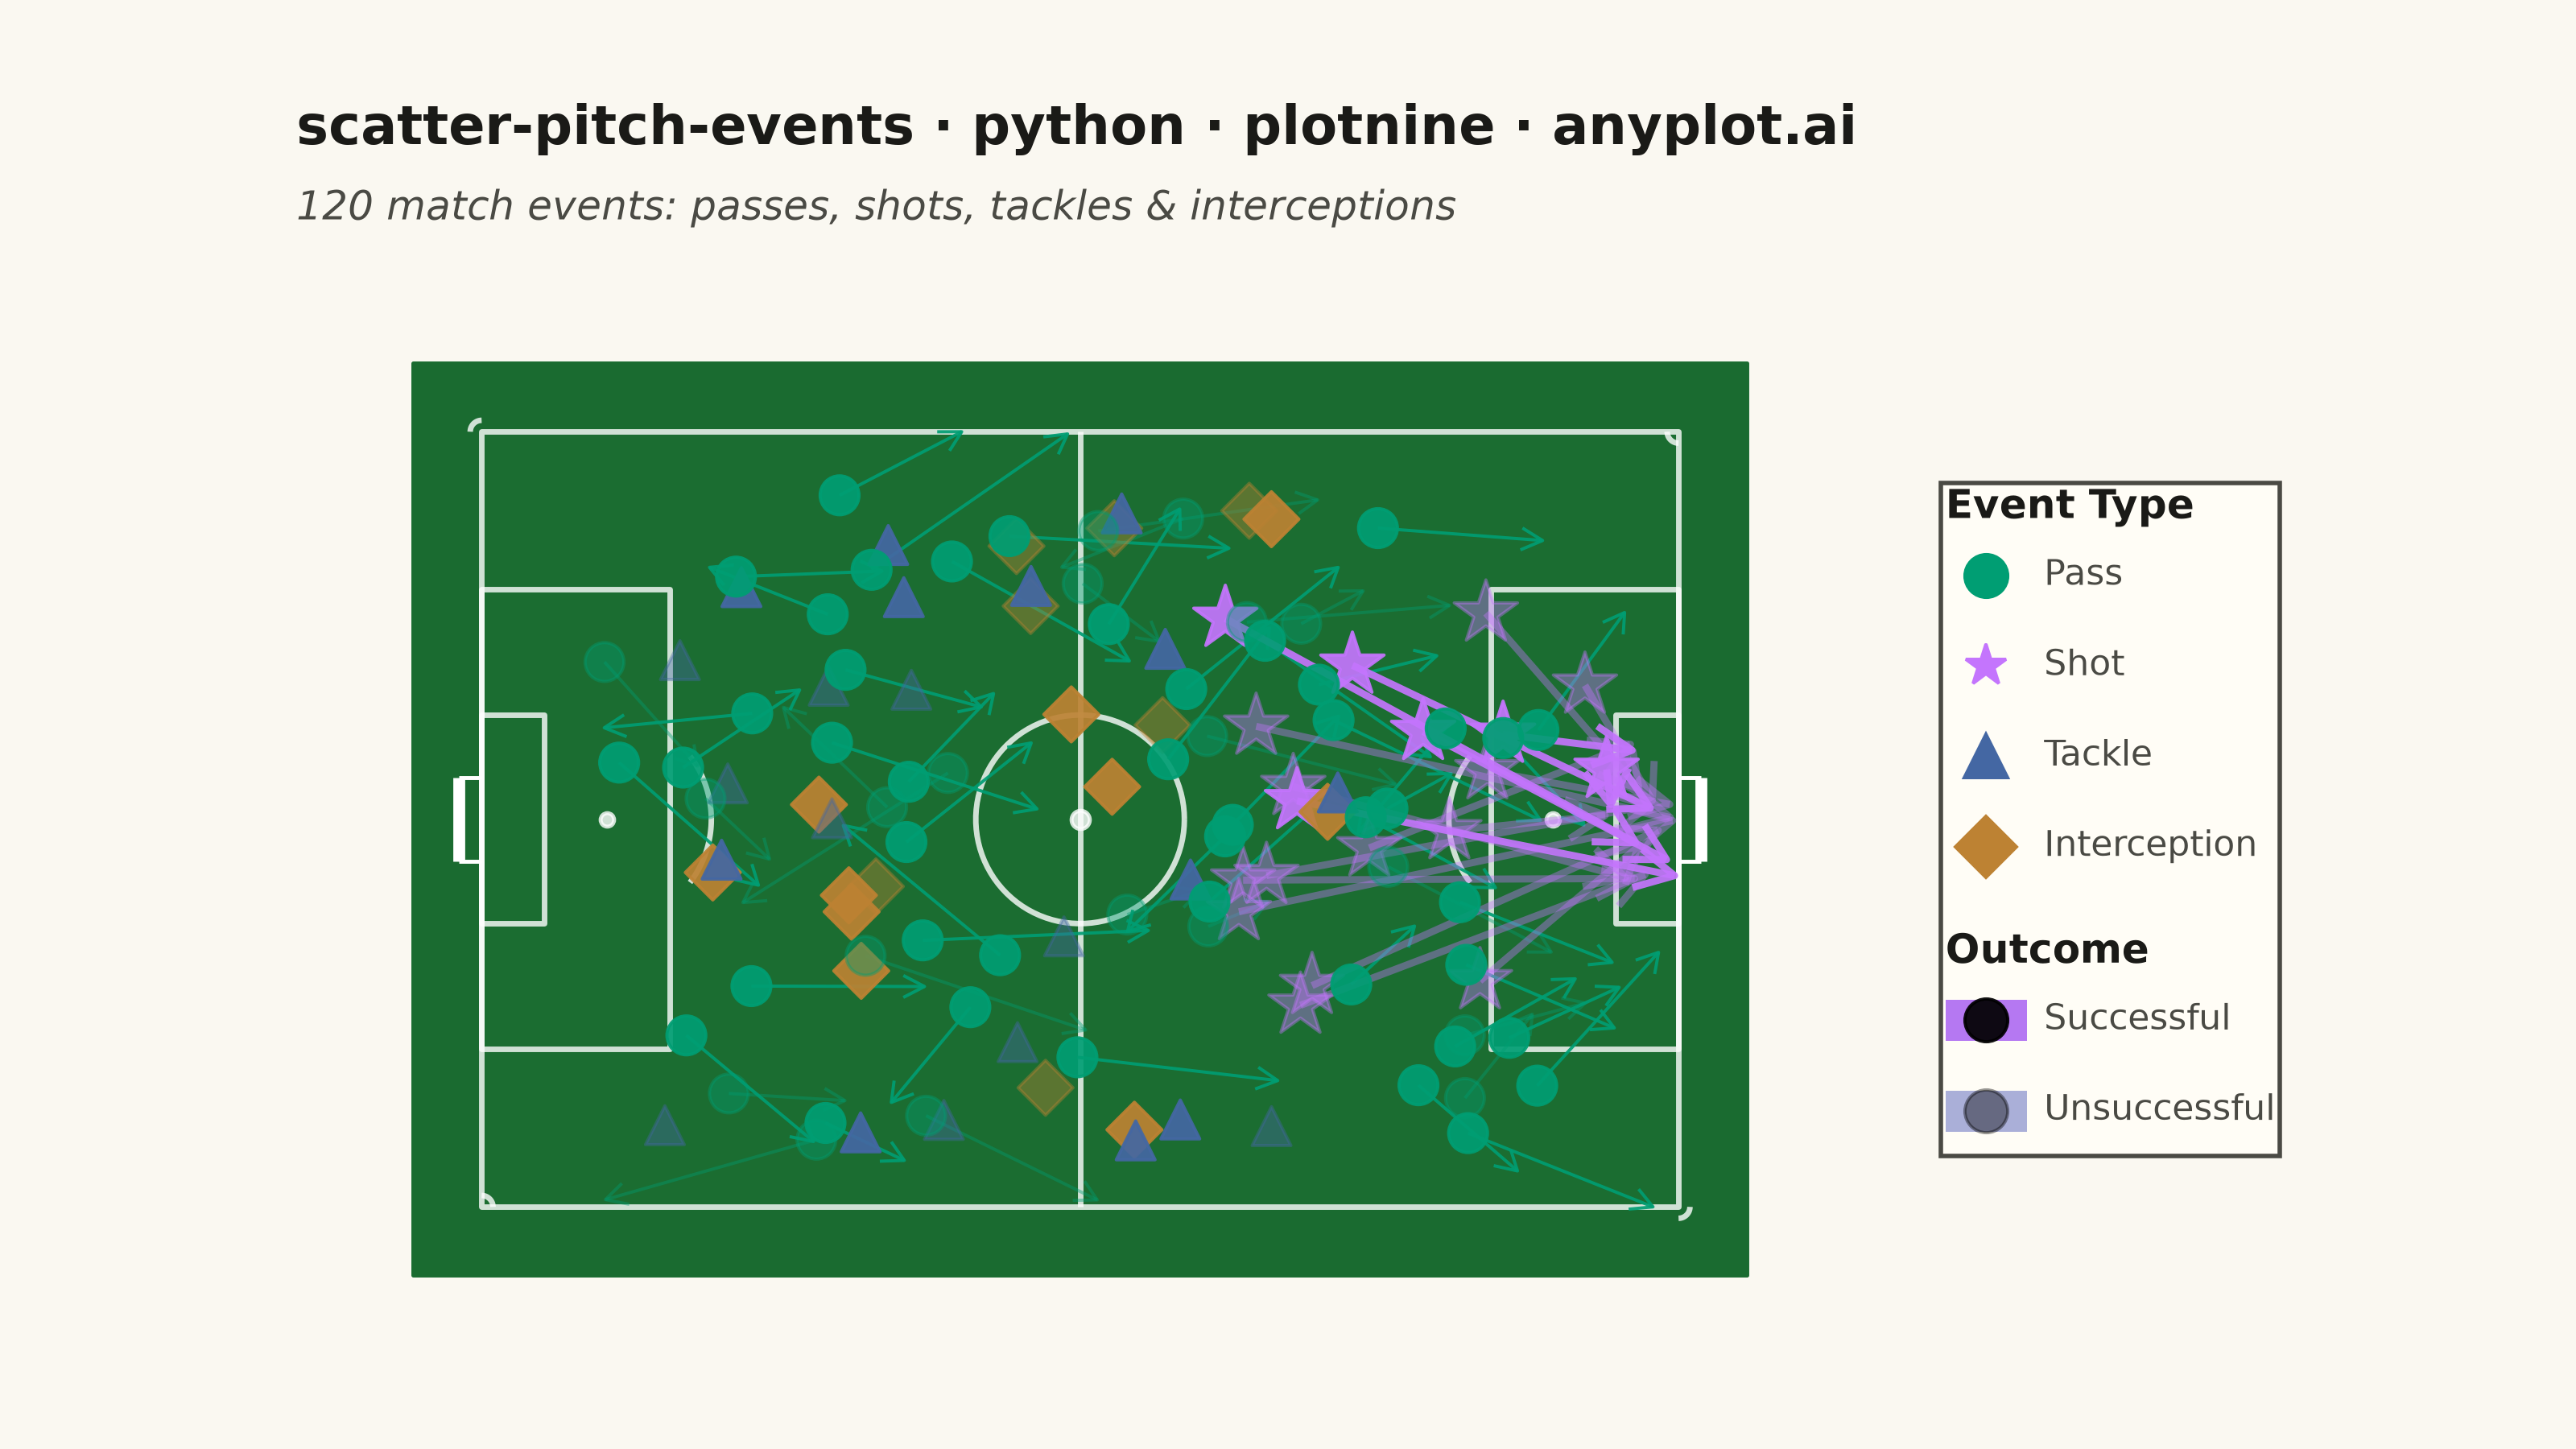
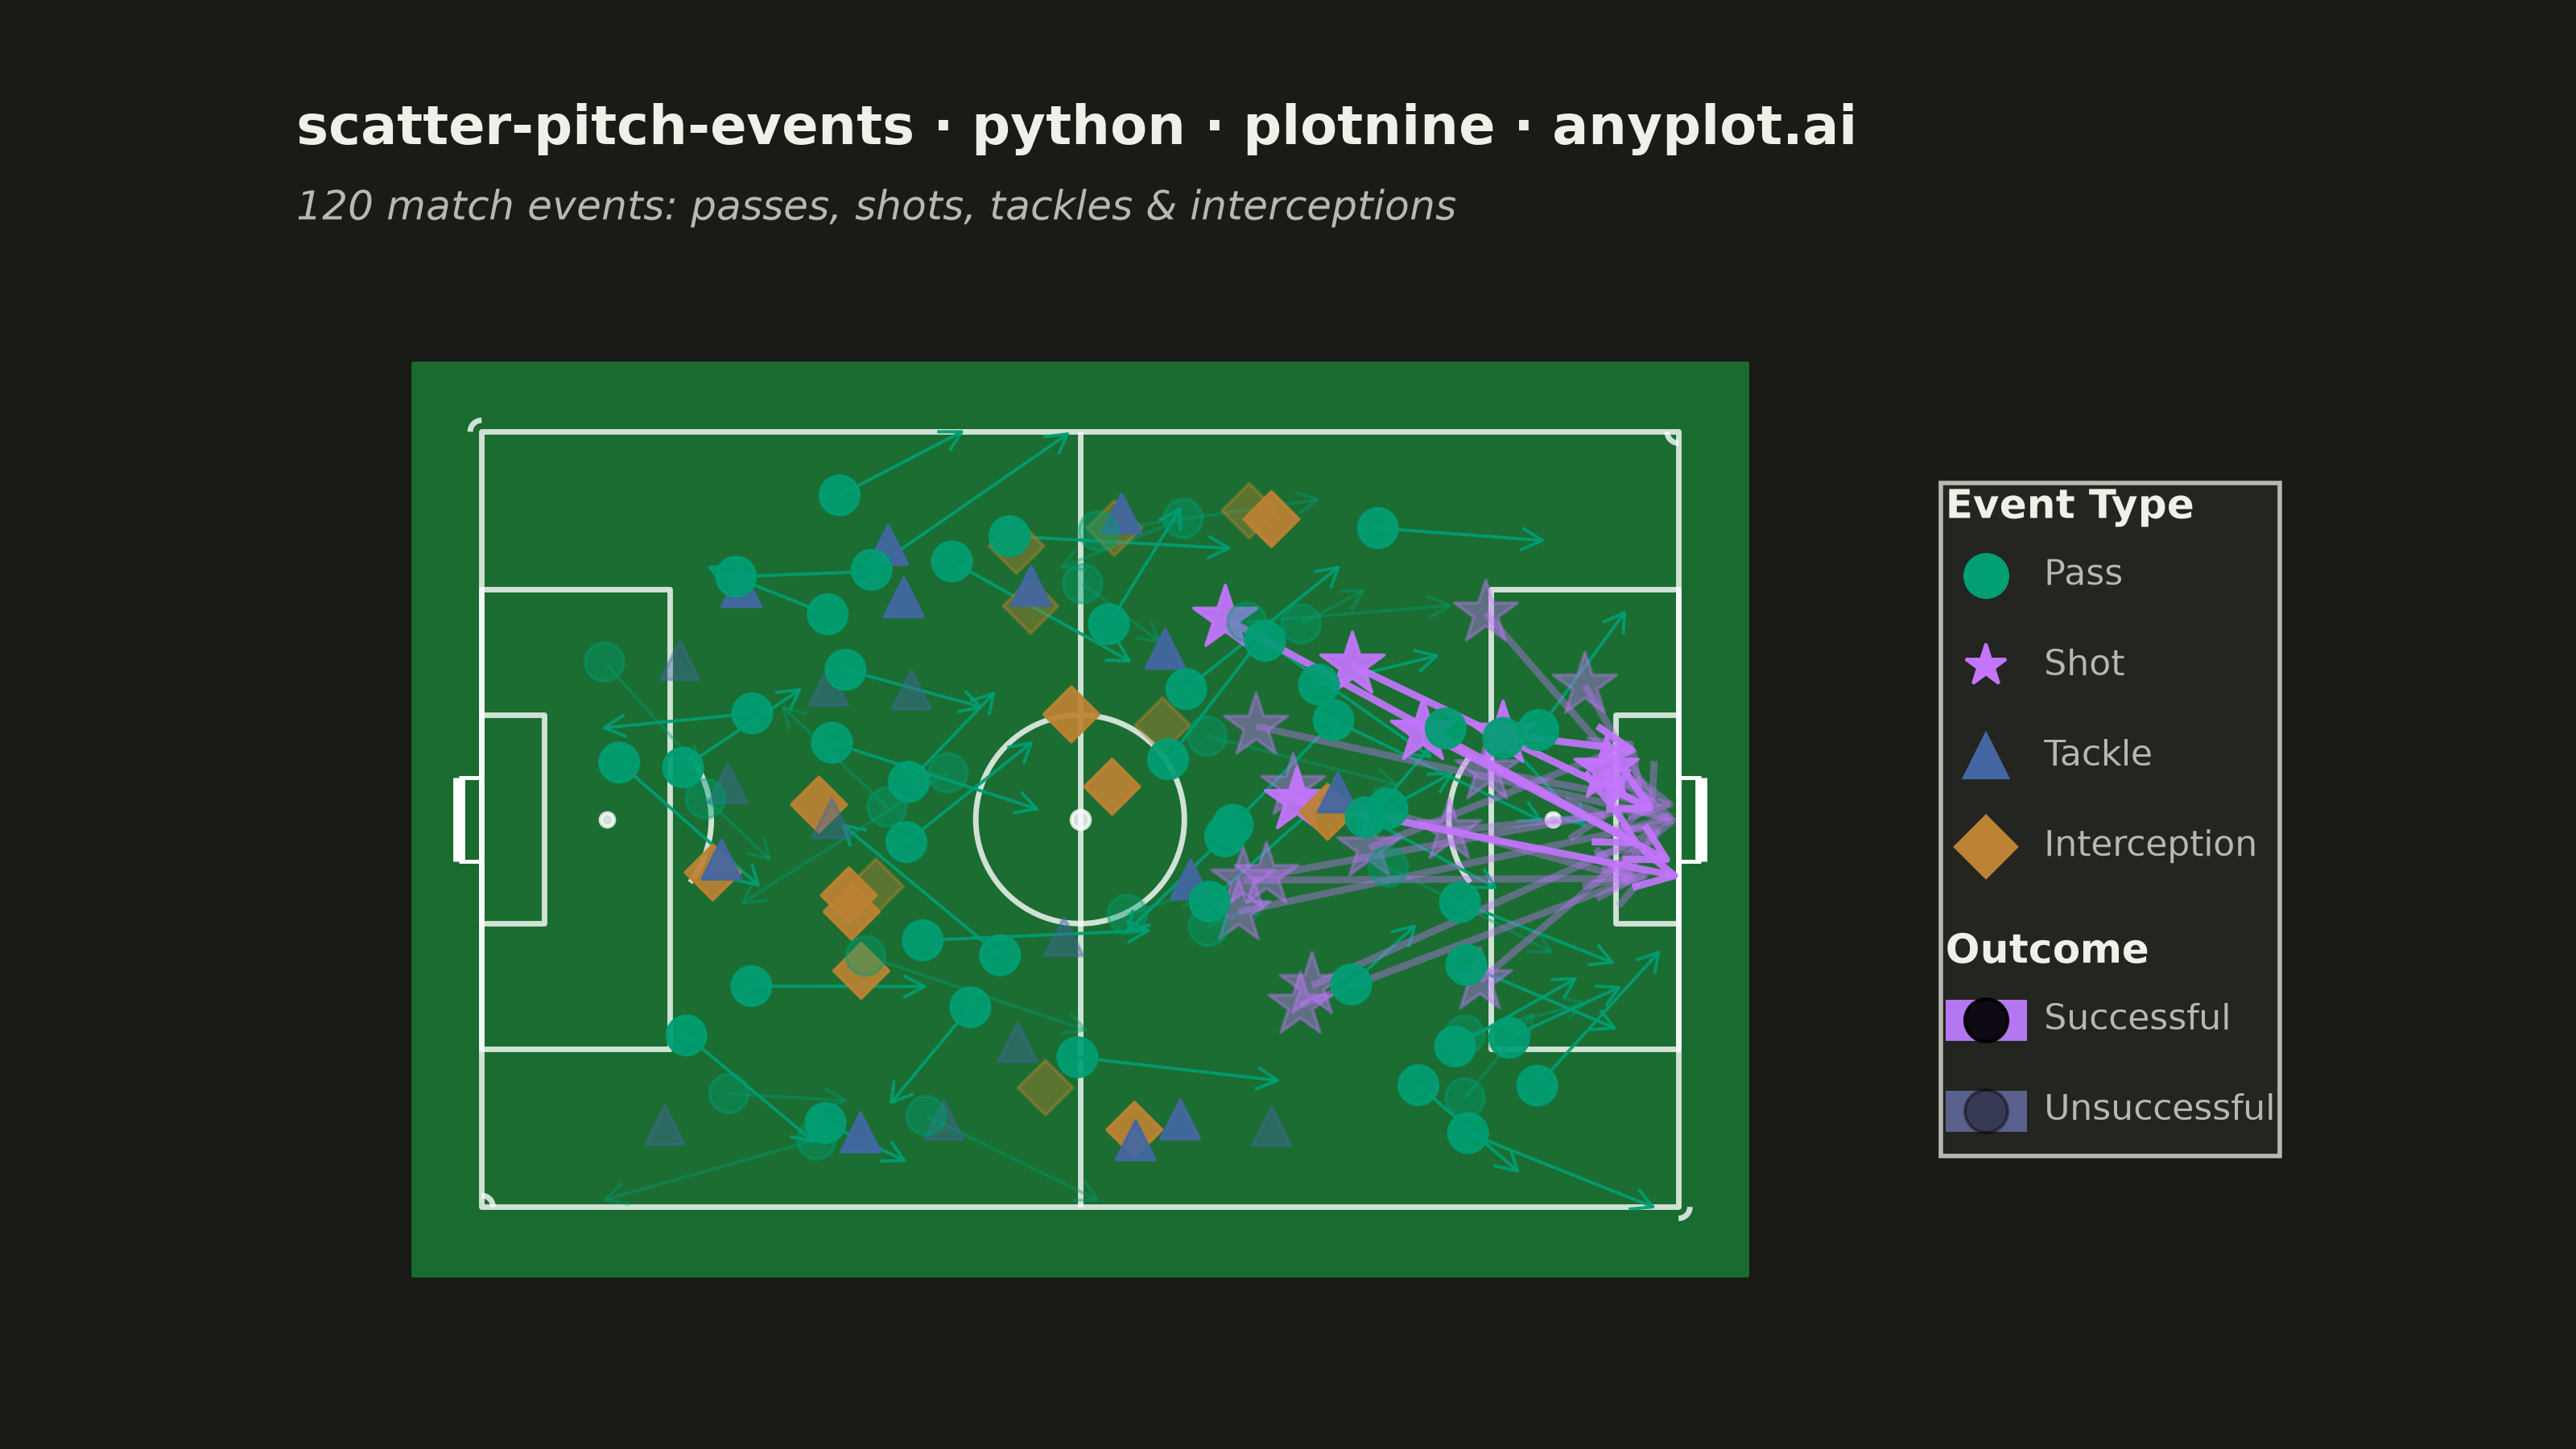
A soccer pitch event map positions match events (passes, shots, tackles, interceptions) as markers on an accurately scaled football pitch diagram. The pitch is drawn with standard markings including penalty areas, center circle, goal areas, and halfway line. Each event type uses distinct markers and colors, with directional arrows for passes and shots. This visualization is essential for tactical match analysis, scouting, and coaching in football analytics.
""" anyplot.ai
scatter-pitch-events: Soccer Pitch Event Map
Library: plotnine 0.15.7 | Python 3.13.14
Quality: 88/100 | Updated: 2026-06-21
"""

import os

import numpy as np
import pandas as pd
from plotnine import (
    aes,
    annotate,
    arrow,
    coord_fixed,
    element_blank,
    element_rect,
    element_text,
    geom_path,
    geom_point,
    geom_segment,
    ggplot,
    guide_legend,
    guides,
    labs,
    scale_alpha_manual,
    scale_color_manual,
    scale_shape_manual,
    scale_size_manual,
    scale_x_continuous,
    scale_y_continuous,
    theme,
)


# Theme tokens
THEME = os.getenv("ANYPLOT_THEME", "light")
PAGE_BG = "#FAF8F1" if THEME == "light" else "#1A1A17"
ELEVATED_BG = "#FFFDF6" if THEME == "light" else "#242420"
INK = "#1A1A17" if THEME == "light" else "#F0EFE8"
INK_SOFT = "#4A4A44" if THEME == "light" else "#B8B7B0"

# Imprint palette — canonical order, first series always #009E73
IMPRINT_PALETTE = ["#009E73", "#C475FD", "#4467A3", "#BD8233", "#AE3030", "#2ABCCD", "#954477", "#99B314"]

# Data
np.random.seed(42)

n_events = 120
event_types = np.random.choice(["Pass", "Shot", "Tackle", "Interception"], size=n_events, p=[0.50, 0.15, 0.20, 0.15])

x_ranges = {"Pass": (10, 95), "Shot": (65, 100), "Tackle": (15, 80), "Interception": (20, 75)}
y_ranges = {"Pass": (5, 63), "Shot": (15, 53), "Tackle": (5, 63), "Interception": (5, 63)}
success_p = {"Pass": 0.75, "Shot": 0.30, "Tackle": 0.65, "Interception": 0.70}

x_positions = np.array([np.random.uniform(*x_ranges[e]) for e in event_types])
y_positions = np.array([np.random.uniform(*y_ranges[e]) for e in event_types])
outcomes = [np.random.choice(["Successful", "Unsuccessful"], p=[success_p[e], 1 - success_p[e]]) for e in event_types]

# Arrow endpoints: passes forward-biased, shots spread across goal area to reduce congestion
x_end = x_positions.copy()
y_end = y_positions.copy()
for i, evt in enumerate(event_types):
    if evt == "Pass":
        dx = np.random.uniform(5, 20) * np.random.choice([-1, 1], p=[0.15, 0.85])
        dy = np.random.uniform(-12, 12)
        x_end[i] = np.clip(x_positions[i] + dx, 0, 105)
        y_end[i] = np.clip(y_positions[i] + dy, 0, 68)
    elif evt == "Shot":
        # Spread endpoints across goal area rather than converging to a single point
        x_end[i] = np.random.uniform(98, 105)
        y_end[i] = np.random.uniform(27, 41)

df = pd.DataFrame(
    {
        "x": x_positions,
        "y": y_positions,
        "x_end": x_end,
        "y_end": y_end,
        "event_type": pd.Categorical(event_types, categories=["Pass", "Shot", "Tackle", "Interception"]),
        "outcome": pd.Categorical(outcomes, categories=["Successful", "Unsuccessful"]),
    }
)

df_pass_arrows = df[df["event_type"] == "Pass"].copy()
df_shot_arrows = df[df["event_type"] == "Shot"].copy()
# Reorder so shots render on top (last drawn = topmost layer)
df_ordered = pd.concat([df[df["event_type"] != "Shot"], df[df["event_type"] == "Shot"]], ignore_index=True)

# Pitch styling — deep green with semi-transparent white lines
pitch_color = "#1a6b30"
line_color = "#ffffffcc"
lw = 0.7

# Curves: center circle, penalty arcs, corner arcs
theta = np.linspace(0, 2 * np.pi, 100)
center_circle = pd.DataFrame({"cx": 52.5 + 9.15 * np.cos(theta), "cy": 34 + 9.15 * np.sin(theta), "grp": 1})

theta_left = np.linspace(-0.65, 0.65, 50)
left_arc = pd.DataFrame({"cx": 11 + 9.15 * np.cos(theta_left), "cy": 34 + 9.15 * np.sin(theta_left), "grp": 2})

theta_right = np.linspace(np.pi - 0.65, np.pi + 0.65, 50)
right_arc = pd.DataFrame({"cx": 94 + 9.15 * np.cos(theta_right), "cy": 34 + 9.15 * np.sin(theta_right), "grp": 3})

ca_r = 1.0
corner_arcs = pd.concat(
    [
        pd.DataFrame(
            {
                "cx": ca_r * np.cos(np.linspace(0, np.pi / 2, 20)),
                "cy": ca_r * np.sin(np.linspace(0, np.pi / 2, 20)),
                "grp": 4,
            }
        ),
        pd.DataFrame(
            {
                "cx": ca_r * np.cos(np.linspace(np.pi / 2, np.pi, 20)),
                "cy": 68 + ca_r * np.sin(np.linspace(np.pi / 2, np.pi, 20)),
                "grp": 5,
            }
        ),
        pd.DataFrame(
            {
                "cx": 105 + ca_r * np.cos(np.linspace(-np.pi / 2, 0, 20)),
                "cy": ca_r * np.sin(np.linspace(-np.pi / 2, 0, 20)),
                "grp": 6,
            }
        ),
        pd.DataFrame(
            {
                "cx": 105 + ca_r * np.cos(np.linspace(np.pi, 3 * np.pi / 2, 20)),
                "cy": 68 + ca_r * np.sin(np.linspace(np.pi, 3 * np.pi / 2, 20)),
                "grp": 7,
            }
        ),
    ],
    ignore_index=True,
)

all_curves = pd.concat([center_circle, left_arc, right_arc, corner_arcs], ignore_index=True)

# Imprint palette mapped to event types (canonical positions 1–4)
event_colors = {
    "Pass": IMPRINT_PALETTE[0],  # #009E73 brand green
    "Shot": IMPRINT_PALETTE[1],  # #C475FD lavender
    "Tackle": IMPRINT_PALETTE[2],  # #4467A3 blue
    "Interception": IMPRINT_PALETTE[3],  # #BD8233 ochre
}
event_shapes = {"Pass": "o", "Shot": "*", "Tackle": "^", "Interception": "D"}

# Title — compute fontsize proportional to length
title = "scatter-pitch-events · python · plotnine · anyplot.ai"
n_chars = len(title)
ratio = 67 / n_chars if n_chars > 67 else 1.0
title_fontsize = max(8, round(12 * ratio))

# Plot
plot = (
    ggplot(df_ordered, aes(x="x", y="y", color="event_type", shape="event_type", alpha="outcome", size="event_type"))
    # Pitch background — extended to fill canvas edges
    + annotate("rect", xmin=-6, xmax=111, ymin=-6, ymax=74, fill=pitch_color, color=pitch_color)
    # Subtle grass stripe effect
    + annotate("rect", xmin=0, xmax=105, ymin=0, ymax=68, fill="#1e7535", alpha=0.3, color="none")
    # Pitch outline
    + annotate("rect", xmin=0, xmax=105, ymin=0, ymax=68, fill="none", color=line_color, size=lw)
    # Halfway line
    + annotate("segment", x=52.5, xend=52.5, y=0, yend=68, color=line_color, size=lw)
    # Center spot
    + annotate("point", x=52.5, y=34, color=line_color, size=1.8, shape="o", fill=line_color)
    # Left penalty area
    + annotate("rect", xmin=0, xmax=16.5, ymin=13.84, ymax=54.16, fill="none", color=line_color, size=lw)
    # Right penalty area
    + annotate("rect", xmin=88.5, xmax=105, ymin=13.84, ymax=54.16, fill="none", color=line_color, size=lw)
    # Left goal area
    + annotate("rect", xmin=0, xmax=5.5, ymin=24.84, ymax=43.16, fill="none", color=line_color, size=lw)
    # Right goal area
    + annotate("rect", xmin=99.5, xmax=105, ymin=24.84, ymax=43.16, fill="none", color=line_color, size=lw)
    # Penalty spots
    + annotate("point", x=11, y=34, color=line_color, size=1.2, shape="o", fill=line_color)
    + annotate("point", x=94, y=34, color=line_color, size=1.2, shape="o", fill=line_color)
    # Left goal posts
    + annotate("segment", x=-2, xend=-2, y=30.34, yend=37.66, color="#ffffff", size=1.5)
    + annotate("segment", x=-2, xend=0, y=30.34, yend=30.34, color="#ffffff", size=0.5)
    + annotate("segment", x=-2, xend=0, y=37.66, yend=37.66, color="#ffffff", size=0.5)
    # Right goal posts
    + annotate("segment", x=107, xend=107, y=30.34, yend=37.66, color="#ffffff", size=1.5)
    + annotate("segment", x=105, xend=107, y=30.34, yend=30.34, color="#ffffff", size=0.5)
    + annotate("segment", x=105, xend=107, y=37.66, yend=37.66, color="#ffffff", size=0.5)
    # Curves: center circle, penalty arcs, corner arcs
    + geom_path(data=all_curves, mapping=aes(x="cx", y="cy", group="grp"), color=line_color, size=lw, inherit_aes=False)
    # Pass arrows — thin and subtle to avoid midfield clutter
    + geom_segment(
        data=df_pass_arrows,
        mapping=aes(x="x", y="y", xend="x_end", yend="y_end", alpha="outcome"),
        color=event_colors["Pass"],
        size=0.4,
        arrow=arrow(length=0.10, type="open"),
        inherit_aes=False,
    )
    # Shot arrows — bolder to emphasize attacking intent
    + geom_segment(
        data=df_shot_arrows,
        mapping=aes(x="x", y="y", xend="x_end", yend="y_end", alpha="outcome"),
        color=event_colors["Shot"],
        size=0.9,
        arrow=arrow(length=0.18, type="open"),
        inherit_aes=False,
    )
    # All event markers — size driven by scale_size_manual (shots=8, others=4.5)
    + geom_point(stroke=0.4)
    # Scales
    + scale_color_manual(values=event_colors, name="Event Type")
    + scale_shape_manual(values=event_shapes, name="Event Type")
    + scale_alpha_manual(values={"Successful": 0.92, "Unsuccessful": 0.40}, name="Outcome")
    + scale_size_manual(values={"Pass": 4.5, "Shot": 8, "Tackle": 4.5, "Interception": 4.5}, name="Event Type")
    + scale_x_continuous(limits=(-10, 115), breaks=[])
    + scale_y_continuous(limits=(-8, 76), breaks=[])
    + coord_fixed(ratio=1)
    + labs(title=title, subtitle="120 match events: passes, shots, tackles & interceptions")
    + guides(
        color=guide_legend(override_aes={"size": 5}),
        alpha=guide_legend(override_aes={"size": 5, "alpha": [0.92, 0.40]}),
    )
    + theme(
        figure_size=(8, 4.5),
        plot_title=element_text(size=title_fontsize, weight="bold", color=INK, margin={"b": 4}),
        plot_subtitle=element_text(size=9, color=INK_SOFT, style="italic", margin={"b": 8}),
        panel_background=element_rect(fill=PAGE_BG, color="none"),
        plot_background=element_rect(fill=PAGE_BG, color="none"),
        panel_border=element_blank(),
        panel_grid_major=element_blank(),
        panel_grid_minor=element_blank(),
        axis_title=element_blank(),
        axis_text=element_blank(),
        axis_ticks=element_blank(),
        legend_title=element_text(size=9, weight="bold", color=INK),
        legend_text=element_text(size=8, color=INK_SOFT),
        legend_position="right",
        legend_background=element_rect(fill=ELEVATED_BG, color=INK_SOFT),
        legend_key=element_rect(fill=ELEVATED_BG, color="none"),
        plot_margin=0.04,
    )
)

# Save
plot.save(f"plot-{THEME}.png", dpi=400, width=8, height=4.5, units="in", verbose=False)
Runnable source as JSON, for any HTTP client: https://api.anyplot.ai/specs/scatter-pitch-events/plotnine/code. Any spec id and library id listed in llms-full.txt fit the same URL shape; every URL below is complete and callable.
{
  "spec_id": "scatter-pitch-events",
  "language": "python",
  "library": "plotnine",
  "page": "https://anyplot.ai/scatter-pitch-events/python/plotnine",
  "hub": "https://anyplot.ai/scatter-pitch-events",
  "code_json": "https://api.anyplot.ai/specs/scatter-pitch-events/plotnine/code",
  "spec_json": "https://api.anyplot.ai/specs/scatter-pitch-events",
  "render_light_png": "https://storage.googleapis.com/anyplot-images/plots/scatter-pitch-events/python/plotnine/plot-light.png",
  "render_dark_png": "https://storage.googleapis.com/anyplot-images/plots/scatter-pitch-events/python/plotnine/plot-dark.png",
  "quality_score": 88.0,
  "license": "MIT",
  "guide": "https://anyplot.ai/llms.txt"
}
Part of Soccer Pitch Event Map on anyplot.ai.