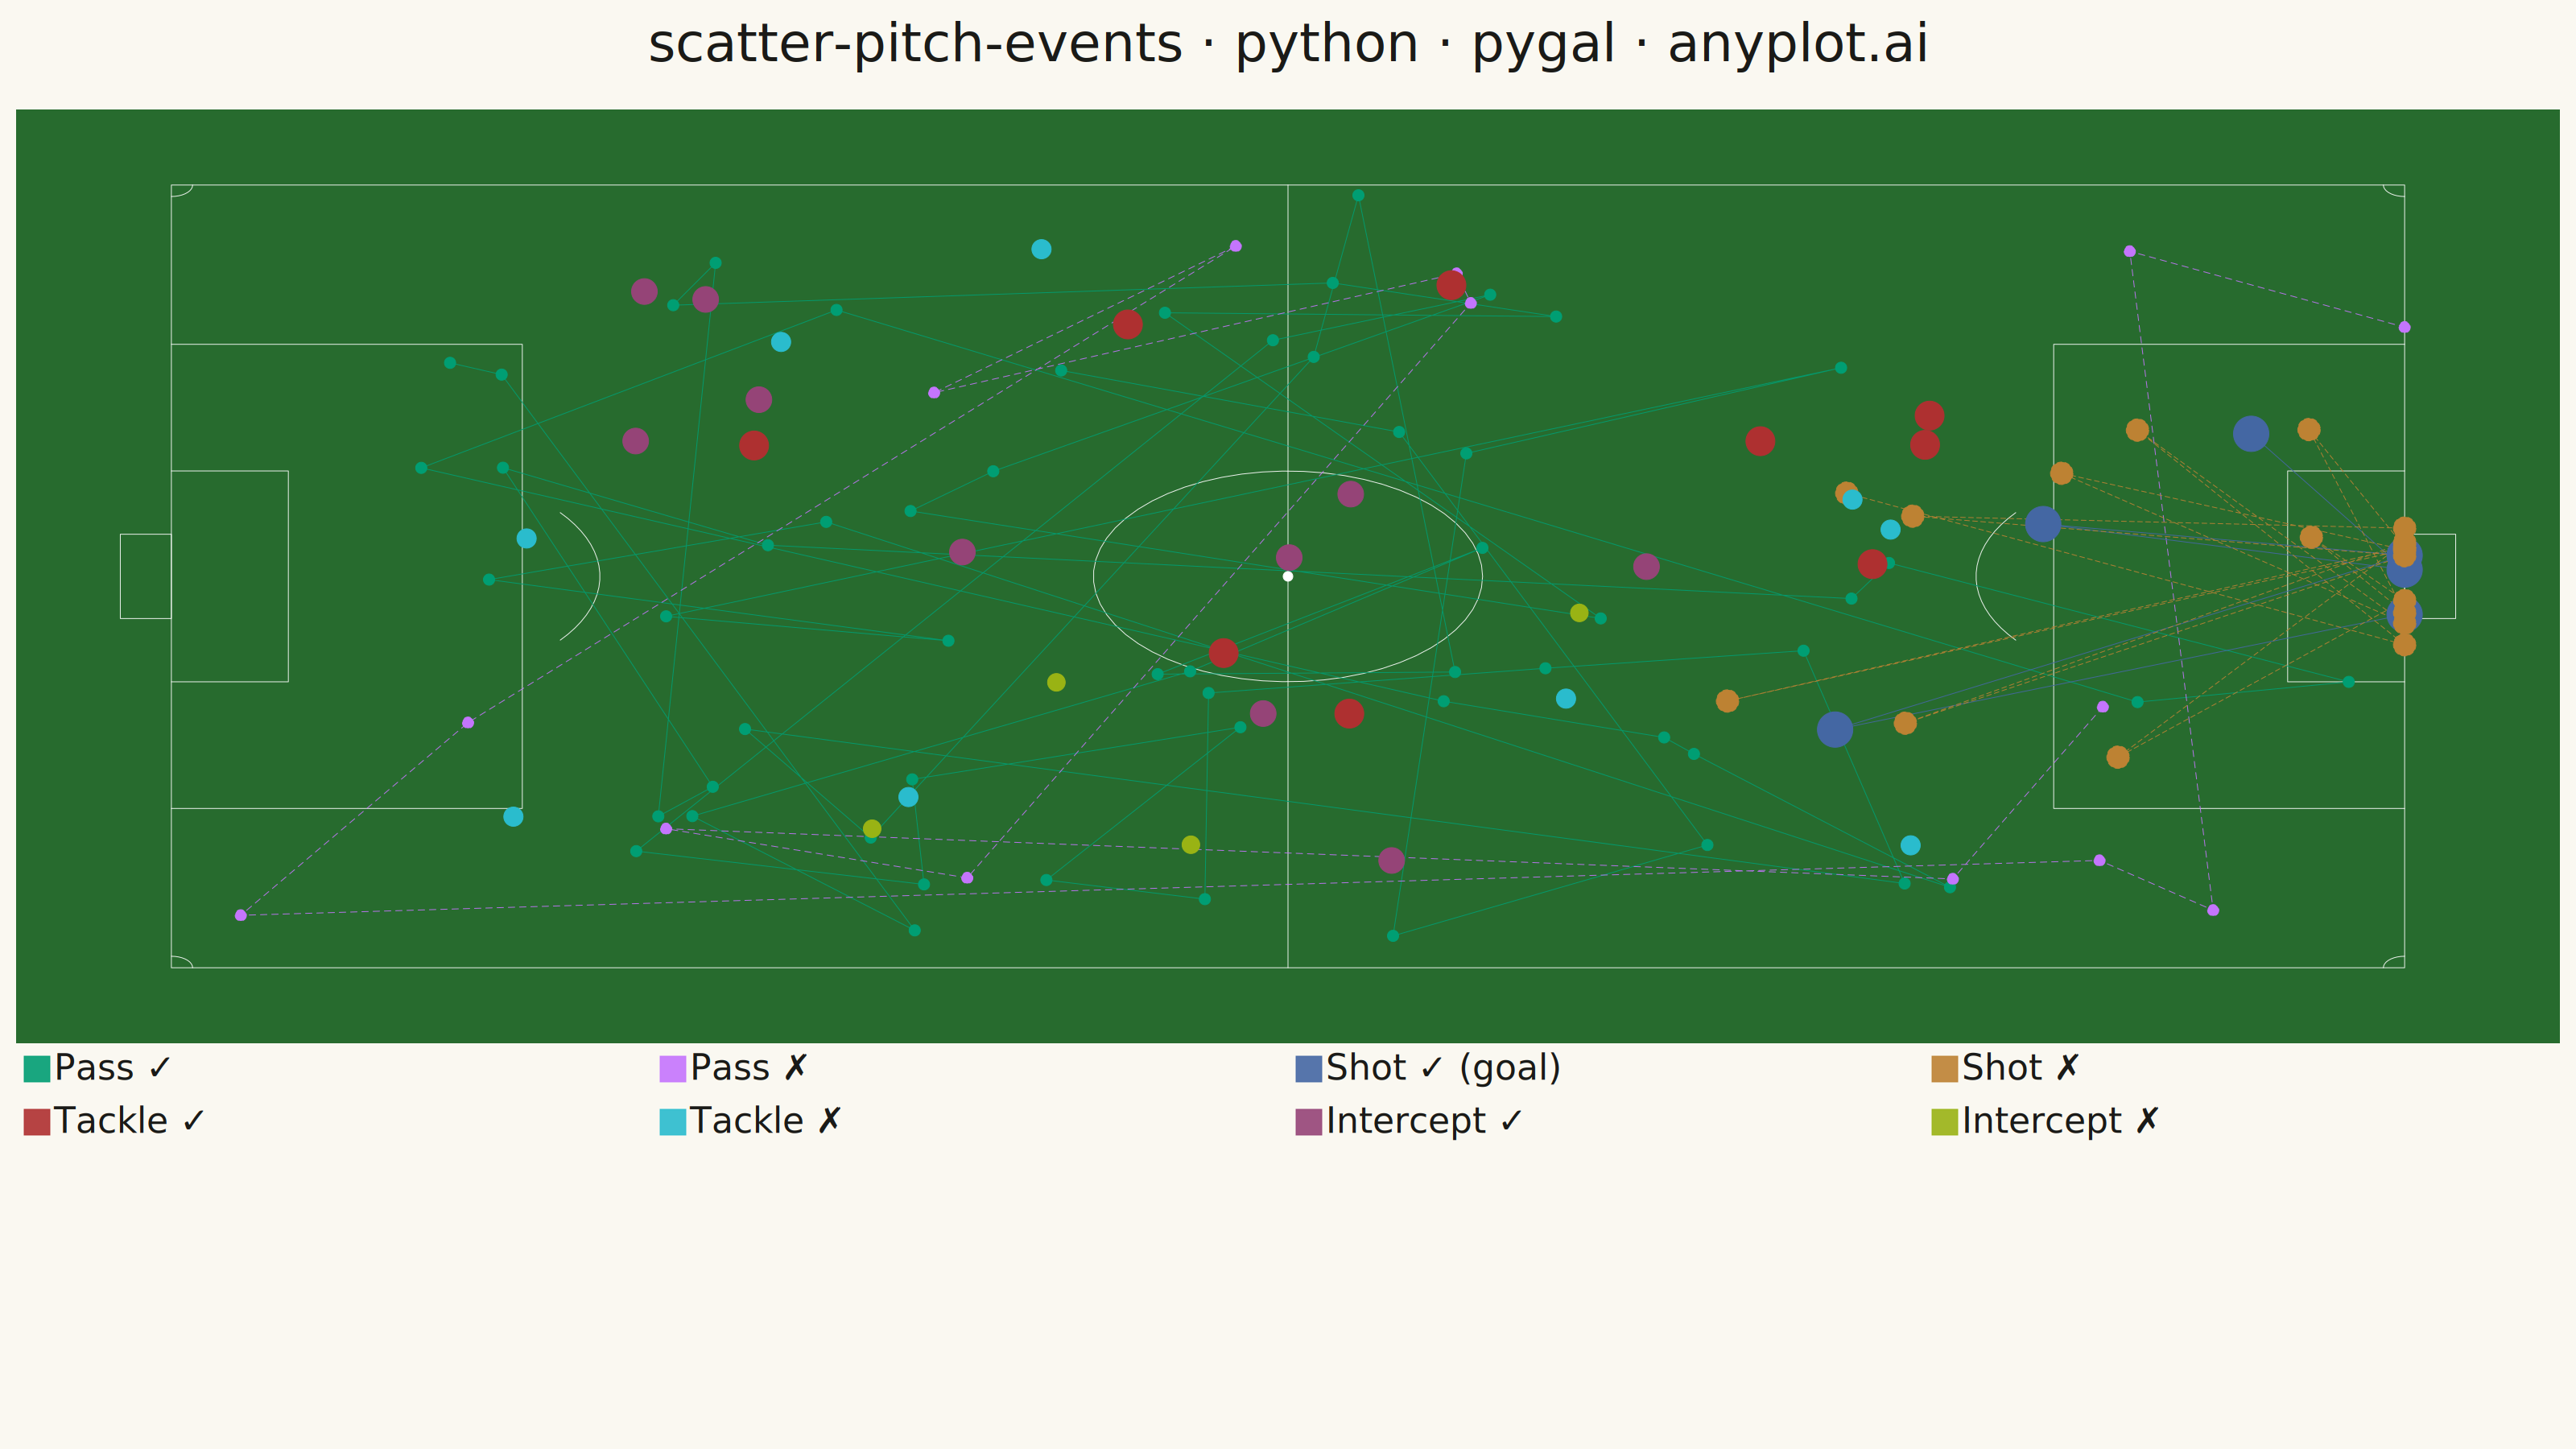
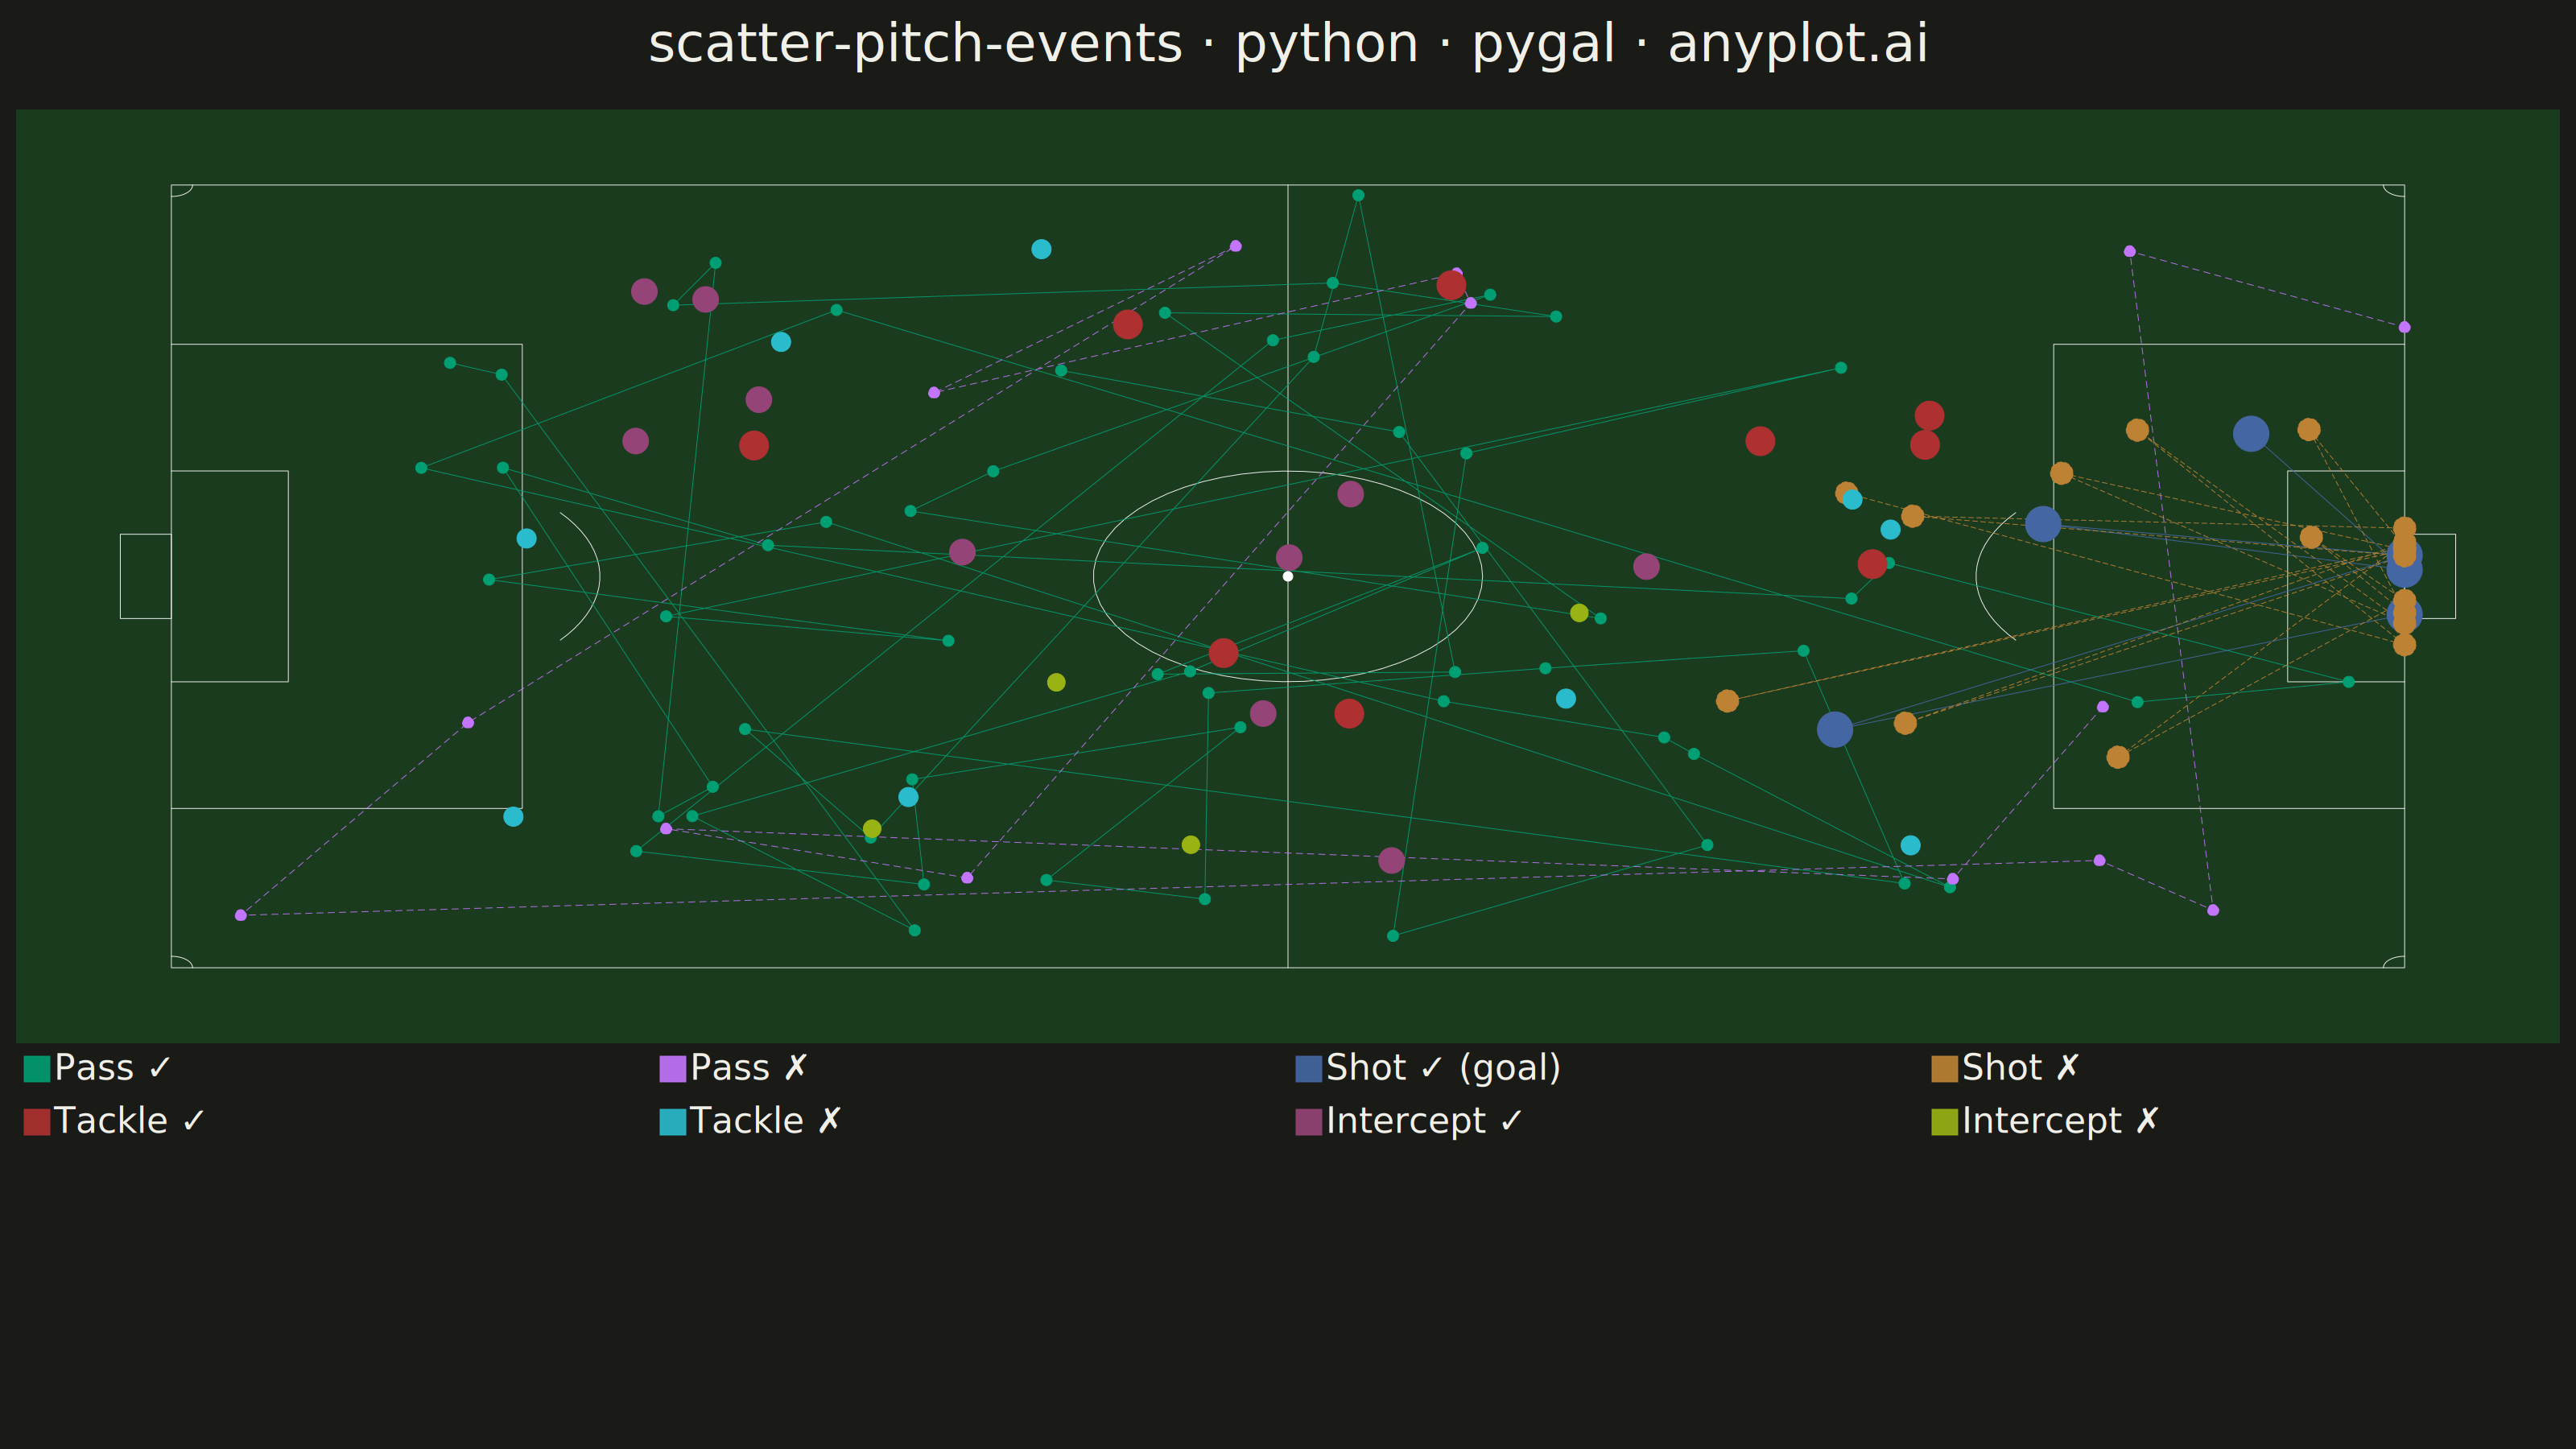
A soccer pitch event map positions match events (passes, shots, tackles, interceptions) as markers on an accurately scaled football pitch diagram. The pitch is drawn with standard markings including penalty areas, center circle, goal areas, and halfway line. Each event type uses distinct markers and colors, with directional arrows for passes and shots. This visualization is essential for tactical match analysis, scouting, and coaching in football analytics.
""" anyplot.ai
scatter-pitch-events: Soccer Pitch Event Map
Library: pygal 3.1.3 | Python 3.13.14
Quality: 87/100 | Updated: 2026-06-21
"""

import math
import os
import sys


# Remove script's own directory from sys.path so 'pygal' resolves to the
# installed package, not this file.
_here = os.path.dirname(os.path.abspath(__file__))
sys.path = [p for p in sys.path if os.path.realpath(p) != os.path.realpath(_here)]

import numpy as np
import pygal
from pygal.style import Style


# Theme tokens — Imprint palette, theme-adaptive chrome
THEME = os.getenv("ANYPLOT_THEME", "light")
PAGE_BG = "#FAF8F1" if THEME == "light" else "#1A1A17"
INK = "#1A1A17" if THEME == "light" else "#F0EFE8"
INK_MUTED = "#6B6A63" if THEME == "light" else "#A8A79F"

# Soccer pitch background — semantic green (grass), adapts saturation per theme
PITCH_BG = "#276b2e" if THEME == "light" else "#1b3b1f"

# Imprint palette — 8 event series in canonical order, first = brand green
IMPRINT_EVENTS = (
    "#009E73",  # Pass ✓ — brand green, first data series
    "#C475FD",  # Pass ✗ — lavender
    "#4467A3",  # Shot ✓ — blue
    "#BD8233",  # Shot ✗ — ochre
    "#AE3030",  # Tackle ✓ — matte red (semantic: defensive stop)
    "#2ABCCD",  # Tackle ✗ — cyan
    "#954477",  # Intercept ✓ — rose
    "#99B314",  # Intercept ✗ — lime
)

# Data — synthetic match events on a FIFA 105 m × 68 m pitch
np.random.seed(42)

n_passes = 35
n_shots = 12
n_tackles = 18
n_interceptions = 14

pass_x = np.random.uniform(10, 95, n_passes)
pass_y = np.random.uniform(5, 63, n_passes)
pass_end_x = np.clip(pass_x + np.random.uniform(-15, 25, n_passes), 0, 105)
pass_end_y = np.clip(pass_y + np.random.normal(0, 10, n_passes), 0, 68)
pass_outcome = np.random.choice(["successful", "unsuccessful"], n_passes, p=[0.75, 0.25])

shot_x = np.random.uniform(70, 104, n_shots)
shot_y = np.random.uniform(18, 50, n_shots)
shot_end_x = np.full(n_shots, 105.0)
shot_end_y = np.random.uniform(28, 40, n_shots)
shot_outcome = np.random.choice(["successful", "unsuccessful"], n_shots, p=[0.35, 0.65])

tackle_x = np.random.uniform(15, 85, n_tackles)
tackle_y = np.random.uniform(5, 63, n_tackles)
tackle_outcome = np.random.choice(["successful", "unsuccessful"], n_tackles, p=[0.6, 0.4])

interception_x = np.random.uniform(20, 80, n_interceptions)
interception_y = np.random.uniform(8, 60, n_interceptions)
interception_outcome = np.random.choice(["successful", "unsuccessful"], n_interceptions, p=[0.7, 0.3])

# Pitch markings — FIFA standard coordinates
pitch_outline = [(0, 0), (105, 0), (105, 68), (0, 68), (0, 0)]
halfway_line = [(52.5, 0), (52.5, 68)]
left_penalty = [(0, 13.84), (16.5, 13.84), (16.5, 54.16), (0, 54.16)]
right_penalty = [(105, 13.84), (88.5, 13.84), (88.5, 54.16), (105, 54.16)]
left_goal_area = [(0, 24.84), (5.5, 24.84), (5.5, 43.16), (0, 43.16)]
right_goal_area = [(105, 24.84), (99.5, 24.84), (99.5, 43.16), (105, 43.16)]

center_circle_angles = np.linspace(0, 2 * math.pi, 60)
center_circle = [(52.5 + 9.15 * math.cos(a), 34 + 9.15 * math.sin(a)) for a in center_circle_angles]

left_arc_angles = np.linspace(-0.65, 0.65, 20)
left_penalty_arc = [(11 + 9.15 * math.cos(a), 34 + 9.15 * math.sin(a)) for a in left_arc_angles]

right_arc_angles = np.linspace(math.pi - 0.65, math.pi + 0.65, 20)
right_penalty_arc = [(94 + 9.15 * math.cos(a), 34 + 9.15 * math.sin(a)) for a in right_arc_angles]

corner_angles_bl = np.linspace(0, math.pi / 2, 10)
corner_bl = [(math.cos(a), math.sin(a)) for a in corner_angles_bl]
corner_angles_br = np.linspace(math.pi / 2, math.pi, 10)
corner_br = [(105 + math.cos(a), math.sin(a)) for a in corner_angles_br]
corner_angles_tr = np.linspace(math.pi, 3 * math.pi / 2, 10)
corner_tr = [(105 + math.cos(a), 68 + math.sin(a)) for a in corner_angles_tr]
corner_angles_tl = np.linspace(3 * math.pi / 2, 2 * math.pi, 10)
corner_tl = [(math.cos(a), 68 + math.sin(a)) for a in corner_angles_tl]

# Goal posts — thin rectangles extending outward from each goal mouth
goal_y_min = 34 - 3.66  # 30.34
goal_y_max = 34 + 3.66  # 37.66
left_goal_post = [(-2.4, goal_y_min), (0, goal_y_min), (0, goal_y_max), (-2.4, goal_y_max), (-2.4, goal_y_min)]
right_goal_post = [(107.4, goal_y_min), (105, goal_y_min), (105, goal_y_max), (107.4, goal_y_max), (107.4, goal_y_min)]

# Style — 16 white pitch-marking colors + 8 Imprint event colors
PITCH_LINE = "#ffffffcc"
COLORS = tuple([PITCH_LINE] * 16) + IMPRINT_EVENTS

font = "DejaVu Sans, Helvetica, Arial, sans-serif"
title = "scatter-pitch-events · python · pygal · anyplot.ai"

custom_style = Style(
    background=PAGE_BG,
    plot_background=PITCH_BG,
    foreground=INK,
    foreground_strong=INK,
    foreground_subtle=INK_MUTED,
    guide_stroke_color=INK_MUTED,
    colors=COLORS,
    font_family=font,
    title_font_family=font,
    title_font_size=66,
    label_font_size=56,
    major_label_font_size=44,
    legend_font_size=44,
    legend_font_family=font,
    value_font_size=36,
    tooltip_font_size=30,
    tooltip_font_family=font,
    opacity=0.9,
    opacity_hover=1.0,
    stroke_opacity=0.9,
    stroke_opacity_hover=1,
)

# Chart
chart = pygal.XY(
    width=3200,
    height=1800,
    style=custom_style,
    title=title,
    show_legend=True,
    legend_at_bottom=True,
    legend_at_bottom_columns=4,
    legend_box_size=32,
    stroke=True,
    dots_size=0,
    show_x_guides=False,
    show_y_guides=False,
    show_x_labels=False,
    show_y_labels=False,
    xrange=(-5, 110),
    range=(-5, 73),
    margin_bottom=120,
    margin_left=20,
    margin_right=20,
    margin_top=60,
    print_values=False,
    print_zeroes=False,
    tooltip_border_radius=8,
    tooltip_fancy_mode=True,
    js=[],
)

# Pitch markings as line series (None title = excluded from legend)
thin = {"width": 4, "linecap": "round", "linejoin": "round"}

chart.add(
    None,
    pitch_outline,
    stroke=True,
    show_dots=False,
    stroke_style={"width": 6, "linecap": "round", "linejoin": "round"},
)
chart.add(None, halfway_line, stroke=True, show_dots=False, stroke_style=thin)
chart.add(None, left_penalty, stroke=True, show_dots=False, stroke_style=thin)
chart.add(None, right_penalty, stroke=True, show_dots=False, stroke_style=thin)
chart.add(None, left_goal_area, stroke=True, show_dots=False, stroke_style=thin)
chart.add(None, right_goal_area, stroke=True, show_dots=False, stroke_style=thin)
chart.add(None, center_circle, stroke=True, show_dots=False, stroke_style=thin)
chart.add(None, [(52.5, 34)], stroke=False, dots_size=6)
chart.add(None, left_penalty_arc, stroke=True, show_dots=False, stroke_style=thin)
chart.add(None, right_penalty_arc, stroke=True, show_dots=False, stroke_style=thin)
chart.add(None, corner_bl, stroke=True, show_dots=False, stroke_style={"width": 3, "linecap": "round"})
chart.add(None, corner_br, stroke=True, show_dots=False, stroke_style={"width": 3, "linecap": "round"})
chart.add(None, corner_tr, stroke=True, show_dots=False, stroke_style={"width": 3, "linecap": "round"})
chart.add(None, corner_tl, stroke=True, show_dots=False, stroke_style={"width": 3, "linecap": "round"})
chart.add(
    None,
    left_goal_post,
    stroke=True,
    show_dots=False,
    stroke_style={"width": 5, "linecap": "round", "linejoin": "round"},
)
chart.add(
    None,
    right_goal_post,
    stroke=True,
    show_dots=False,
    stroke_style={"width": 5, "linecap": "round", "linejoin": "round"},
)

# Passes as directional line segments (pygal None-break technique)
pass_succ_mask = pass_outcome == "successful"
pass_succ_lines = []
for sx, sy, ex, ey in zip(
    pass_x[pass_succ_mask], pass_y[pass_succ_mask], pass_end_x[pass_succ_mask], pass_end_y[pass_succ_mask], strict=True
):
    pass_succ_lines.append({"value": (float(sx), float(sy)), "label": f"Pass → ({float(ex):.0f}, {float(ey):.0f})"})
    pass_succ_lines.append((float(ex), float(ey)))
    pass_succ_lines.append(None)
chart.add(
    "Pass ✓",
    pass_succ_lines,
    stroke=True,
    show_dots=True,
    dots_size=7,
    stroke_style={"width": 2, "linecap": "round", "opacity": "0.85"},
)

pass_fail_mask = ~pass_succ_mask
pass_fail_lines = []
for sx, sy, ex, ey in zip(
    pass_x[pass_fail_mask], pass_y[pass_fail_mask], pass_end_x[pass_fail_mask], pass_end_y[pass_fail_mask], strict=True
):
    pass_fail_lines.append({"value": (float(sx), float(sy)), "label": f"Pass ✗ → ({float(ex):.0f}, {float(ey):.0f})"})
    pass_fail_lines.append((float(ex), float(ey)))
    pass_fail_lines.append(None)
chart.add(
    "Pass ✗",
    pass_fail_lines,
    stroke=True,
    show_dots=True,
    dots_size=7,
    stroke_style={"width": 2, "linecap": "round", "dasharray": "8,6", "opacity": "0.75"},
)

# Shots as directional lines (prominent — key events)
shot_succ_mask = shot_outcome == "successful"
shot_succ_lines = []
for sx, sy, ex, ey in zip(
    shot_x[shot_succ_mask], shot_y[shot_succ_mask], shot_end_x[shot_succ_mask], shot_end_y[shot_succ_mask], strict=True
):
    shot_succ_lines.append({"value": (float(sx), float(sy)), "label": "⚽ Goal!"})
    shot_succ_lines.append((float(ex), float(ey)))
    shot_succ_lines.append(None)
chart.add(
    "Shot ✓ (goal)",
    shot_succ_lines,
    stroke=True,
    show_dots=True,
    dots_size=22,
    stroke_style={"width": 7, "linecap": "round", "opacity": "0.65"},
)

shot_fail_mask = ~shot_succ_mask
shot_fail_lines = []
for sx, sy, ex, ey in zip(
    shot_x[shot_fail_mask], shot_y[shot_fail_mask], shot_end_x[shot_fail_mask], shot_end_y[shot_fail_mask], strict=True
):
    shot_fail_lines.append({"value": (float(sx), float(sy)), "label": "Shot missed"})
    shot_fail_lines.append((float(ex), float(ey)))
    shot_fail_lines.append(None)
chart.add(
    "Shot ✗",
    shot_fail_lines,
    stroke=True,
    show_dots=True,
    dots_size=14,
    stroke_style={"width": 5, "linecap": "round", "dasharray": "6,4", "opacity": "0.65"},
)

# Tackles as scatter dots
tackle_succ_mask = tackle_outcome == "successful"
tackle_succ_pts = [
    {"value": (float(x), float(y)), "label": "Tackle won"}
    for x, y in zip(tackle_x[tackle_succ_mask], tackle_y[tackle_succ_mask], strict=True)
]
chart.add("Tackle ✓", tackle_succ_pts, stroke=False, dots_size=18)

tackle_fail_mask = ~tackle_succ_mask
tackle_fail_pts = [
    {"value": (float(x), float(y)), "label": "Tackle lost"}
    for x, y in zip(tackle_x[tackle_fail_mask], tackle_y[tackle_fail_mask], strict=True)
]
chart.add("Tackle ✗", tackle_fail_pts, stroke=False, dots_size=12)

# Interceptions as scatter dots
int_succ_mask = interception_outcome == "successful"
int_succ_pts = [
    {"value": (float(x), float(y)), "label": "Interception"}
    for x, y in zip(interception_x[int_succ_mask], interception_y[int_succ_mask], strict=True)
]
chart.add("Intercept ✓", int_succ_pts, stroke=False, dots_size=16)

int_fail_mask = ~int_succ_mask
int_fail_pts = [
    {"value": (float(x), float(y)), "label": "Intercept missed"}
    for x, y in zip(interception_x[int_fail_mask], interception_y[int_fail_mask], strict=True)
]
chart.add("Intercept ✗", int_fail_pts, stroke=False, dots_size=11)

# Save
chart.render_to_png(f"plot-{THEME}.png")
with open(f"plot-{THEME}.html", "wb") as f:
    f.write(chart.render())
Runnable source as JSON, for any HTTP client: https://api.anyplot.ai/specs/scatter-pitch-events/pygal/code. Any spec id and library id listed in llms-full.txt fit the same URL shape; every URL below is complete and callable.
{
  "spec_id": "scatter-pitch-events",
  "language": "python",
  "library": "pygal",
  "page": "https://anyplot.ai/scatter-pitch-events/python/pygal",
  "hub": "https://anyplot.ai/scatter-pitch-events",
  "code_json": "https://api.anyplot.ai/specs/scatter-pitch-events/pygal/code",
  "spec_json": "https://api.anyplot.ai/specs/scatter-pitch-events",
  "render_light_png": "https://storage.googleapis.com/anyplot-images/plots/scatter-pitch-events/python/pygal/plot-light.png",
  "render_dark_png": "https://storage.googleapis.com/anyplot-images/plots/scatter-pitch-events/python/pygal/plot-dark.png",
  "interactive_light_html": "https://storage.googleapis.com/anyplot-images/plots/scatter-pitch-events/python/pygal/plot-light.html",
  "interactive_dark_html": "https://storage.googleapis.com/anyplot-images/plots/scatter-pitch-events/python/pygal/plot-dark.html",
  "quality_score": 87.0,
  "license": "MIT",
  "guide": "https://anyplot.ai/llms.txt"
}
Part of Soccer Pitch Event Map on anyplot.ai.