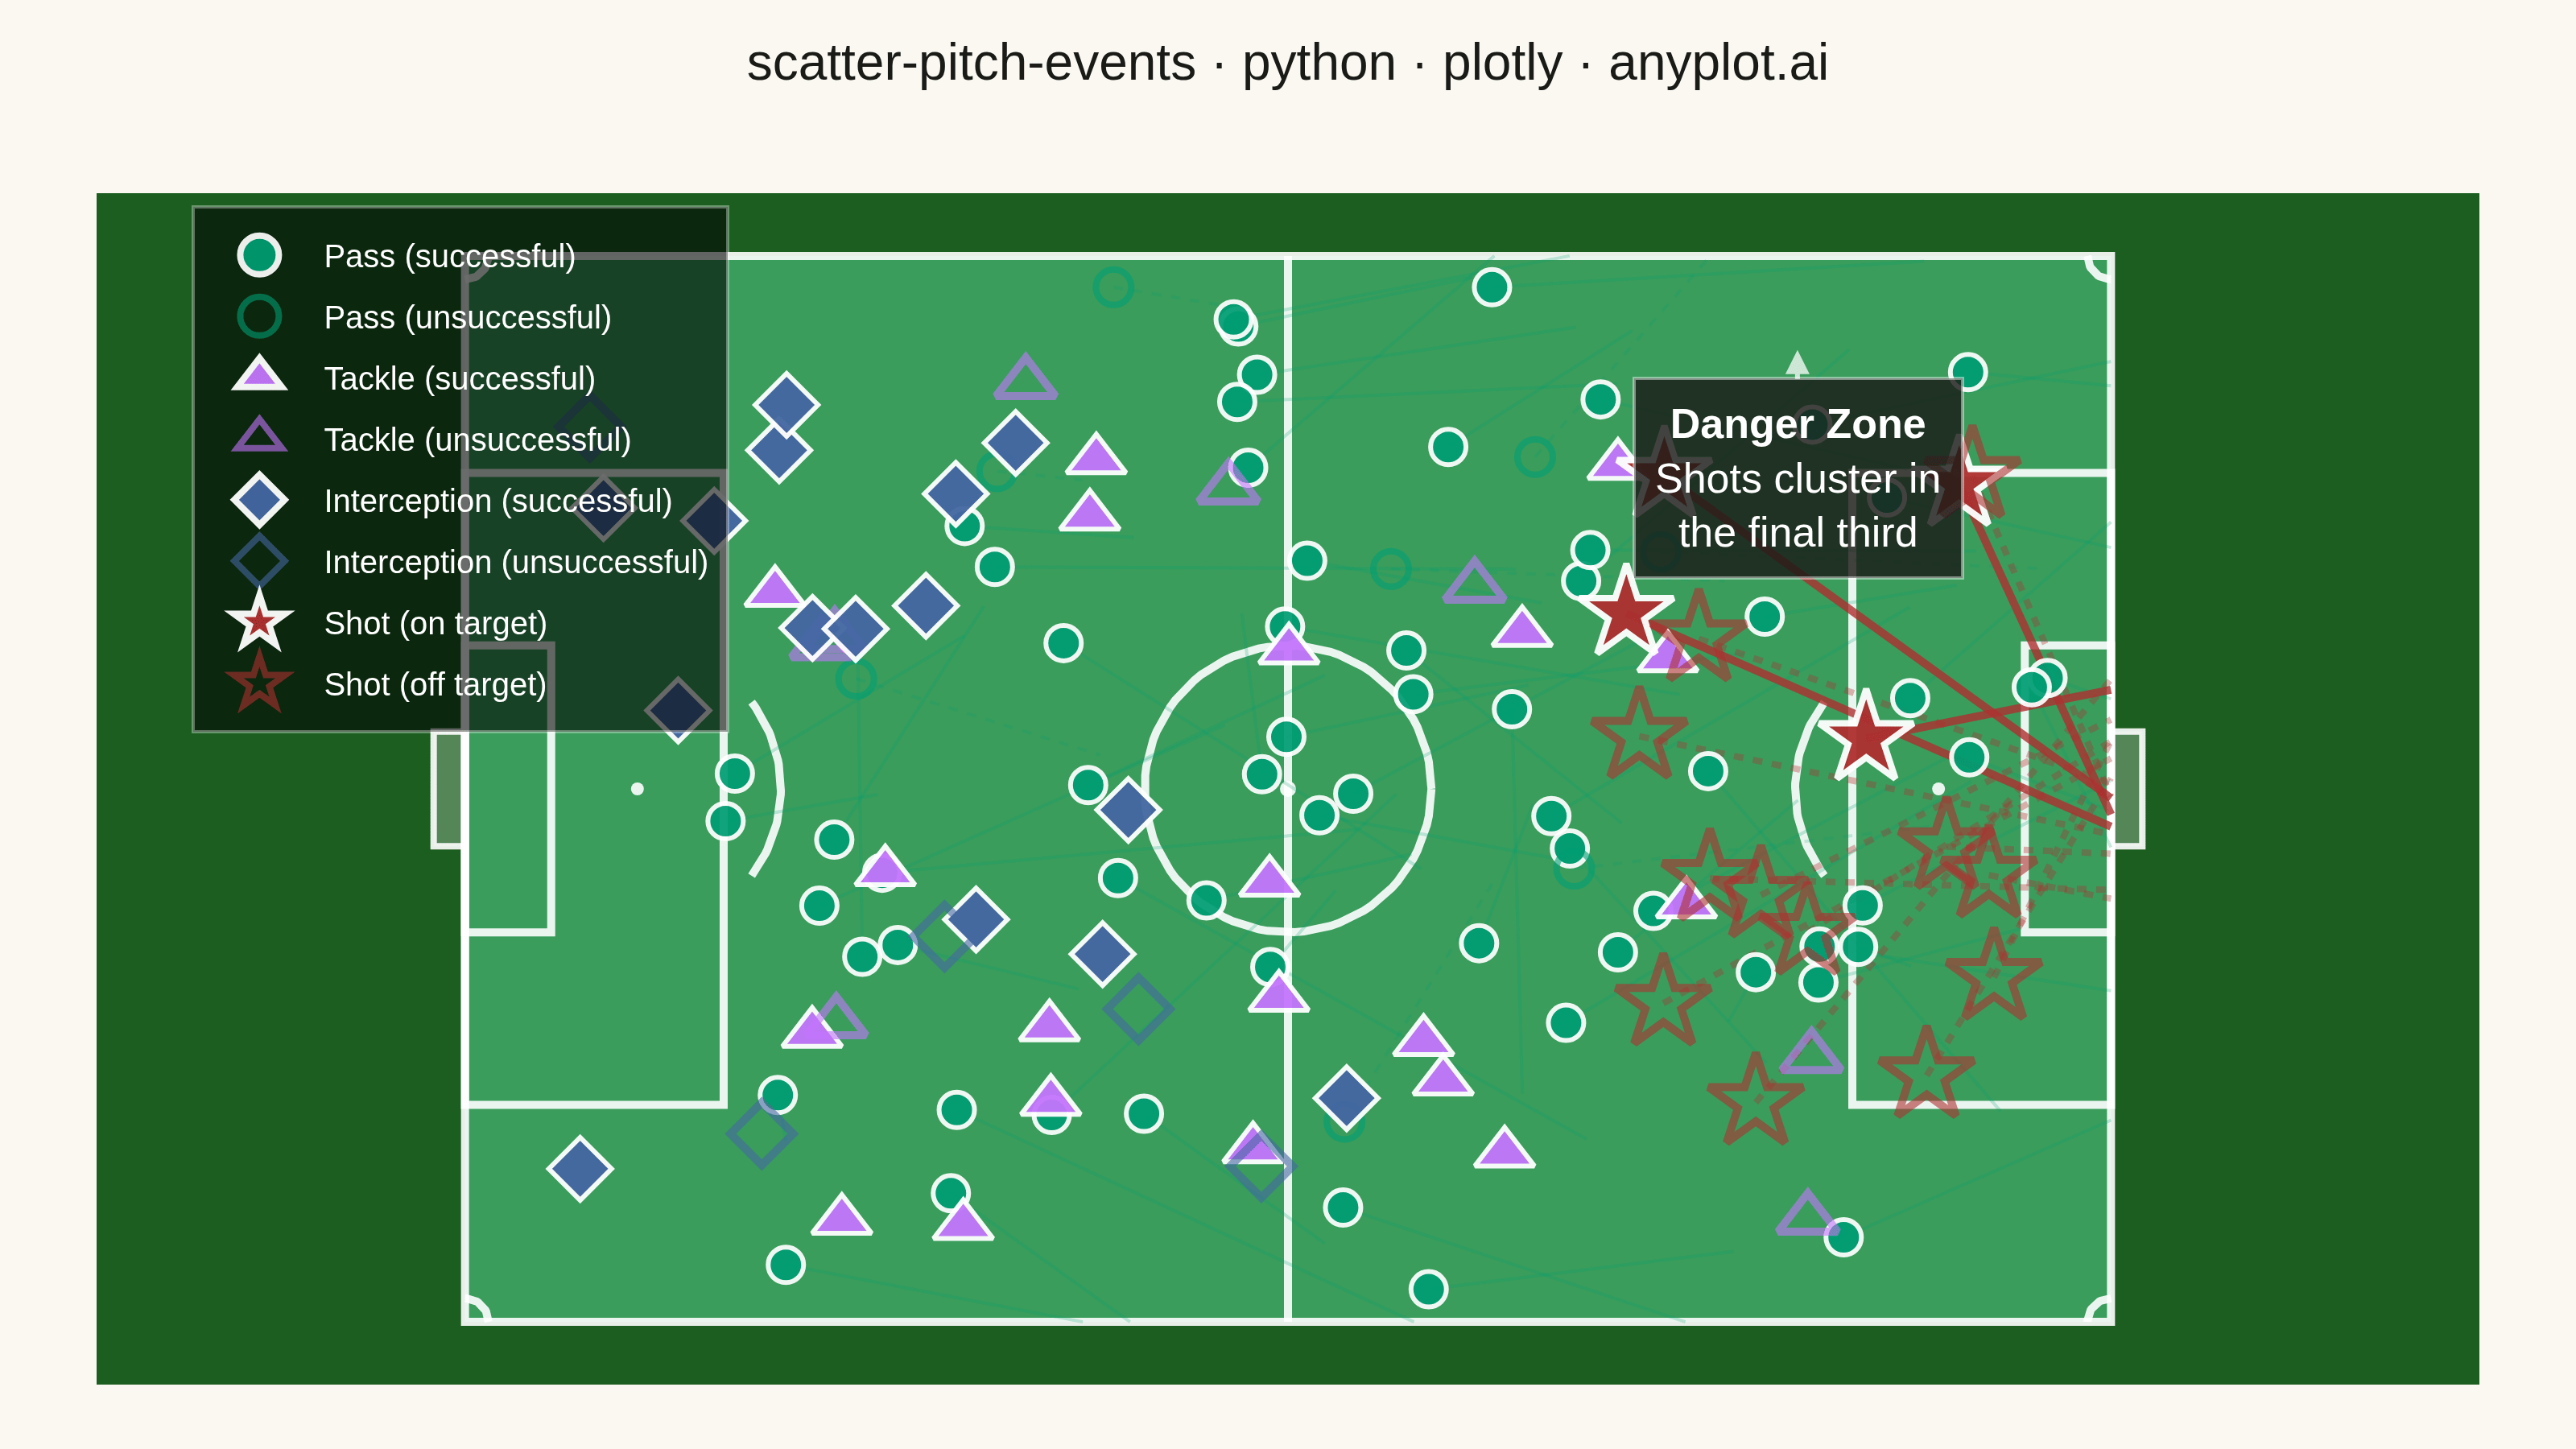
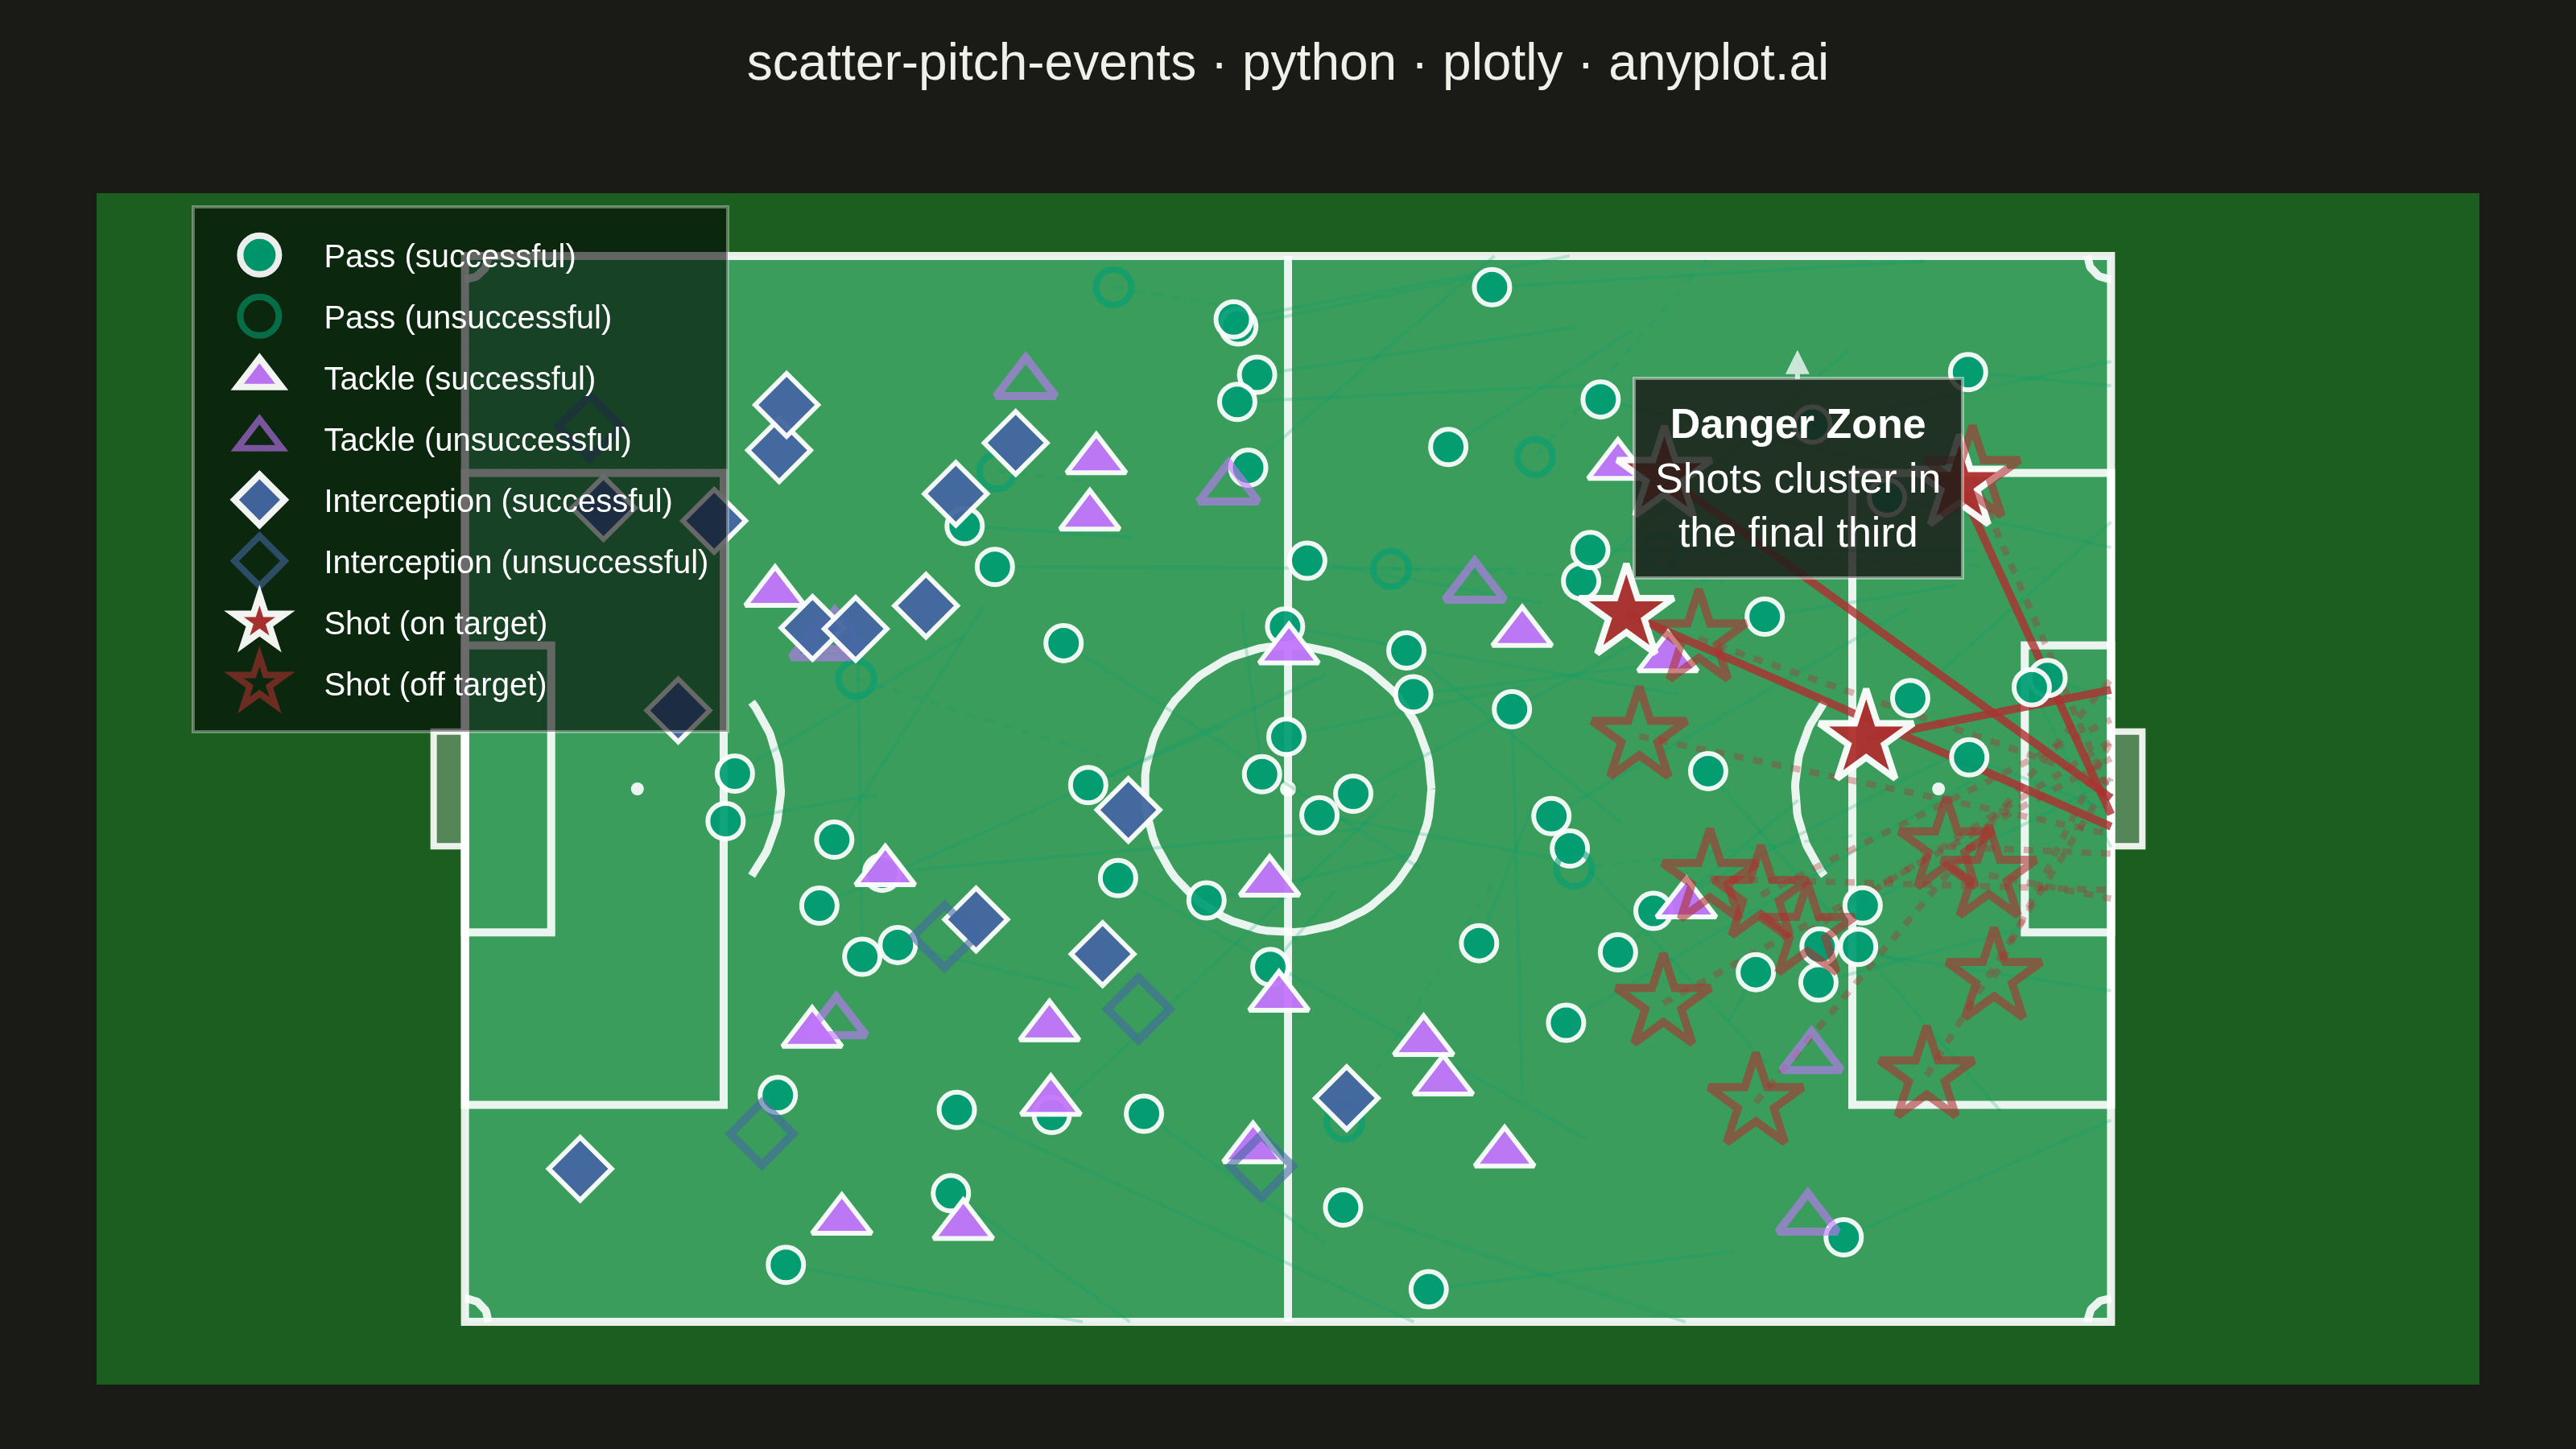
A soccer pitch event map positions match events (passes, shots, tackles, interceptions) as markers on an accurately scaled football pitch diagram. The pitch is drawn with standard markings including penalty areas, center circle, goal areas, and halfway line. Each event type uses distinct markers and colors, with directional arrows for passes and shots. This visualization is essential for tactical match analysis, scouting, and coaching in football analytics.
""" anyplot.ai
scatter-pitch-events: Soccer Pitch Event Map
Library: plotly 6.8.0 | Python 3.13.14
Quality: 91/100 | Updated: 2026-06-21
"""

import os

import numpy as np
import plotly.graph_objects as go


# Theme-adaptive chrome tokens
THEME = os.getenv("ANYPLOT_THEME", "light")
PAGE_BG = "#FAF8F1" if THEME == "light" else "#1A1A17"
INK = "#1A1A17" if THEME == "light" else "#F0EFE8"

# Imprint palette — event type colors (semantic assignment)
PASS_COLOR = "#009E73"  # Imprint brand green — passes (first categorical series)
TACKLE_COLOR = "#C475FD"  # Imprint lavender — tackles
INTERCEPT_COLOR = "#4467A3"  # Imprint blue — interceptions
SHOT_COLOR = "#AE3030"  # Imprint matte red — shots (semantic: danger/goal)

# Pitch domain colors — always green (real-world field, not theme-chrome)
PITCH_GRASS = "#3A9D5C"  # bright green playing surface
PITCH_SURROUND = "#1B5E20"  # dark green out-of-bounds surround
PITCH_LINE = "rgba(255,255,255,0.90)"
lw = 2.5

# Data
np.random.seed(42)
n_passes = 70
n_shots = 16
n_tackles = 28
n_interceptions = 20

# Passes — distributed across pitch, biased toward attacking half
pass_x = np.random.beta(2, 1.5, n_passes) * 105
pass_y = np.random.normal(34, 16, n_passes).clip(2, 66)
pass_end_x = (pass_x + np.random.normal(15, 8, n_passes)).clip(0, 105)
pass_end_y = (pass_y + np.random.normal(0, 10, n_passes)).clip(0, 68)
pass_success = np.random.choice([True, False], n_passes, p=[0.78, 0.22])

# Shots — concentrated in final third
shot_x = np.random.uniform(72, 98, n_shots)
shot_y = np.random.normal(34, 12, n_shots).clip(14, 54)
shot_end_x = np.full(n_shots, 105.0)
shot_end_y = np.random.normal(34, 4, n_shots).clip(27, 41)
shot_success = np.random.choice([True, False], n_shots, p=[0.33, 0.67])

# Tackles — midfield and defensive zones
tackle_x = np.random.beta(1.5, 2, n_tackles) * 80 + 10
tackle_y = np.random.uniform(5, 63, n_tackles)
tackle_success = np.random.choice([True, False], n_tackles, p=[0.65, 0.35])

# Interceptions — defensive and midfield zones
interception_x = np.random.beta(1.2, 2.5, n_interceptions) * 70 + 5
interception_y = np.random.uniform(8, 60, n_interceptions)
interception_success = np.random.choice([True, False], n_interceptions, p=[0.85, 0.15])

# Figure
fig = go.Figure()

# --- Pitch markings (layer="below" so event traces render on top) ---

# Playing surface fill
fig.add_shape(
    type="rect",
    x0=0,
    y0=0,
    x1=105,
    y1=68,
    line={"color": PITCH_LINE, "width": lw},
    fillcolor=PITCH_GRASS,
    layer="below",
)

# Halfway line
fig.add_shape(type="line", x0=52.5, y0=0, x1=52.5, y1=68, line={"color": PITCH_LINE, "width": lw}, layer="below")

# Penalty areas
fig.add_shape(type="rect", x0=0, y0=13.84, x1=16.5, y1=54.16, line={"color": PITCH_LINE, "width": lw}, layer="below")
fig.add_shape(type="rect", x0=88.5, y0=13.84, x1=105, y1=54.16, line={"color": PITCH_LINE, "width": lw}, layer="below")

# Goal areas (6-yard box)
fig.add_shape(type="rect", x0=0, y0=24.84, x1=5.5, y1=43.16, line={"color": PITCH_LINE, "width": lw}, layer="below")
fig.add_shape(type="rect", x0=99.5, y0=24.84, x1=105, y1=43.16, line={"color": PITCH_LINE, "width": lw}, layer="below")

# Goal posts
fig.add_shape(
    type="rect",
    x0=-2,
    y0=30.34,
    x1=0,
    y1=37.66,
    line={"color": PITCH_LINE, "width": 2},
    fillcolor="rgba(255,255,255,0.25)",
    layer="below",
)
fig.add_shape(
    type="rect",
    x0=105,
    y0=30.34,
    x1=107,
    y1=37.66,
    line={"color": PITCH_LINE, "width": 2},
    fillcolor="rgba(255,255,255,0.25)",
    layer="below",
)

# Center circle
theta = np.linspace(0, 2 * np.pi, 100)
fig.add_trace(
    go.Scatter(
        x=52.5 + 9.15 * np.cos(theta),
        y=34 + 9.15 * np.sin(theta),
        mode="lines",
        line={"color": PITCH_LINE, "width": lw},
        showlegend=False,
        hoverinfo="skip",
    )
)

# Center spot
fig.add_trace(
    go.Scatter(
        x=[52.5], y=[34], mode="markers", marker={"size": 5, "color": PITCH_LINE}, showlegend=False, hoverinfo="skip"
    )
)

# Penalty spots
fig.add_trace(
    go.Scatter(
        x=[11, 94],
        y=[34, 34],
        mode="markers",
        marker={"size": 4, "color": PITCH_LINE},
        showlegend=False,
        hoverinfo="skip",
    )
)

# Penalty arcs (outside penalty area)
la = np.linspace(-0.65, 0.65, 50)
fig.add_trace(
    go.Scatter(
        x=11 + 9.15 * np.cos(la),
        y=34 + 9.15 * np.sin(la),
        mode="lines",
        line={"color": PITCH_LINE, "width": lw},
        showlegend=False,
        hoverinfo="skip",
    )
)
ra = np.linspace(np.pi - 0.65, np.pi + 0.65, 50)
fig.add_trace(
    go.Scatter(
        x=94 + 9.15 * np.cos(ra),
        y=34 + 9.15 * np.sin(ra),
        mode="lines",
        line={"color": PITCH_LINE, "width": lw},
        showlegend=False,
        hoverinfo="skip",
    )
)

# Corner arcs
for cx_pos, cy_pos in [(0, 0), (0, 68), (105, 0), (105, 68)]:
    start = (
        0
        if cx_pos == 0 and cy_pos == 0
        else (
            np.pi * 1.5 if cx_pos == 0 and cy_pos == 68 else (np.pi * 0.5 if cx_pos == 105 and cy_pos == 0 else np.pi)
        )
    )
    ct = np.linspace(start, start + np.pi / 2, 25)
    fig.add_trace(
        go.Scatter(
            x=cx_pos + 1.5 * np.cos(ct),
            y=cy_pos + 1.5 * np.sin(ct),
            mode="lines",
            line={"color": PITCH_LINE, "width": lw},
            showlegend=False,
            hoverinfo="skip",
        )
    )

# --- Pass direction lines (None-separator batching) ---
pass_s_xs, pass_s_ys = [], []
for i in np.where(pass_success)[0]:
    pass_s_xs.extend([pass_x[i], pass_end_x[i], None])
    pass_s_ys.extend([pass_y[i], pass_end_y[i], None])
fig.add_trace(
    go.Scatter(
        x=pass_s_xs,
        y=pass_s_ys,
        mode="lines",
        line={"color": "rgba(0,158,115,0.22)", "width": 1},
        showlegend=False,
        hoverinfo="skip",
    )
)

pass_u_xs, pass_u_ys = [], []
for i in np.where(~pass_success)[0]:
    pass_u_xs.extend([pass_x[i], pass_end_x[i], None])
    pass_u_ys.extend([pass_y[i], pass_end_y[i], None])
fig.add_trace(
    go.Scatter(
        x=pass_u_xs,
        y=pass_u_ys,
        mode="lines",
        # raised from 0.08 → 0.18 so unsuccessful lines are visible in static render
        line={"color": "rgba(0,158,115,0.18)", "width": 1, "dash": "dot"},
        showlegend=False,
        hoverinfo="skip",
    )
)

# --- Shot direction lines ---
shot_s_xs, shot_s_ys = [], []
for i in np.where(shot_success)[0]:
    shot_s_xs.extend([shot_x[i], shot_end_x[i], None])
    shot_s_ys.extend([shot_y[i], shot_end_y[i], None])
fig.add_trace(
    go.Scatter(
        x=shot_s_xs,
        y=shot_s_ys,
        mode="lines",
        line={"color": "rgba(174,48,48,0.8)", "width": 2.5},
        showlegend=False,
        hoverinfo="skip",
    )
)

shot_u_xs, shot_u_ys = [], []
for i in np.where(~shot_success)[0]:
    shot_u_xs.extend([shot_x[i], shot_end_x[i], None])
    shot_u_ys.extend([shot_y[i], shot_end_y[i], None])
fig.add_trace(
    go.Scatter(
        x=shot_u_xs,
        y=shot_u_ys,
        mode="lines",
        line={"color": "rgba(174,48,48,0.35)", "width": 2, "dash": "dot"},
        showlegend=False,
        hoverinfo="skip",
    )
)

# --- Event markers ---

# Passes (circles)
fig.add_trace(
    go.Scatter(
        x=pass_x[pass_success],
        y=pass_y[pass_success],
        mode="markers",
        marker={
            "size": 11,
            "color": PASS_COLOR,
            "opacity": 0.92,
            "symbol": "circle",
            "line": {"width": 1.5, "color": "white"},
        },
        name="Pass (successful)",
        hovertemplate="<b>Pass</b><br>x: %{x:.0f}m, y: %{y:.0f}m<extra></extra>",
    )
)
fig.add_trace(
    go.Scatter(
        x=pass_x[~pass_success],
        y=pass_y[~pass_success],
        mode="markers",
        marker={
            "size": 11,
            "color": PASS_COLOR,
            "opacity": 0.6,
            "symbol": "circle-open",
            "line": {"width": 2, "color": PASS_COLOR},
        },
        name="Pass (unsuccessful)",
        hovertemplate="<b>Pass (missed)</b><br>x: %{x:.0f}m, y: %{y:.0f}m<extra></extra>",
    )
)

# Tackles (triangles)
fig.add_trace(
    go.Scatter(
        x=tackle_x[tackle_success],
        y=tackle_y[tackle_success],
        mode="markers",
        marker={
            "size": 16,
            "color": TACKLE_COLOR,
            "opacity": 0.95,
            "symbol": "triangle-up",
            "line": {"width": 1.5, "color": "white"},
        },
        name="Tackle (successful)",
        hovertemplate="<b>Tackle</b><br>x: %{x:.0f}m, y: %{y:.0f}m<extra></extra>",
    )
)
fig.add_trace(
    go.Scatter(
        x=tackle_x[~tackle_success],
        y=tackle_y[~tackle_success],
        mode="markers",
        marker={
            "size": 16,
            "color": TACKLE_COLOR,
            "opacity": 0.6,
            "symbol": "triangle-up-open",
            "line": {"width": 2.5, "color": TACKLE_COLOR},
        },
        name="Tackle (unsuccessful)",
        hovertemplate="<b>Tackle (missed)</b><br>x: %{x:.0f}m, y: %{y:.0f}m<extra></extra>",
    )
)

# Interceptions (diamonds)
fig.add_trace(
    go.Scatter(
        x=interception_x[interception_success],
        y=interception_y[interception_success],
        mode="markers",
        marker={
            "size": 15,
            "color": INTERCEPT_COLOR,
            "opacity": 0.95,
            "symbol": "diamond",
            "line": {"width": 1.5, "color": "white"},
        },
        name="Interception (successful)",
        hovertemplate="<b>Interception</b><br>x: %{x:.0f}m, y: %{y:.0f}m<extra></extra>",
    )
)
fig.add_trace(
    go.Scatter(
        x=interception_x[~interception_success],
        y=interception_y[~interception_success],
        mode="markers",
        marker={
            "size": 15,
            "color": INTERCEPT_COLOR,
            "opacity": 0.6,
            "symbol": "diamond-open",
            "line": {"width": 2.5, "color": INTERCEPT_COLOR},
        },
        name="Interception (unsuccessful)",
        hovertemplate="<b>Interception (missed)</b><br>x: %{x:.0f}m, y: %{y:.0f}m<extra></extra>",
    )
)

# Shots (stars — drawn last to sit above other event markers)
fig.add_trace(
    go.Scatter(
        x=shot_x[shot_success],
        y=shot_y[shot_success],
        mode="markers",
        marker={
            "size": 22,
            "color": SHOT_COLOR,
            "opacity": 0.95,
            "symbol": "star",
            "line": {"width": 2, "color": "white"},
        },
        name="Shot (on target)",
        hovertemplate="<b>Shot (on target)</b><br>x: %{x:.0f}m, y: %{y:.0f}m<extra></extra>",
    )
)
fig.add_trace(
    go.Scatter(
        x=shot_x[~shot_success],
        y=shot_y[~shot_success],
        mode="markers",
        marker={
            "size": 22,
            "color": SHOT_COLOR,
            "opacity": 0.6,
            "symbol": "star-open",
            "line": {"width": 2.5, "color": SHOT_COLOR},
        },
        name="Shot (off target)",
        hovertemplate="<b>Shot (off target)</b><br>x: %{x:.0f}m, y: %{y:.0f}m<extra></extra>",
    )
)

# Tactical annotation — highlight the shot-dense zone
fig.add_annotation(
    x=85,
    y=62,
    text="<b>Danger Zone</b><br>Shots cluster in<br>the final third",
    showarrow=True,
    arrowhead=2,
    arrowsize=1,
    arrowwidth=1.5,
    arrowcolor="rgba(255,255,255,0.75)",
    ax=0,
    ay=40,
    font={"size": 13, "color": "white", "family": "Arial, sans-serif"},
    bgcolor="rgba(27,27,23,0.82)",
    bordercolor="rgba(255,255,255,0.45)",
    borderwidth=1,
    borderpad=6,
)

# Layout
fig.update_layout(
    autosize=False,
    title={
        "text": "scatter-pitch-events · python · plotly · anyplot.ai",
        "font": {"size": 16, "color": INK, "family": "Arial Black, Arial, sans-serif"},
        "x": 0.5,
        "xanchor": "center",
        "y": 0.97,
    },
    xaxis={
        "range": [-4, 109],
        "showgrid": False,
        "zeroline": False,
        "showticklabels": False,
        "showline": False,
        "fixedrange": True,
    },
    yaxis={
        "range": [-4, 72],
        "showgrid": False,
        "zeroline": False,
        "showticklabels": False,
        "showline": False,
        "fixedrange": True,
        "scaleanchor": "x",
        "scaleratio": 1,
    },
    plot_bgcolor=PITCH_SURROUND,
    paper_bgcolor=PAGE_BG,
    margin={"l": 30, "r": 30, "t": 60, "b": 20},
    legend={
        "font": {"size": 10, "color": "white", "family": "Arial, sans-serif"},
        "bgcolor": "rgba(0,0,0,0.58)",
        "bordercolor": "rgba(255,255,255,0.35)",
        "borderwidth": 1,
        # shifted right to sit clearly inside the pitch (avoids left-boundary overlap)
        "x": 0.04,
        "y": 0.99,
        "xanchor": "left",
        "yanchor": "top",
        "itemsizing": "constant",
        "tracegroupgap": 3,
    },
    hoverlabel={"bgcolor": "white", "font_size": 14},
)

# Save — theme-suffixed filenames; 3200×1800 landscape target
fig.write_image(f"plot-{THEME}.png", width=800, height=450, scale=4)
fig.write_html(f"plot-{THEME}.html", include_plotlyjs="cdn")
Runnable source as JSON, for any HTTP client: https://api.anyplot.ai/specs/scatter-pitch-events/plotly/code. Any spec id and library id listed in llms-full.txt fit the same URL shape; every URL below is complete and callable.
{
  "spec_id": "scatter-pitch-events",
  "language": "python",
  "library": "plotly",
  "page": "https://anyplot.ai/scatter-pitch-events/python/plotly",
  "hub": "https://anyplot.ai/scatter-pitch-events",
  "code_json": "https://api.anyplot.ai/specs/scatter-pitch-events/plotly/code",
  "spec_json": "https://api.anyplot.ai/specs/scatter-pitch-events",
  "render_light_png": "https://storage.googleapis.com/anyplot-images/plots/scatter-pitch-events/python/plotly/plot-light.png",
  "render_dark_png": "https://storage.googleapis.com/anyplot-images/plots/scatter-pitch-events/python/plotly/plot-dark.png",
  "interactive_light_html": "https://storage.googleapis.com/anyplot-images/plots/scatter-pitch-events/python/plotly/plot-light.html",
  "interactive_dark_html": "https://storage.googleapis.com/anyplot-images/plots/scatter-pitch-events/python/plotly/plot-dark.html",
  "quality_score": 91.0,
  "license": "MIT",
  "guide": "https://anyplot.ai/llms.txt"
}
Part of Soccer Pitch Event Map on anyplot.ai.