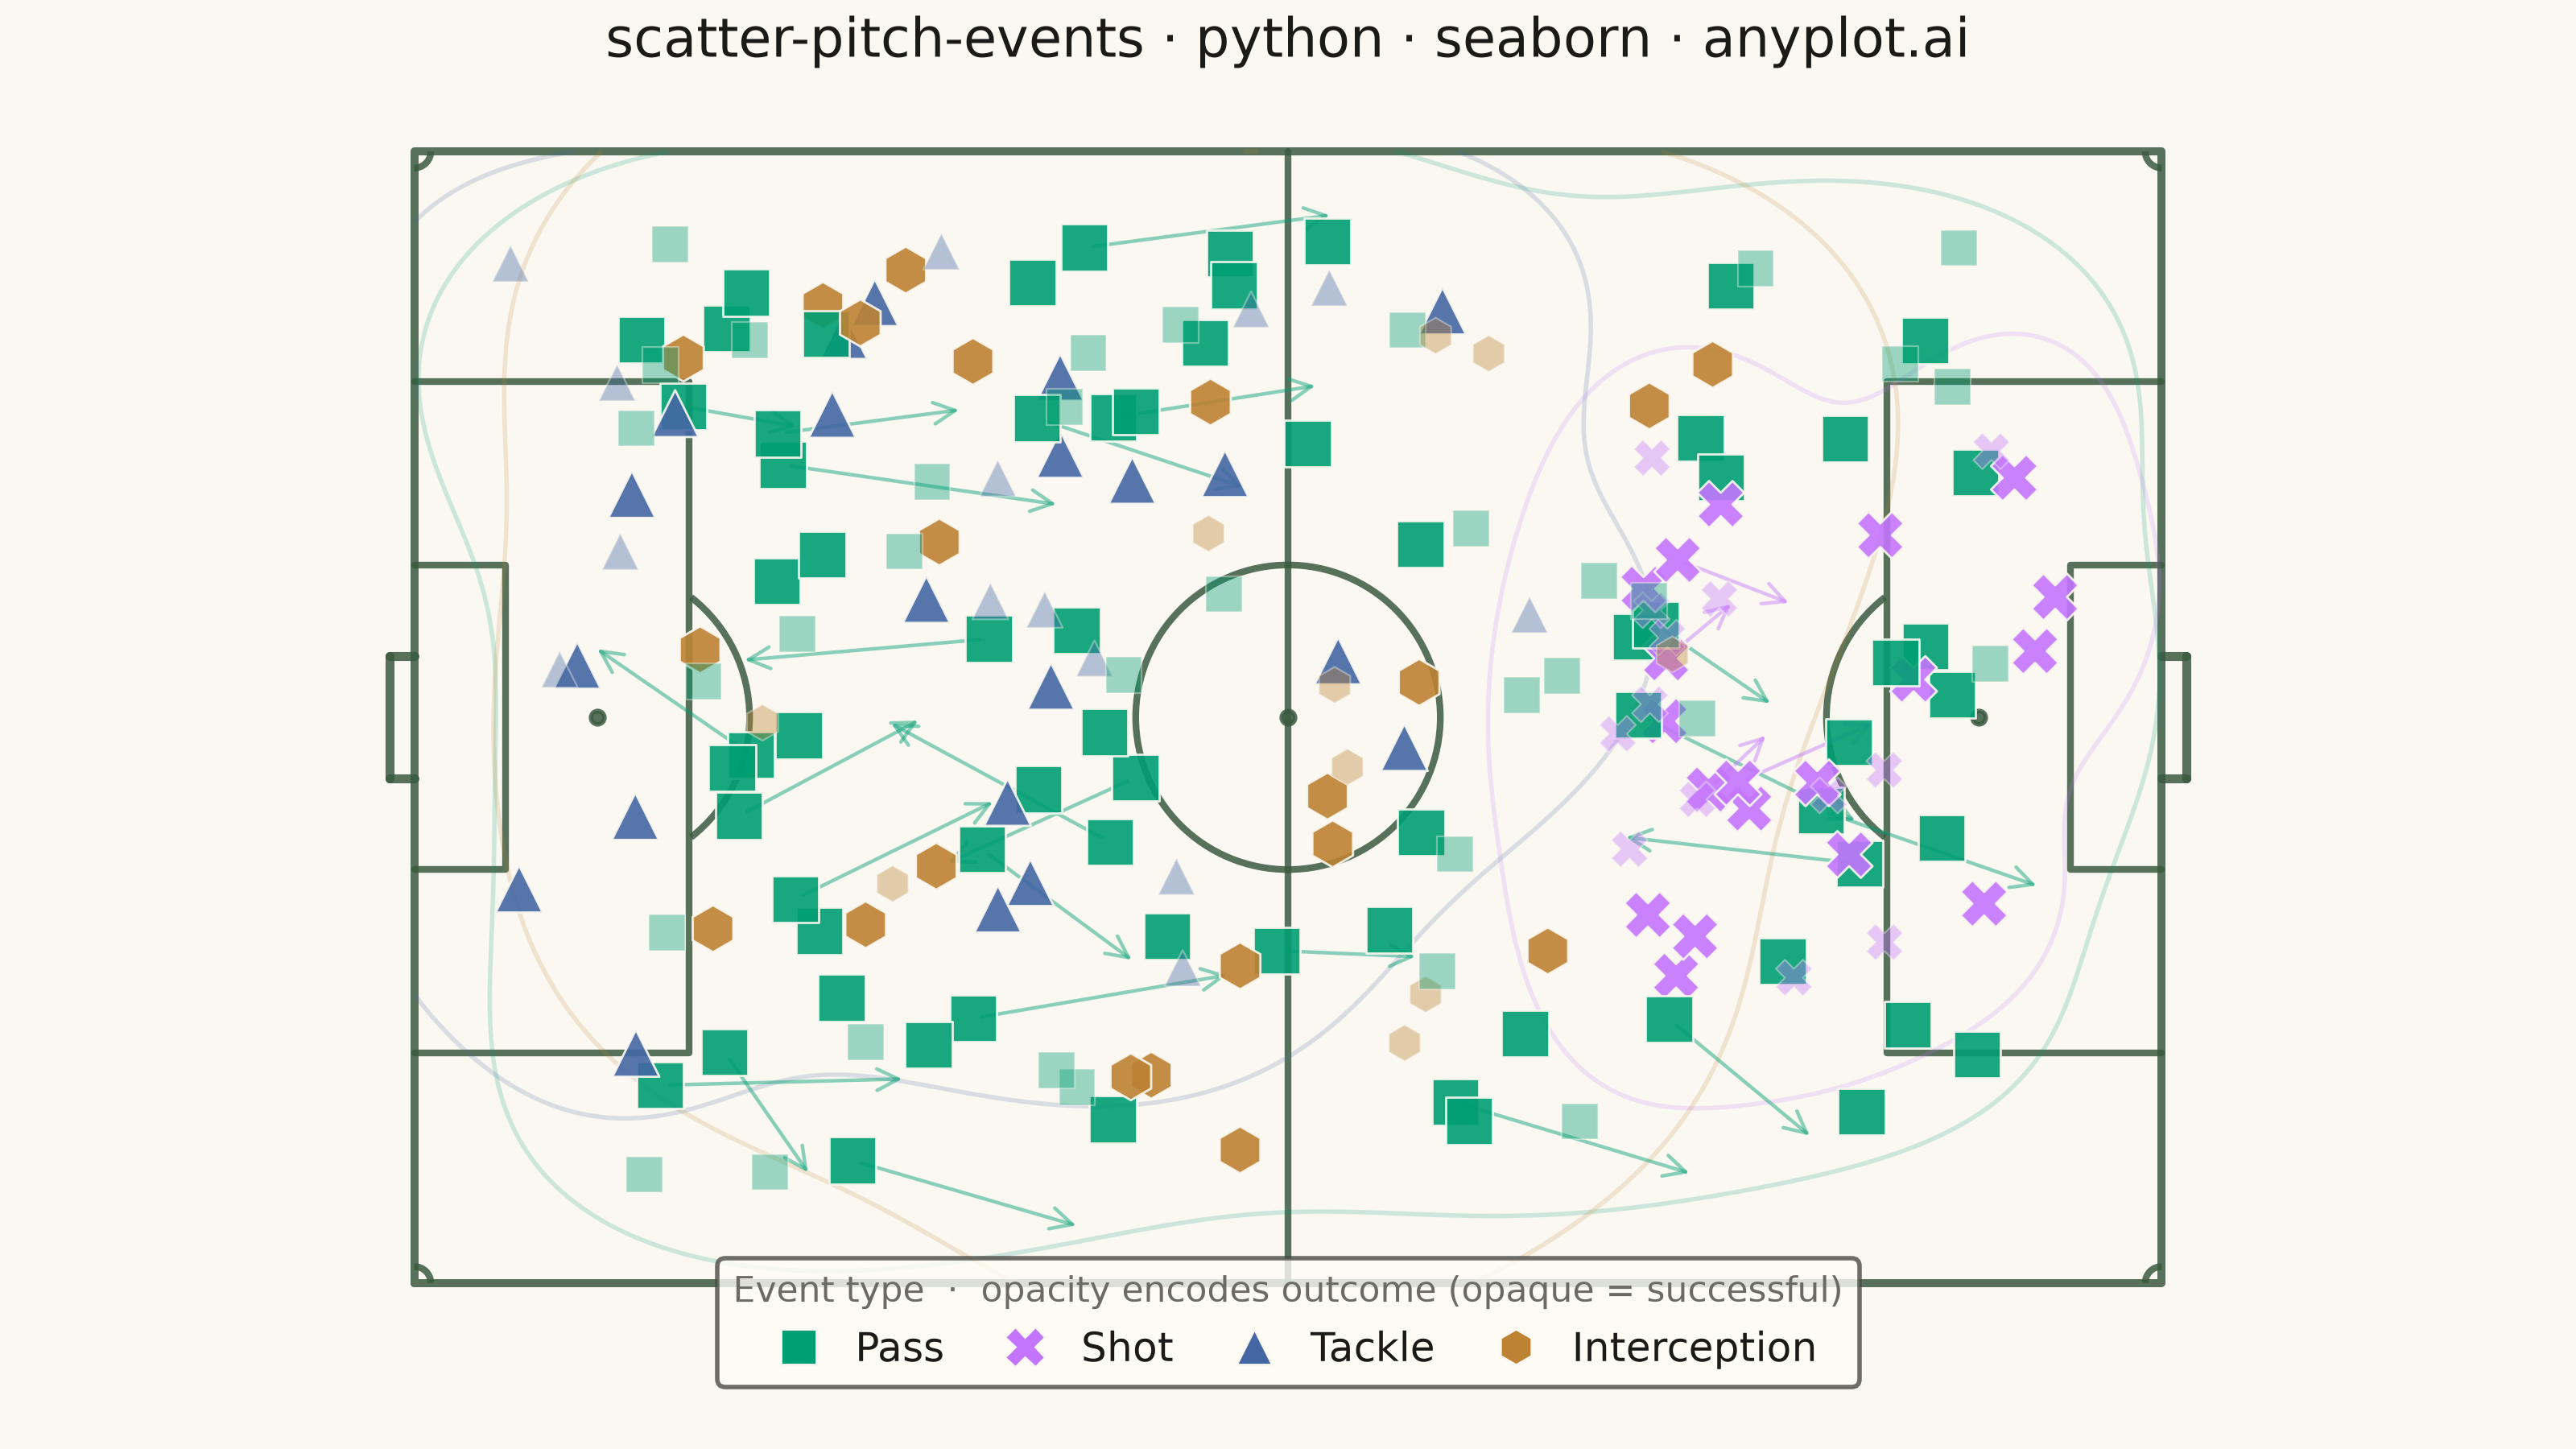
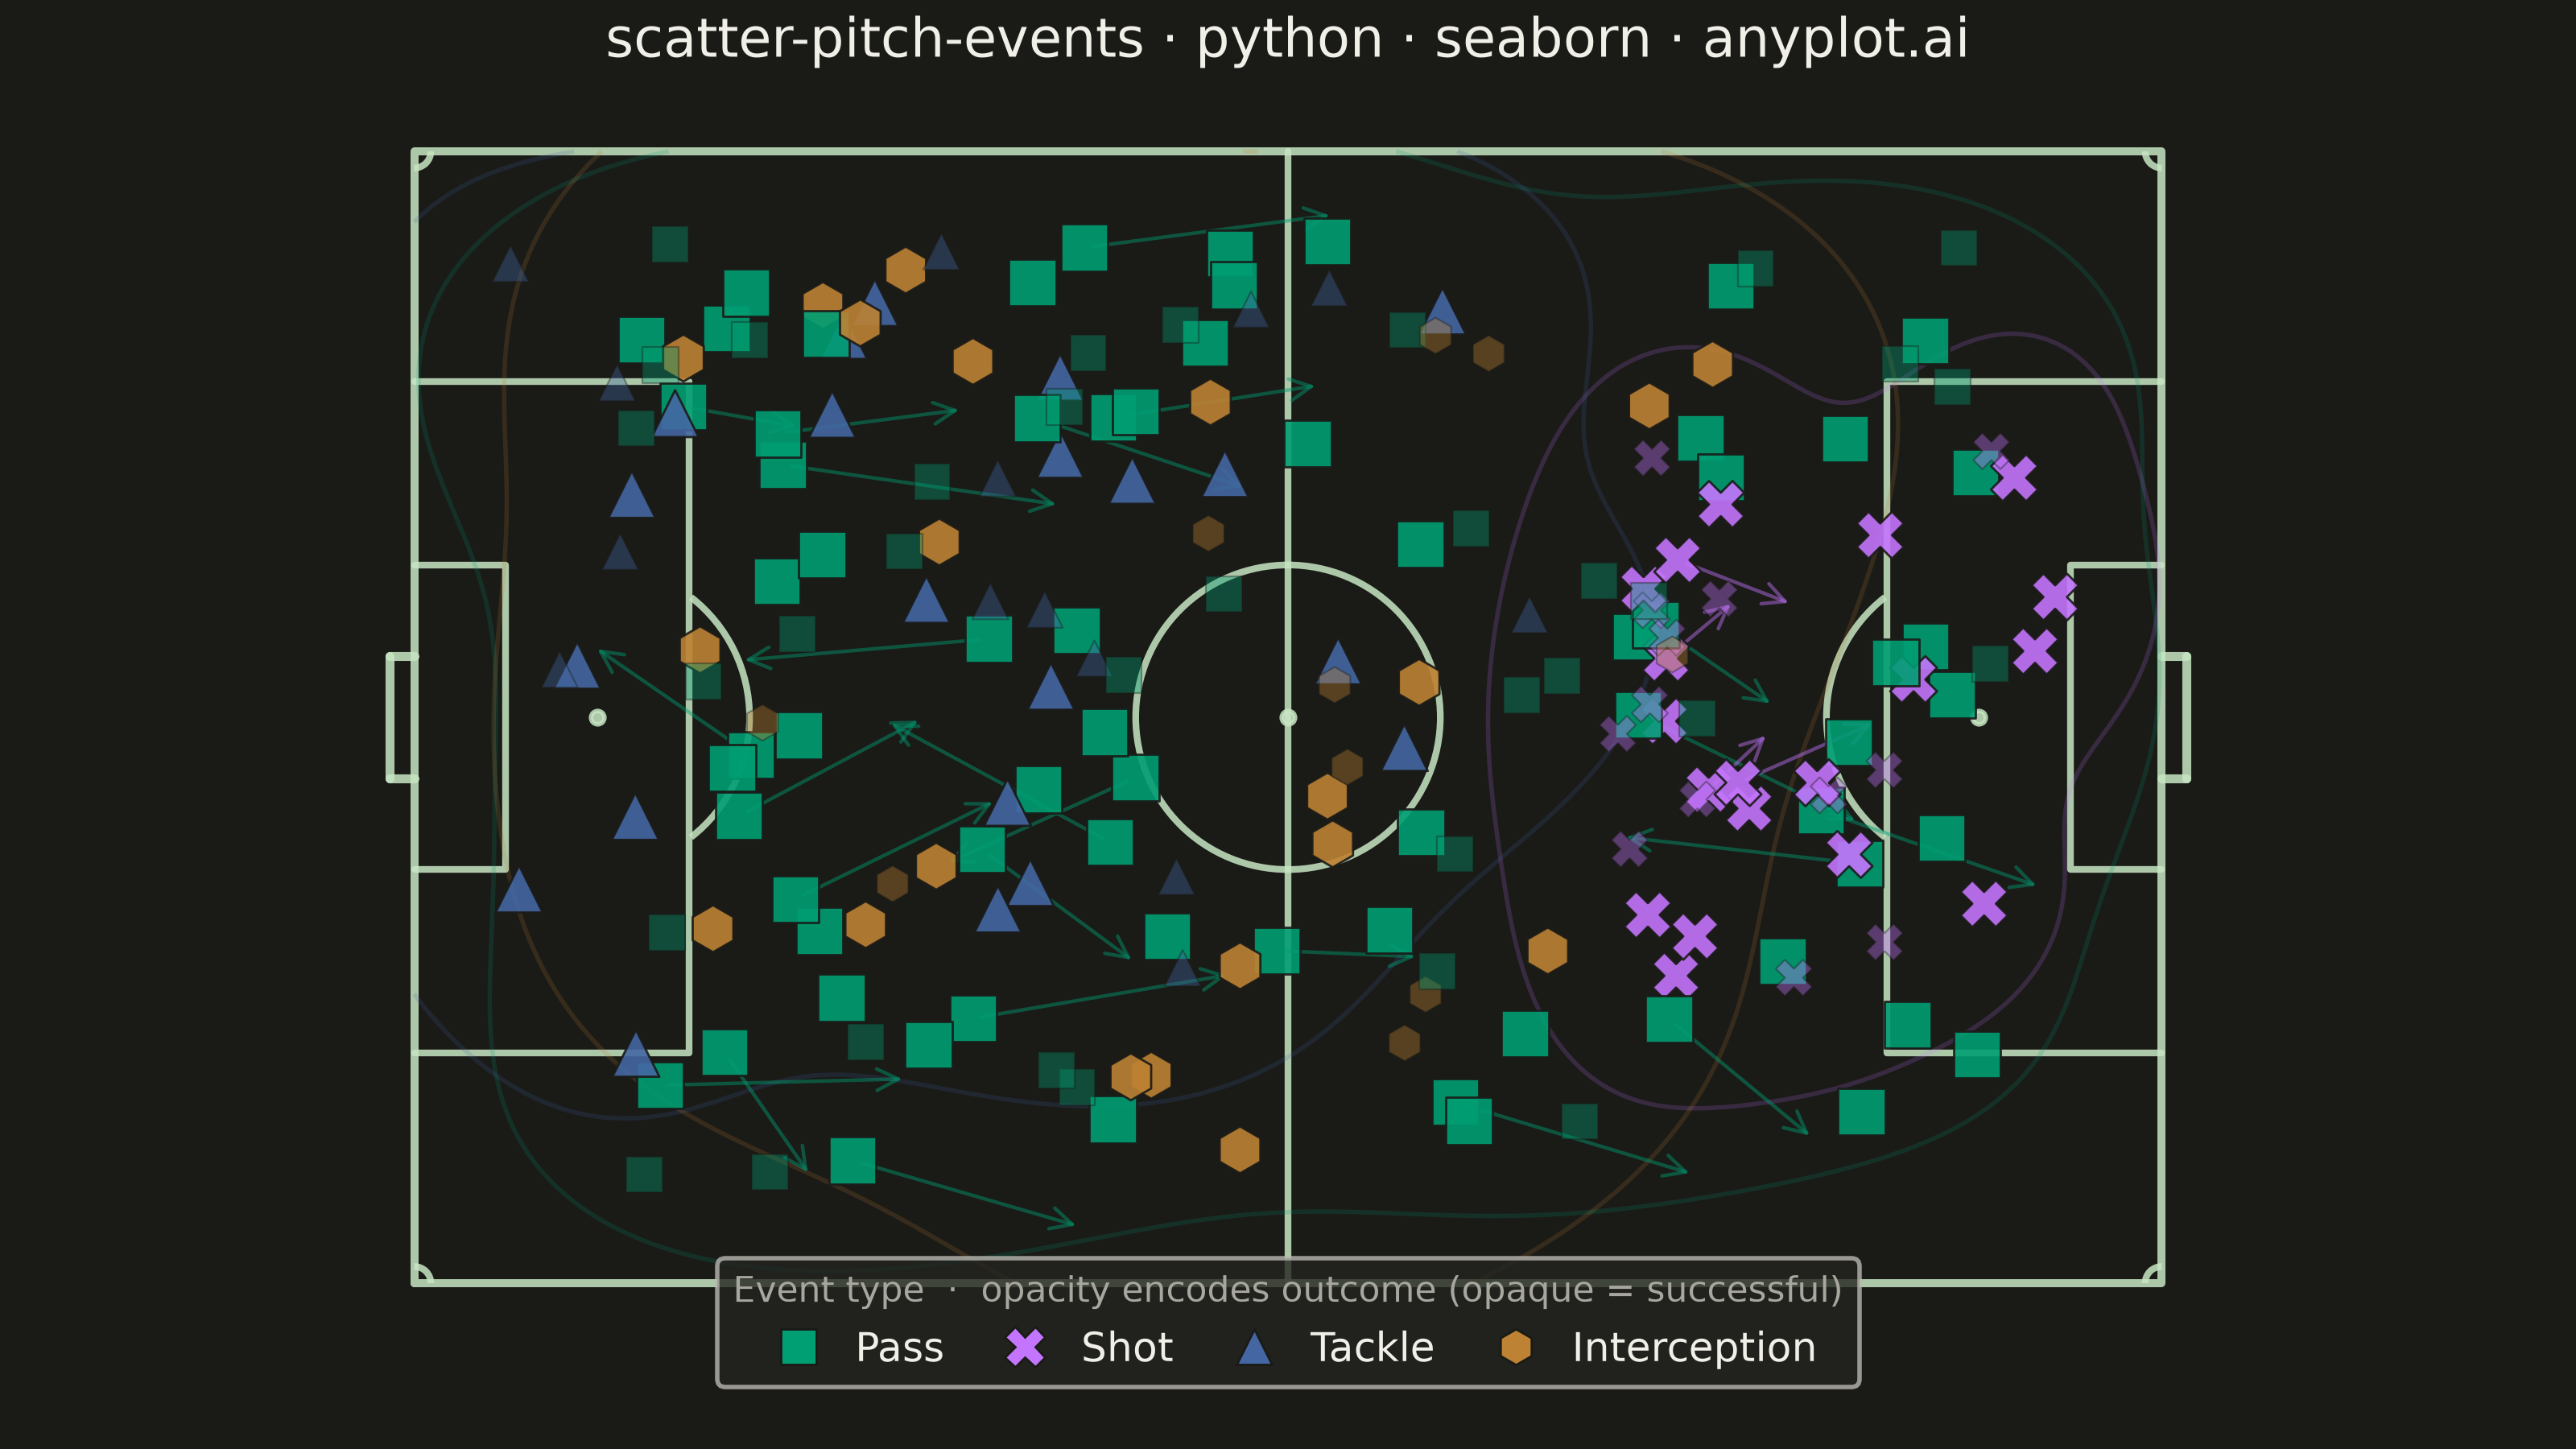
A soccer pitch event map positions match events (passes, shots, tackles, interceptions) as markers on an accurately scaled football pitch diagram. The pitch is drawn with standard markings including penalty areas, center circle, goal areas, and halfway line. Each event type uses distinct markers and colors, with directional arrows for passes and shots. This visualization is essential for tactical match analysis, scouting, and coaching in football analytics.
""" anyplot.ai
scatter-pitch-events: Soccer Pitch Event Map
Library: seaborn 0.13.2 | Python 3.13.14
Quality: 88/100 | Updated: 2026-06-21
"""

import os

import matplotlib.patches as patches
import matplotlib.pyplot as plt
import numpy as np
import pandas as pd
import seaborn as sns
from matplotlib.lines import Line2D


# Theme tokens
THEME = os.getenv("ANYPLOT_THEME", "light")
PAGE_BG = "#FAF8F1" if THEME == "light" else "#1A1A17"
ELEVATED_BG = "#FFFDF6" if THEME == "light" else "#242420"
INK = "#1A1A17" if THEME == "light" else "#F0EFE8"
INK_SOFT = "#4A4A44" if THEME == "light" else "#B8B7B0"
INK_MUTED = "#6B6A63" if THEME == "light" else "#A8A79F"

# Pitch surface and marking colors — theme-adaptive
PITCH_BG = "#EEF4E5" if THEME == "light" else "#1C3828"
PITCH_MARK = "#3A5A40" if THEME == "light" else "#C8E6C4"

# Imprint palette — positions 1-4 for four event categories
IMPRINT_PALETTE = [
    "#009E73",  # brand green
    "#C475FD",  # lavender
    "#4467A3",  # blue
    "#BD8233",  # ochre
]

# Data
np.random.seed(42)

n_events = 200
event_labels = ["Pass", "Shot", "Tackle", "Interception"]
event_types_arr = np.random.choice(event_labels, size=n_events, p=[0.50, 0.15, 0.20, 0.15])
outcomes = np.random.choice(["Successful", "Unsuccessful"], size=n_events, p=[0.65, 0.35])

x_coords = np.zeros(n_events)
y_coords = np.zeros(n_events)

for i, etype in enumerate(event_types_arr):
    if etype == "Pass":
        x_coords[i] = np.random.uniform(10, 95)
        y_coords[i] = np.random.uniform(5, 63)
    elif etype == "Shot":
        x_coords[i] = np.random.uniform(72, 100)
        y_coords[i] = np.random.uniform(18, 50)
    elif etype == "Tackle":
        x_coords[i] = np.random.uniform(5, 70)
        y_coords[i] = np.random.uniform(5, 63)
    else:
        x_coords[i] = np.random.uniform(15, 80)
        y_coords[i] = np.random.uniform(5, 63)

arrow_dx = np.zeros(n_events)
arrow_dy = np.zeros(n_events)
for i, etype in enumerate(event_types_arr):
    if etype == "Pass":
        arrow_dx[i] = np.random.uniform(5, 18) * np.random.choice([-1, 1], p=[0.2, 0.8])
        arrow_dy[i] = np.random.uniform(-8, 8)
    elif etype == "Shot":
        arrow_dx[i] = np.random.uniform(3, 9)
        arrow_dy[i] = np.random.uniform(-4, 4)

df = pd.DataFrame(
    {"x": x_coords, "y": y_coords, "Event Type": event_types_arr, "Outcome": outcomes, "dx": arrow_dx, "dy": arrow_dy}
)

# Imprint palette mapped to event types
palette = {
    "Pass": IMPRINT_PALETTE[0],
    "Shot": IMPRINT_PALETTE[1],
    "Tackle": IMPRINT_PALETTE[2],
    "Interception": IMPRINT_PALETTE[3],
}

# Marker shapes diverged from sibling implementations:
# squares for passes, X-marks for shots, hexagons for interceptions
marker_map = {"Pass": "s", "Shot": "X", "Tackle": "^", "Interception": "h"}

# Plot — canvas: 8×4.5 in @ 400 dpi → 3200×1800 px
sns.set_theme(
    style="white",
    rc={
        "figure.facecolor": PAGE_BG,
        "axes.facecolor": PITCH_BG,
        "text.color": INK,
        "legend.facecolor": ELEVATED_BG,
        "legend.edgecolor": INK_SOFT,
    },
)

fig, ax = plt.subplots(figsize=(8, 4.5), dpi=400)
fig.set_facecolor(PAGE_BG)
ax.set_facecolor(PITCH_BG)

# Pitch markings
lw = 1.5
alp = 0.85

ax.plot([0, 105, 105, 0, 0], [0, 0, 68, 68, 0], color=PITCH_MARK, lw=lw + 0.3, alpha=alp)
ax.plot([52.5, 52.5], [0, 68], color=PITCH_MARK, lw=lw, alpha=alp)
ax.add_patch(patches.Circle((52.5, 34), 9.15, fill=False, edgecolor=PITCH_MARK, lw=lw, alpha=alp))
ax.plot(52.5, 34, "o", color=PITCH_MARK, markersize=3, alpha=alp)

# Penalty and goal areas
ax.plot([0, 16.5, 16.5, 0], [13.84, 13.84, 54.16, 54.16], color=PITCH_MARK, lw=lw, alpha=alp)
ax.plot([105, 88.5, 88.5, 105], [13.84, 13.84, 54.16, 54.16], color=PITCH_MARK, lw=lw, alpha=alp)
ax.plot([0, 5.5, 5.5, 0], [24.84, 24.84, 43.16, 43.16], color=PITCH_MARK, lw=lw, alpha=alp)
ax.plot([105, 99.5, 99.5, 105], [24.84, 24.84, 43.16, 43.16], color=PITCH_MARK, lw=lw, alpha=alp)

# Penalty spots
ax.plot(11, 34, "o", color=PITCH_MARK, markersize=3, alpha=alp)
ax.plot(94, 34, "o", color=PITCH_MARK, markersize=3, alpha=alp)

# Penalty arcs
ax.add_patch(patches.Arc((11, 34), 18.3, 18.3, angle=0, theta1=308, theta2=52, edgecolor=PITCH_MARK, lw=lw, alpha=alp))
ax.add_patch(patches.Arc((94, 34), 18.3, 18.3, angle=0, theta1=128, theta2=232, edgecolor=PITCH_MARK, lw=lw, alpha=alp))

# Corner arcs
for cx, cy, t1, t2 in [(0, 0, 0, 90), (105, 0, 90, 180), (105, 68, 180, 270), (0, 68, 270, 360)]:
    ax.add_patch(patches.Arc((cx, cy), 2, 2, angle=0, theta1=t1, theta2=t2, edgecolor=PITCH_MARK, lw=lw, alpha=alp))

# Goal posts
for x0, x1 in [(0, -1.5), (105, 106.5)]:
    ax.plot([x0, x1], [30.34, 30.34], color=PITCH_MARK, lw=lw + 0.5, alpha=alp)
    ax.plot([x0, x1], [37.66, 37.66], color=PITCH_MARK, lw=lw + 0.5, alpha=alp)
    ax.plot([x1, x1], [30.34, 37.66], color=PITCH_MARK, lw=lw + 0.5, alpha=alp)

# KDE density contours — 2 levels to limit visual clutter
for etype, color in palette.items():
    subset = df[df["Event Type"] == etype]
    if len(subset) > 5:
        sns.kdeplot(
            data=subset,
            x="x",
            y="y",
            color=color,
            levels=2,
            alpha=0.18,
            linewidths=1.0,
            ax=ax,
            zorder=3,
            warn_singular=False,
            clip=((0, 105), (0, 68)),
        )

# Scatter: successful events (opaque, larger)
df_success = df[df["Outcome"] == "Successful"]
df_unsuccess = df[df["Outcome"] == "Unsuccessful"]

sns.scatterplot(
    data=df_success,
    x="x",
    y="y",
    hue="Event Type",
    style="Event Type",
    hue_order=event_labels,
    style_order=event_labels,
    markers=marker_map,
    palette=palette,
    s=110,
    alpha=0.90,
    edgecolor=PAGE_BG,
    linewidth=0.5,
    legend=False,
    ax=ax,
    zorder=5,
)

# Scatter: unsuccessful events (faded, smaller)
sns.scatterplot(
    data=df_unsuccess,
    x="x",
    y="y",
    hue="Event Type",
    style="Event Type",
    hue_order=event_labels,
    style_order=event_labels,
    markers=marker_map,
    palette=palette,
    s=65,
    alpha=0.38,
    edgecolor=PAGE_BG,
    linewidth=0.4,
    legend=False,
    ax=ax,
    zorder=5,
)

# Directional arrows — sparse sample; reduced density near crowded shot zone (x > 75)
df_arr = df_success[df_success["Event Type"].isin(["Pass", "Shot"])]
df_arr_sparse = pd.concat(
    [
        df_arr[df_arr["x"] <= 75].sample(frac=0.40, random_state=42),
        df_arr[df_arr["x"] > 75].sample(frac=0.20, random_state=42),
    ]
)
for _, row in df_arr_sparse.iterrows():
    ax.annotate(
        "",
        xy=(row["x"] + row["dx"], row["y"] + row["dy"]),
        xytext=(row["x"], row["y"]),
        arrowprops={"arrowstyle": "->", "color": palette[row["Event Type"]], "lw": 0.8, "alpha": 0.45},
        zorder=4,
    )

# Style
ax.set_xlim(-4, 109)
ax.set_ylim(-3, 71)
ax.set_aspect("equal")
ax.axis("off")

title = "scatter-pitch-events · python · seaborn · anyplot.ai"
ax.set_title(title, fontsize=12, fontweight="medium", color=INK, pad=10)

# Legend — 4 entries (event types only); title explains opacity encoding
legend_elements = [
    Line2D(
        [0],
        [0],
        marker=marker_map[etype],
        color="none",
        markerfacecolor=palette[etype],
        markeredgecolor=PAGE_BG,
        markersize=9 if etype == "Shot" else 8,
        markeredgewidth=0.5,
        label=etype,
    )
    for etype in event_labels
]
legend = ax.legend(
    handles=legend_elements,
    loc="lower center",
    bbox_to_anchor=(0.5, -0.06),
    ncol=4,
    fontsize=9,
    frameon=True,
    facecolor=ELEVATED_BG,
    edgecolor=INK_SOFT,
    labelcolor=INK,
    handletextpad=0.4,
    columnspacing=1.0,
    title="Event type  ·  opacity encodes outcome (opaque = successful)",
    title_fontsize=8,
)
legend.get_title().set_color(INK_MUTED)

fig.subplots_adjust(left=0.01, right=0.99, top=0.93, bottom=0.08)

# Save — bbox_inches must stay default (None) to preserve 3200×1800 canvas
plt.savefig(f"plot-{THEME}.png", dpi=400, facecolor=PAGE_BG)
plt.close()
Runnable source as JSON, for any HTTP client: https://api.anyplot.ai/specs/scatter-pitch-events/seaborn/code. Any spec id and library id listed in llms-full.txt fit the same URL shape; every URL below is complete and callable.
{
  "spec_id": "scatter-pitch-events",
  "language": "python",
  "library": "seaborn",
  "page": "https://anyplot.ai/scatter-pitch-events/python/seaborn",
  "hub": "https://anyplot.ai/scatter-pitch-events",
  "code_json": "https://api.anyplot.ai/specs/scatter-pitch-events/seaborn/code",
  "spec_json": "https://api.anyplot.ai/specs/scatter-pitch-events",
  "render_light_png": "https://storage.googleapis.com/anyplot-images/plots/scatter-pitch-events/python/seaborn/plot-light.png",
  "render_dark_png": "https://storage.googleapis.com/anyplot-images/plots/scatter-pitch-events/python/seaborn/plot-dark.png",
  "quality_score": 88.0,
  "license": "MIT",
  "guide": "https://anyplot.ai/llms.txt"
}
Part of Soccer Pitch Event Map on anyplot.ai.