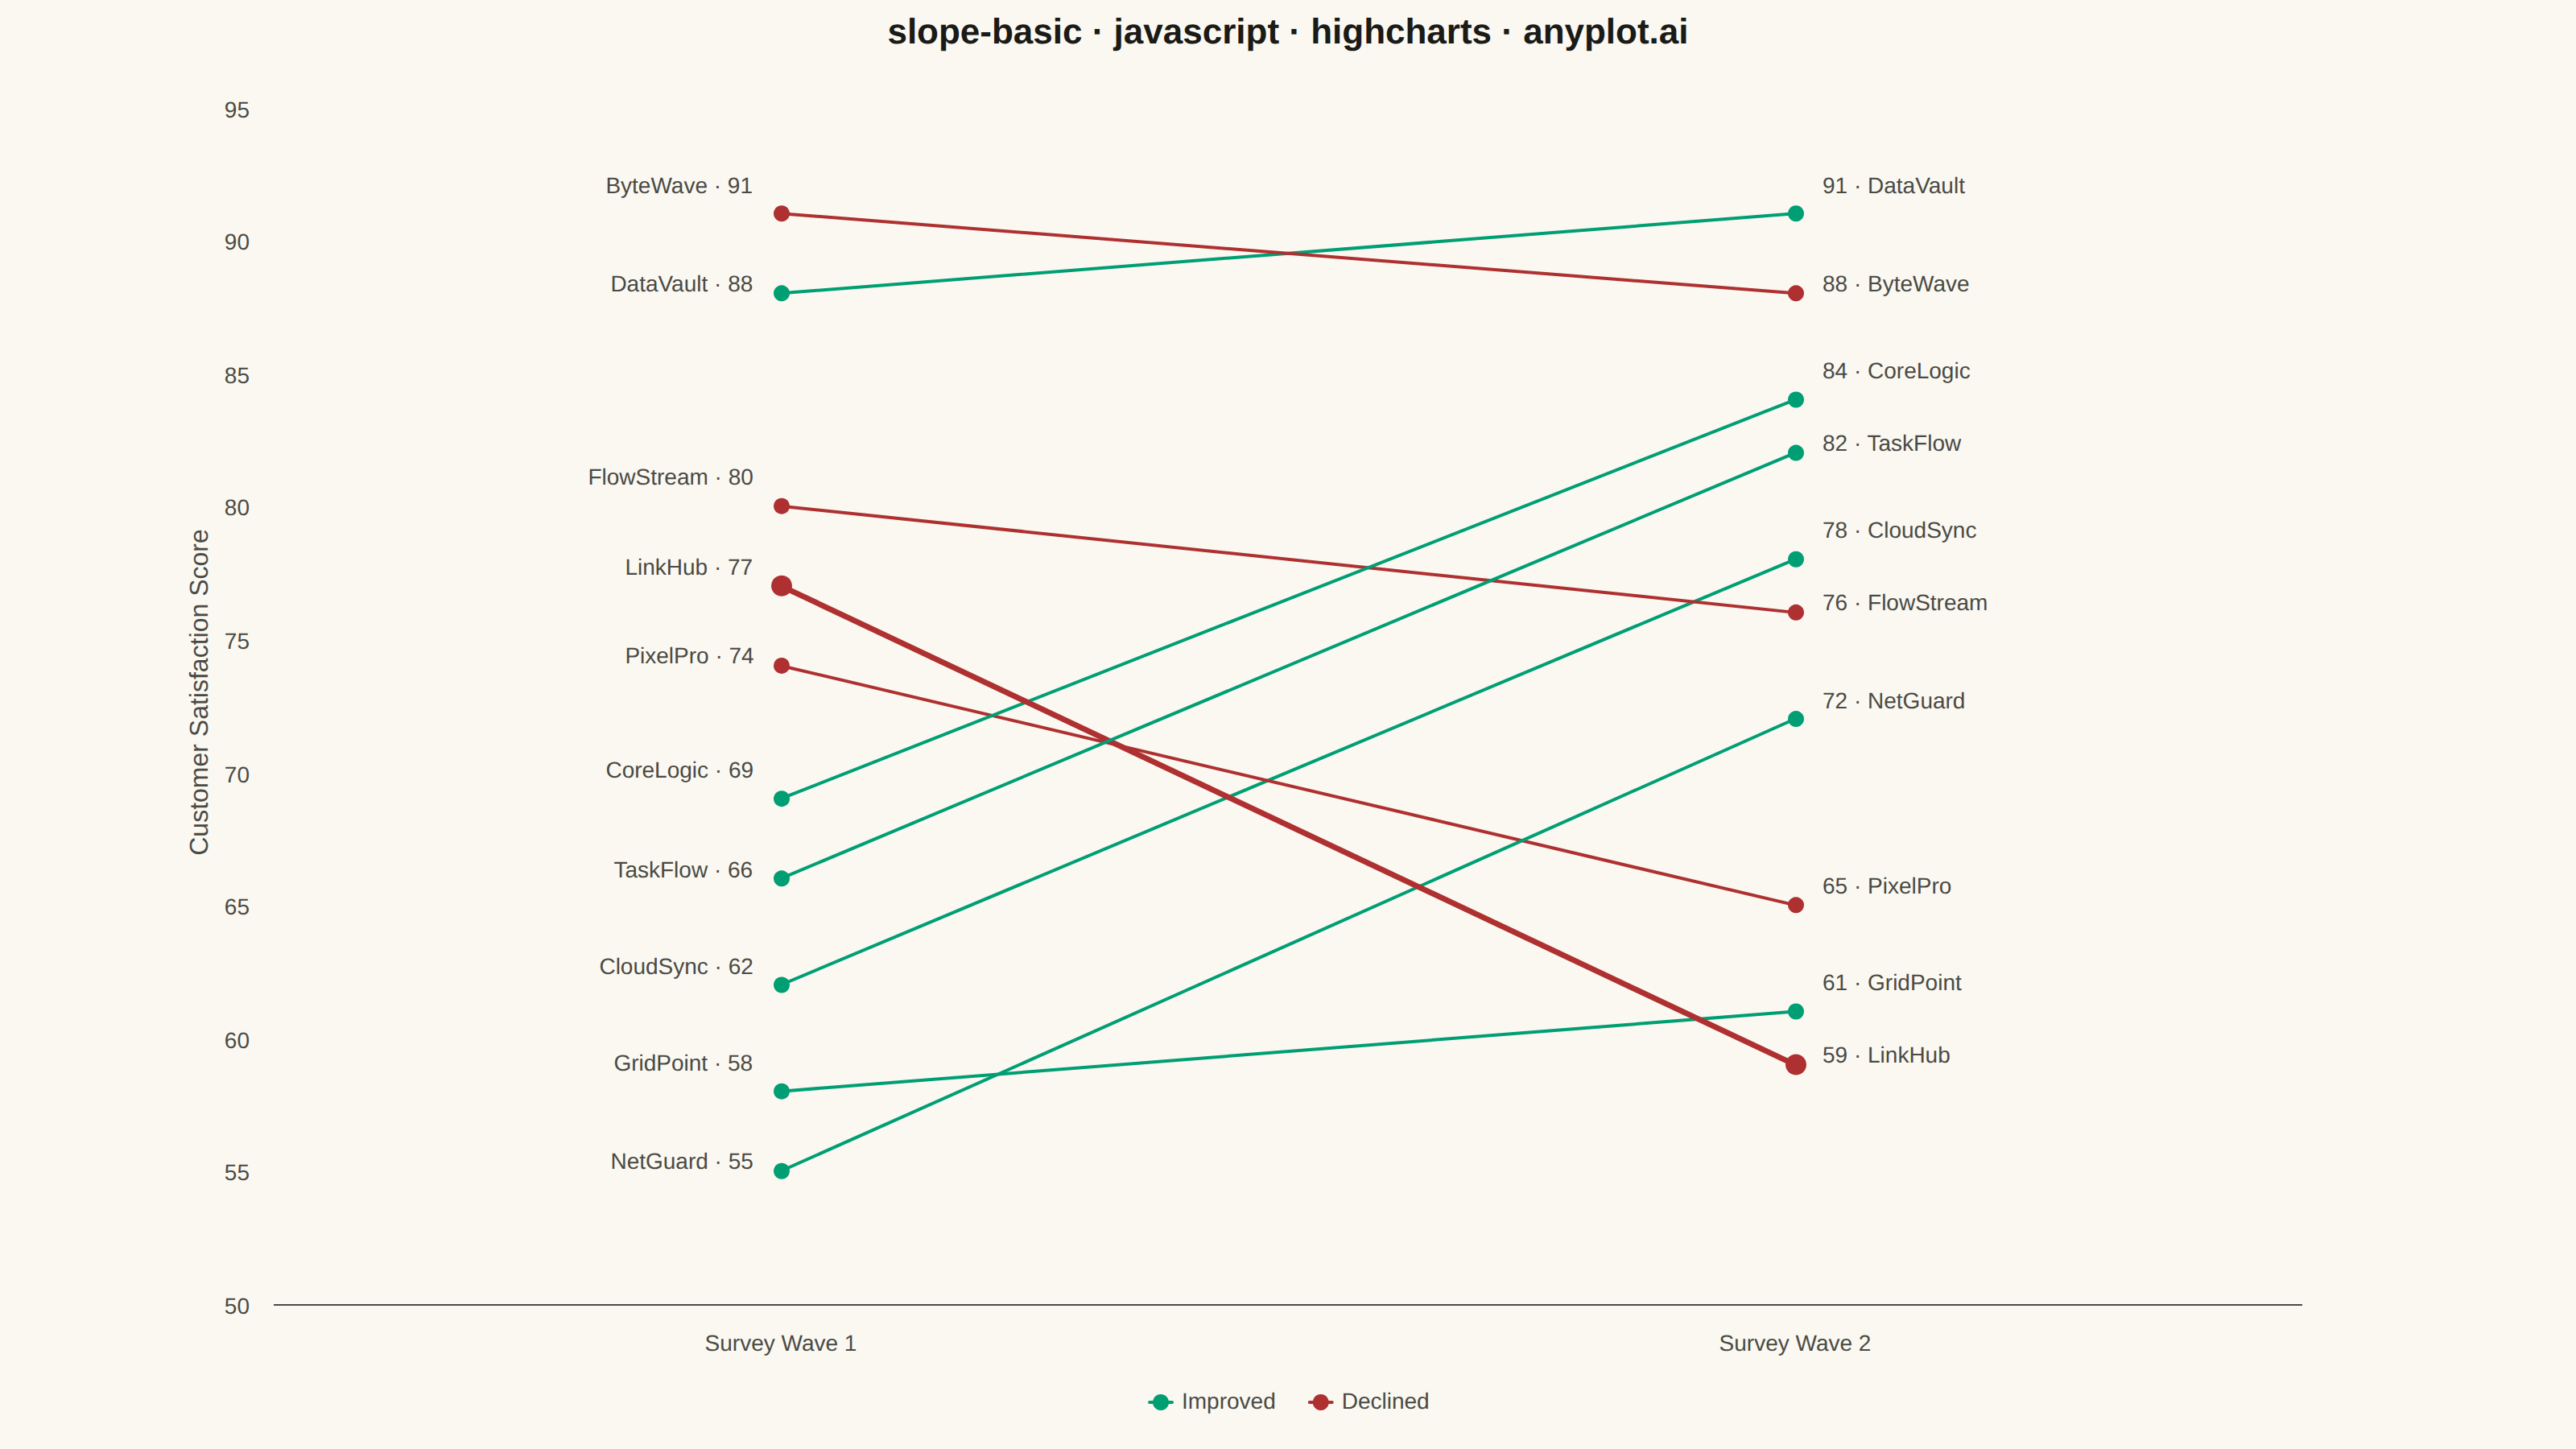
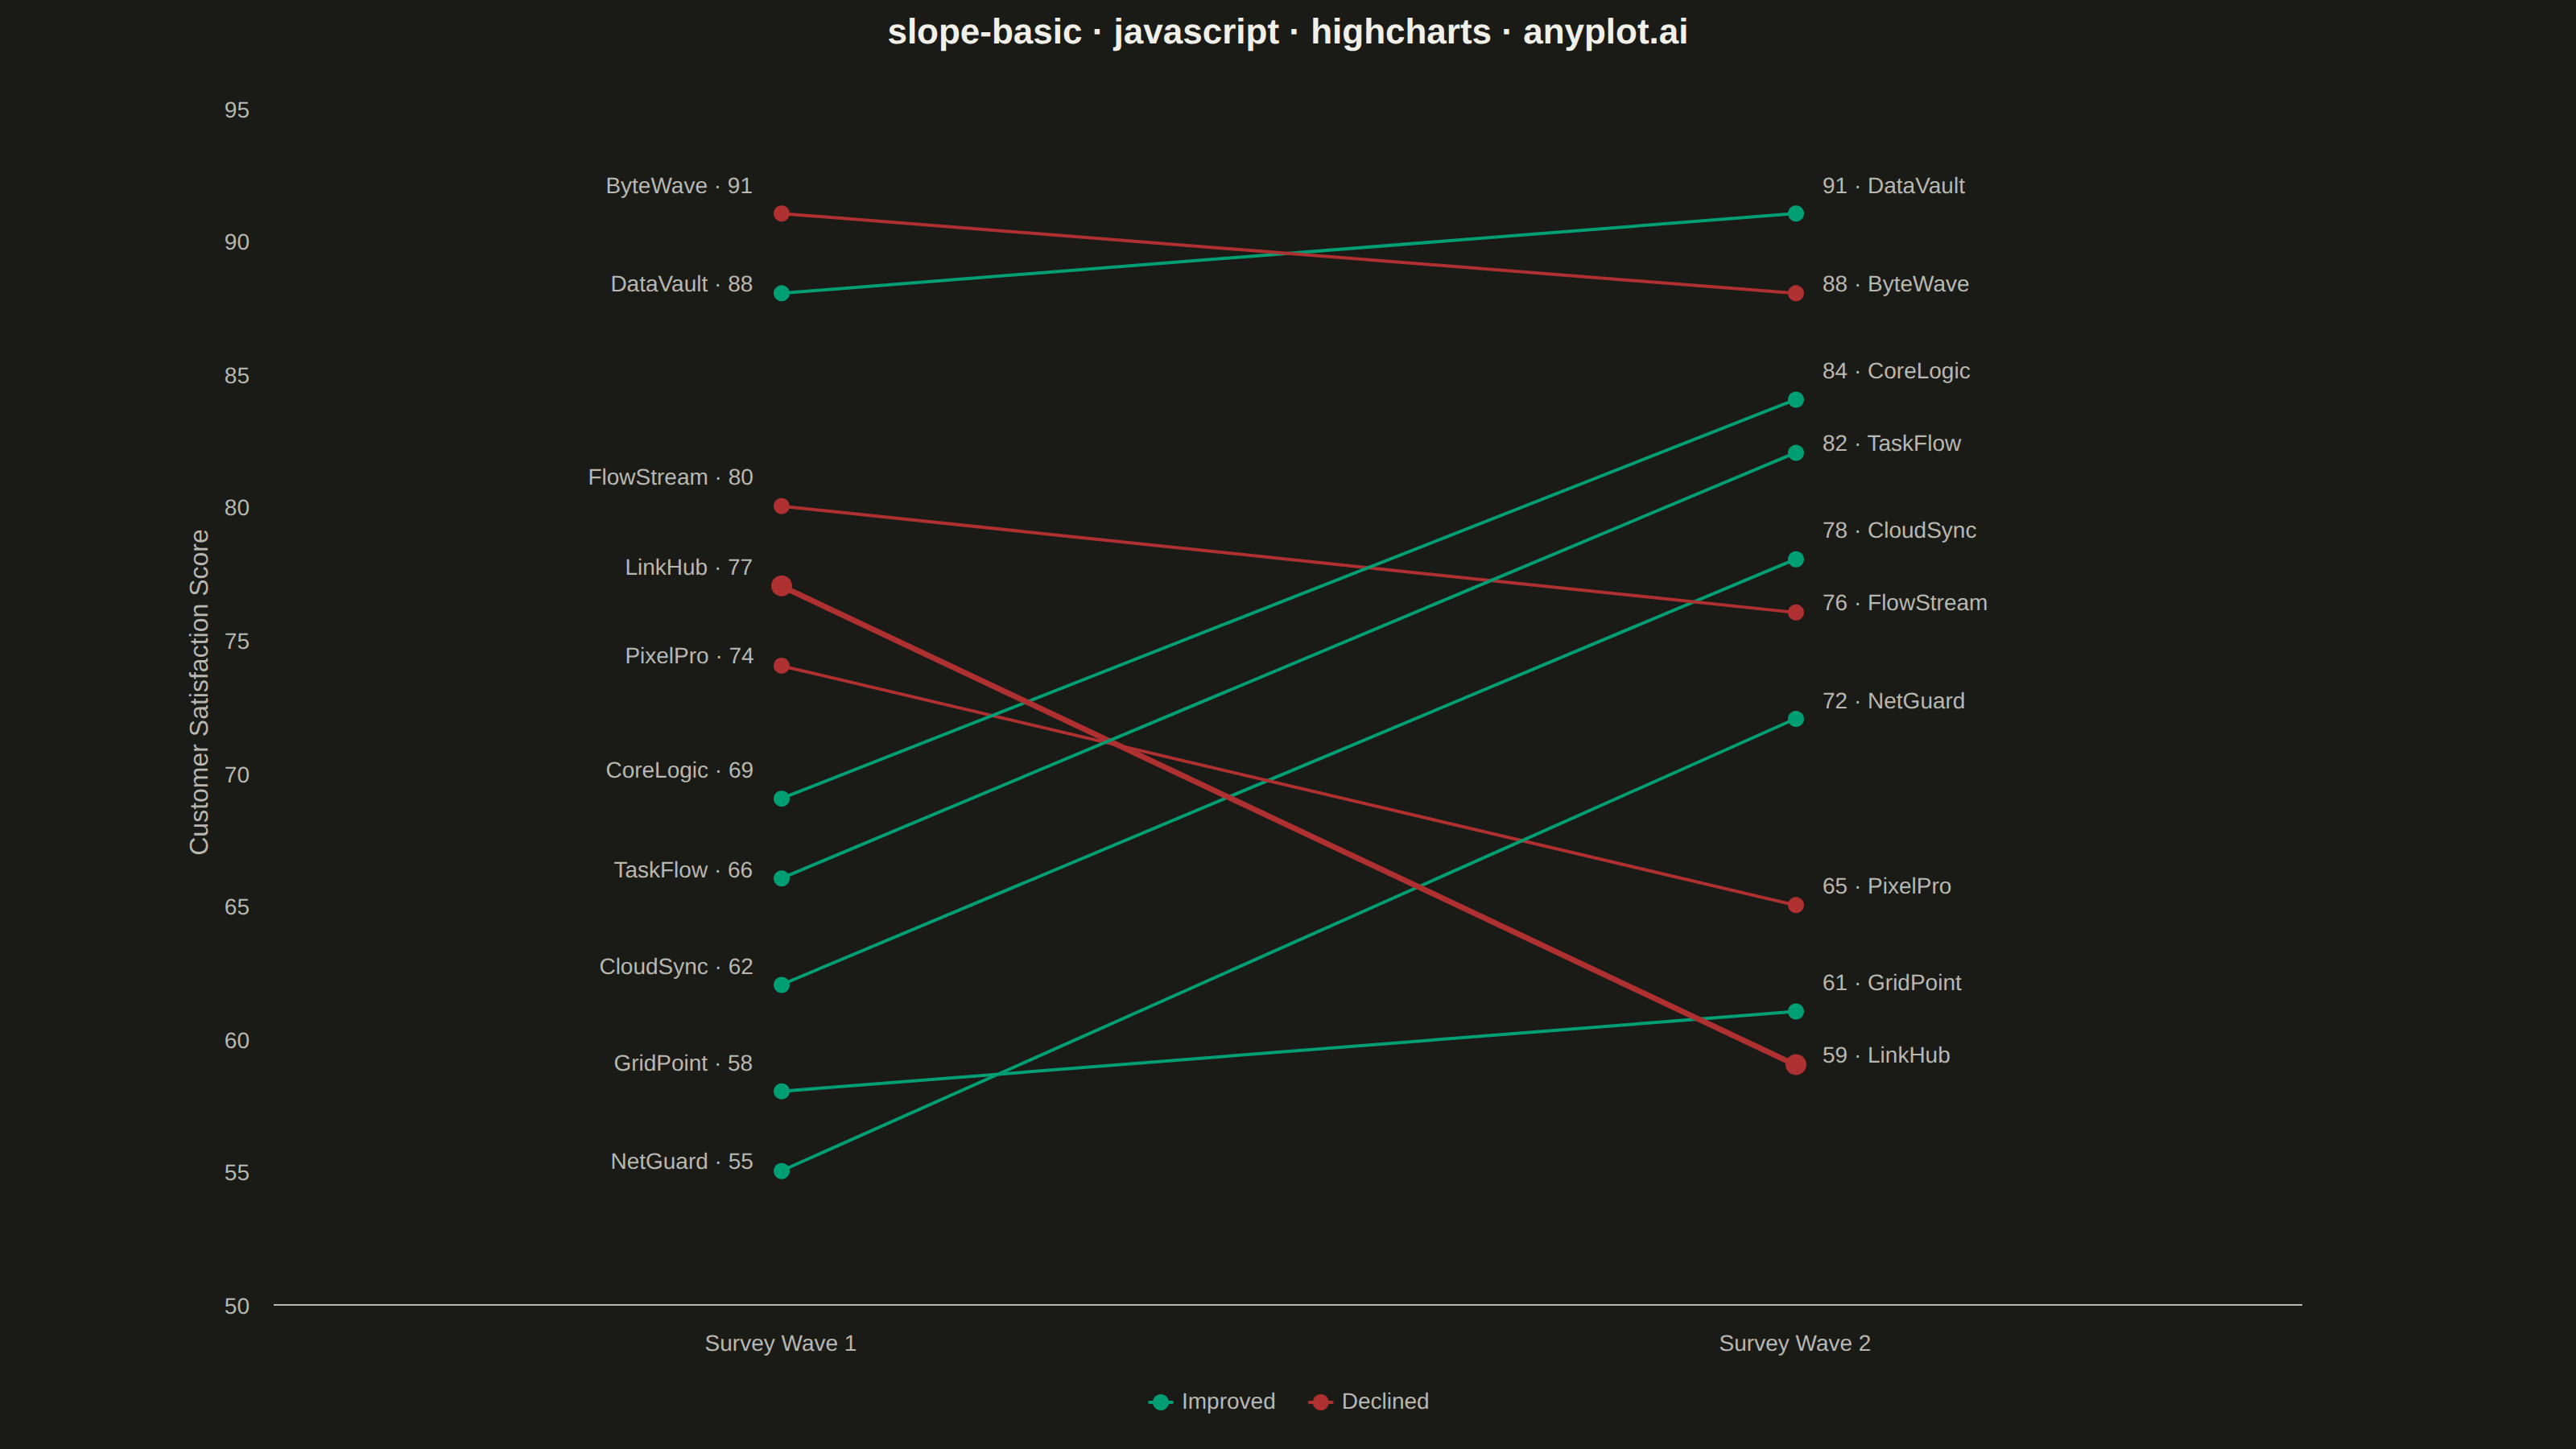
A slope chart (slopegraph) visualizes changes between two or more time points by connecting values with lines across vertical axes. It emphasizes the direction and magnitude of change rather than absolute values, making it ideal for spotting increases, decreases, and rank changes at a glance. This chart type excels at before/after comparisons and highlighting which items improved or declined.
Preview render from the Highcharts implementation.