The same plot in 14 other libraries — JavaScript: Chart.js, Apache ECharts, Highcharts, MUI X Charts; Python: Altair, Bokeh, lets-plot, Matplotlib, Plotly, plotnine, Pygal, Seaborn; R: ggplot2; Julia: Makie.jl. Compare all 15 side by side: Basic Slope Chart (Slopegraph) in Python, R, Julia and JavaScript.
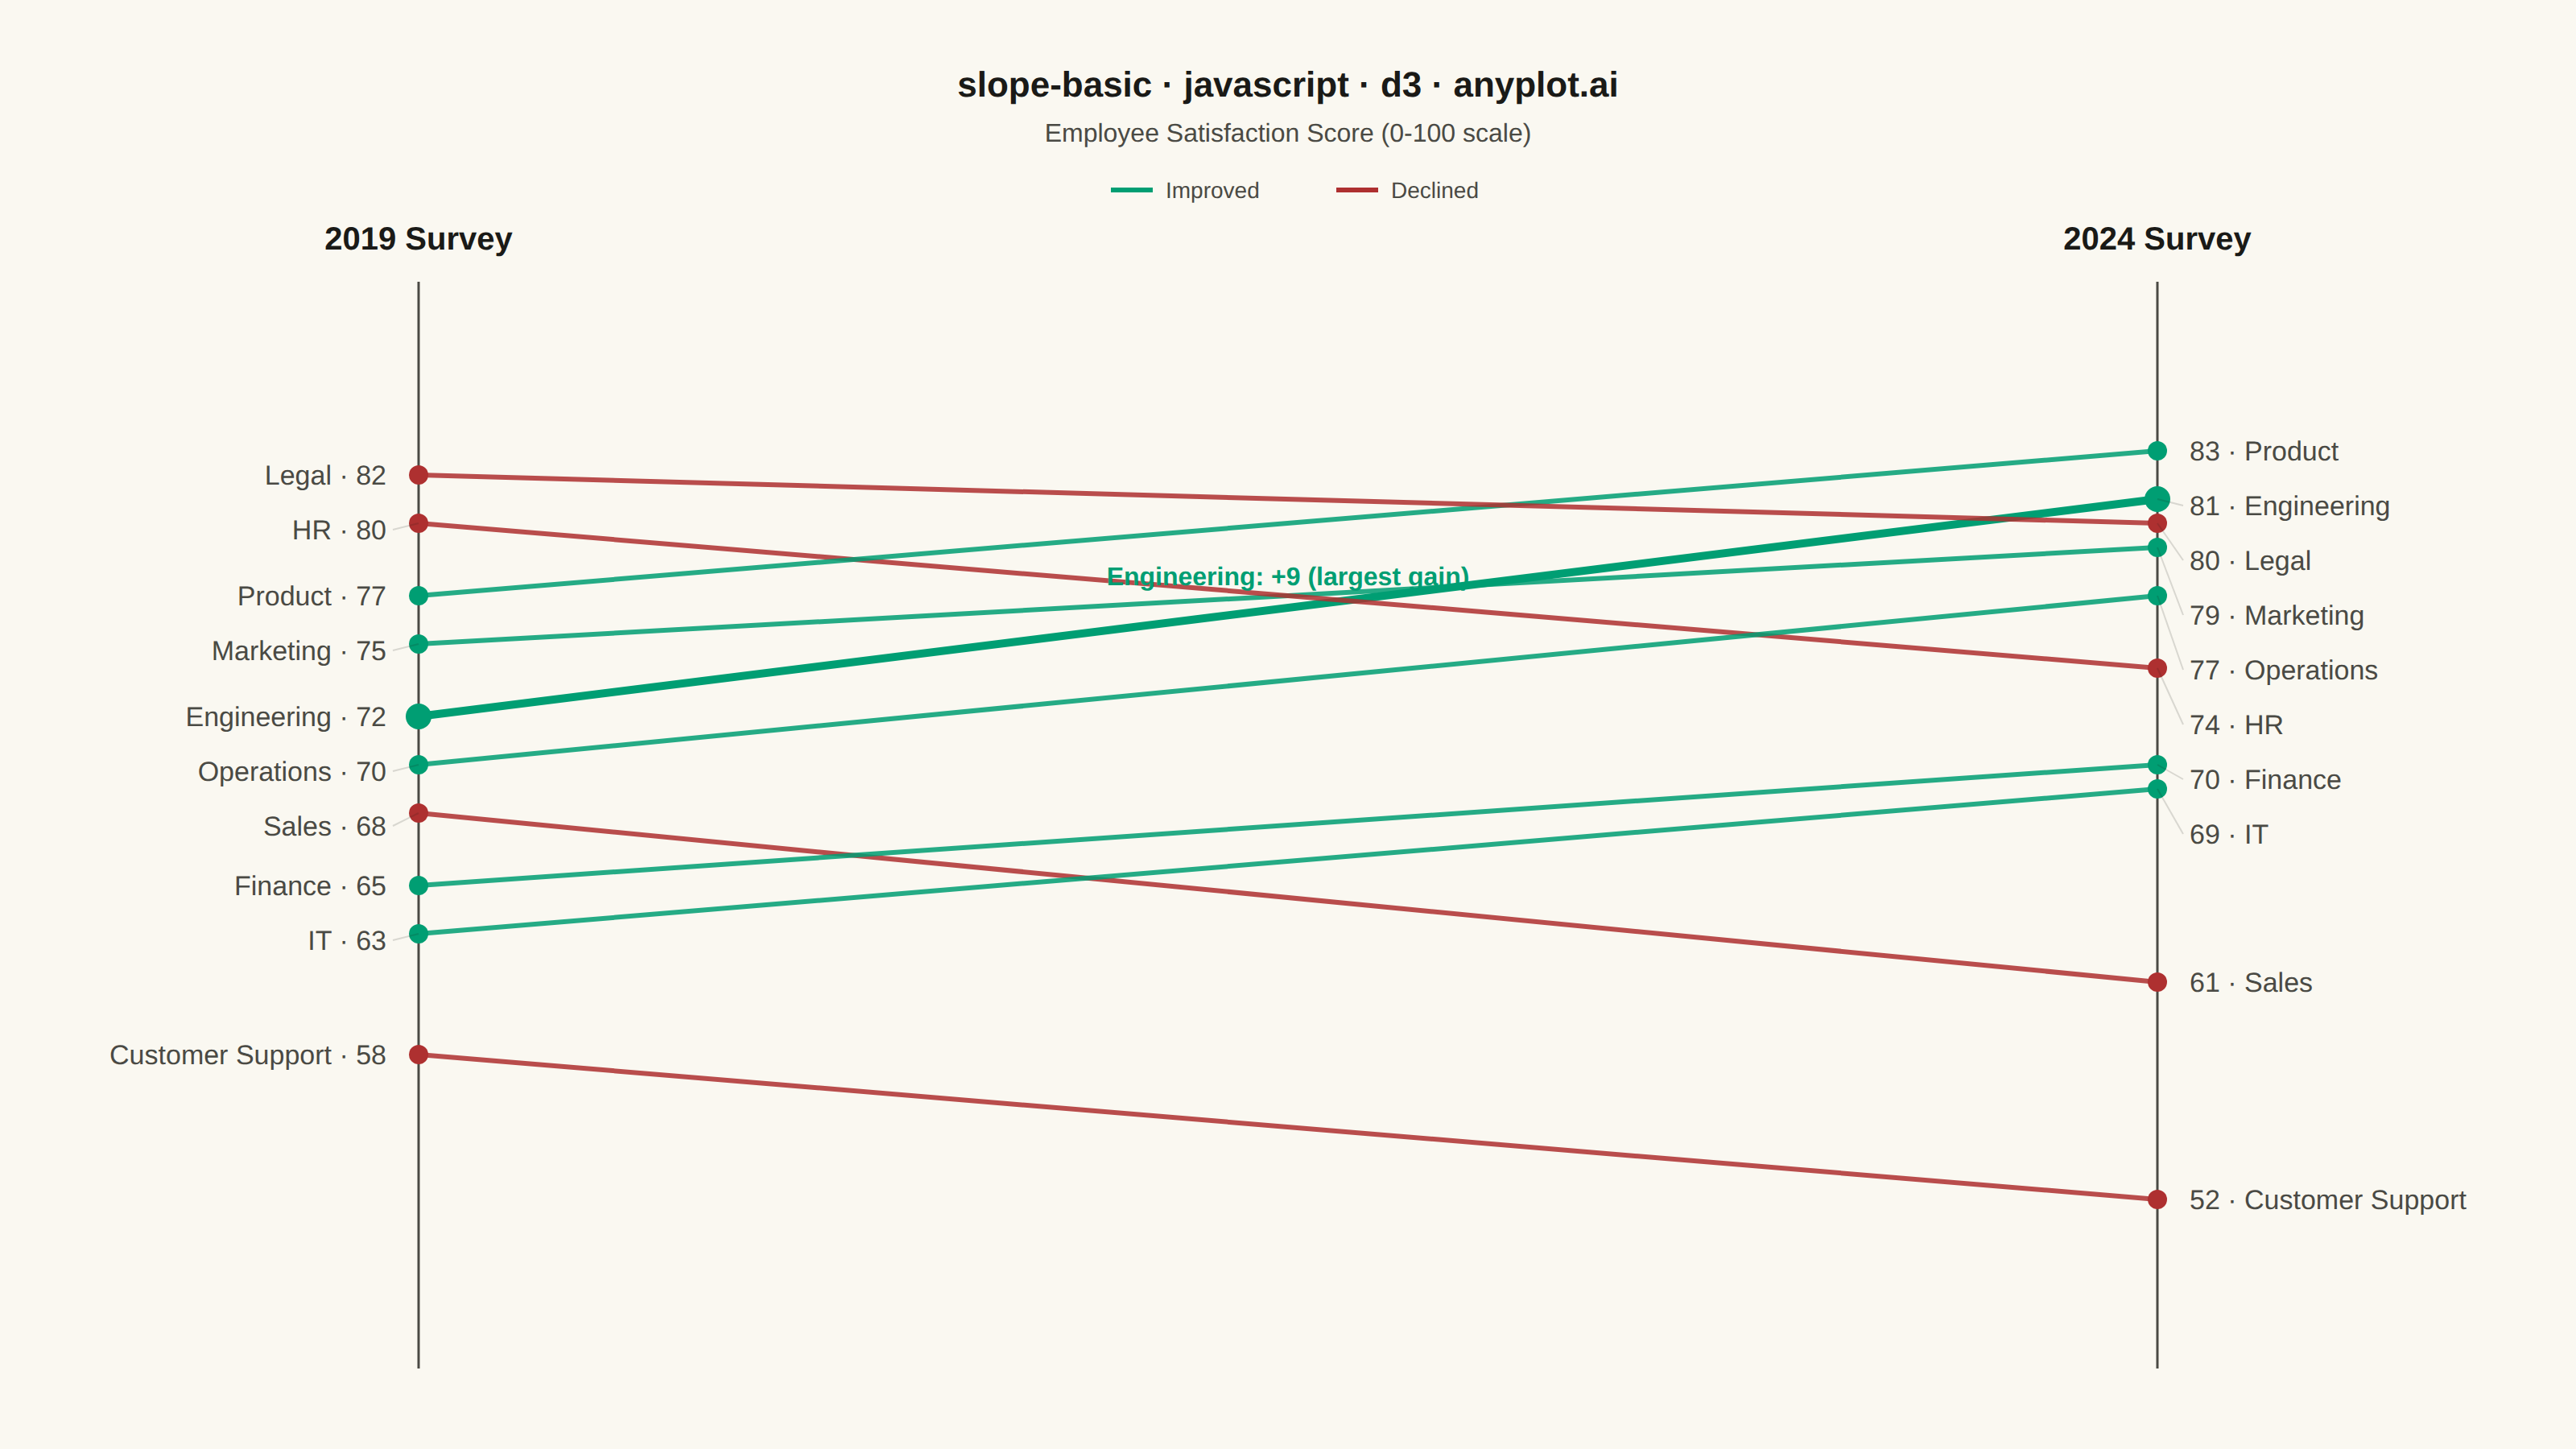
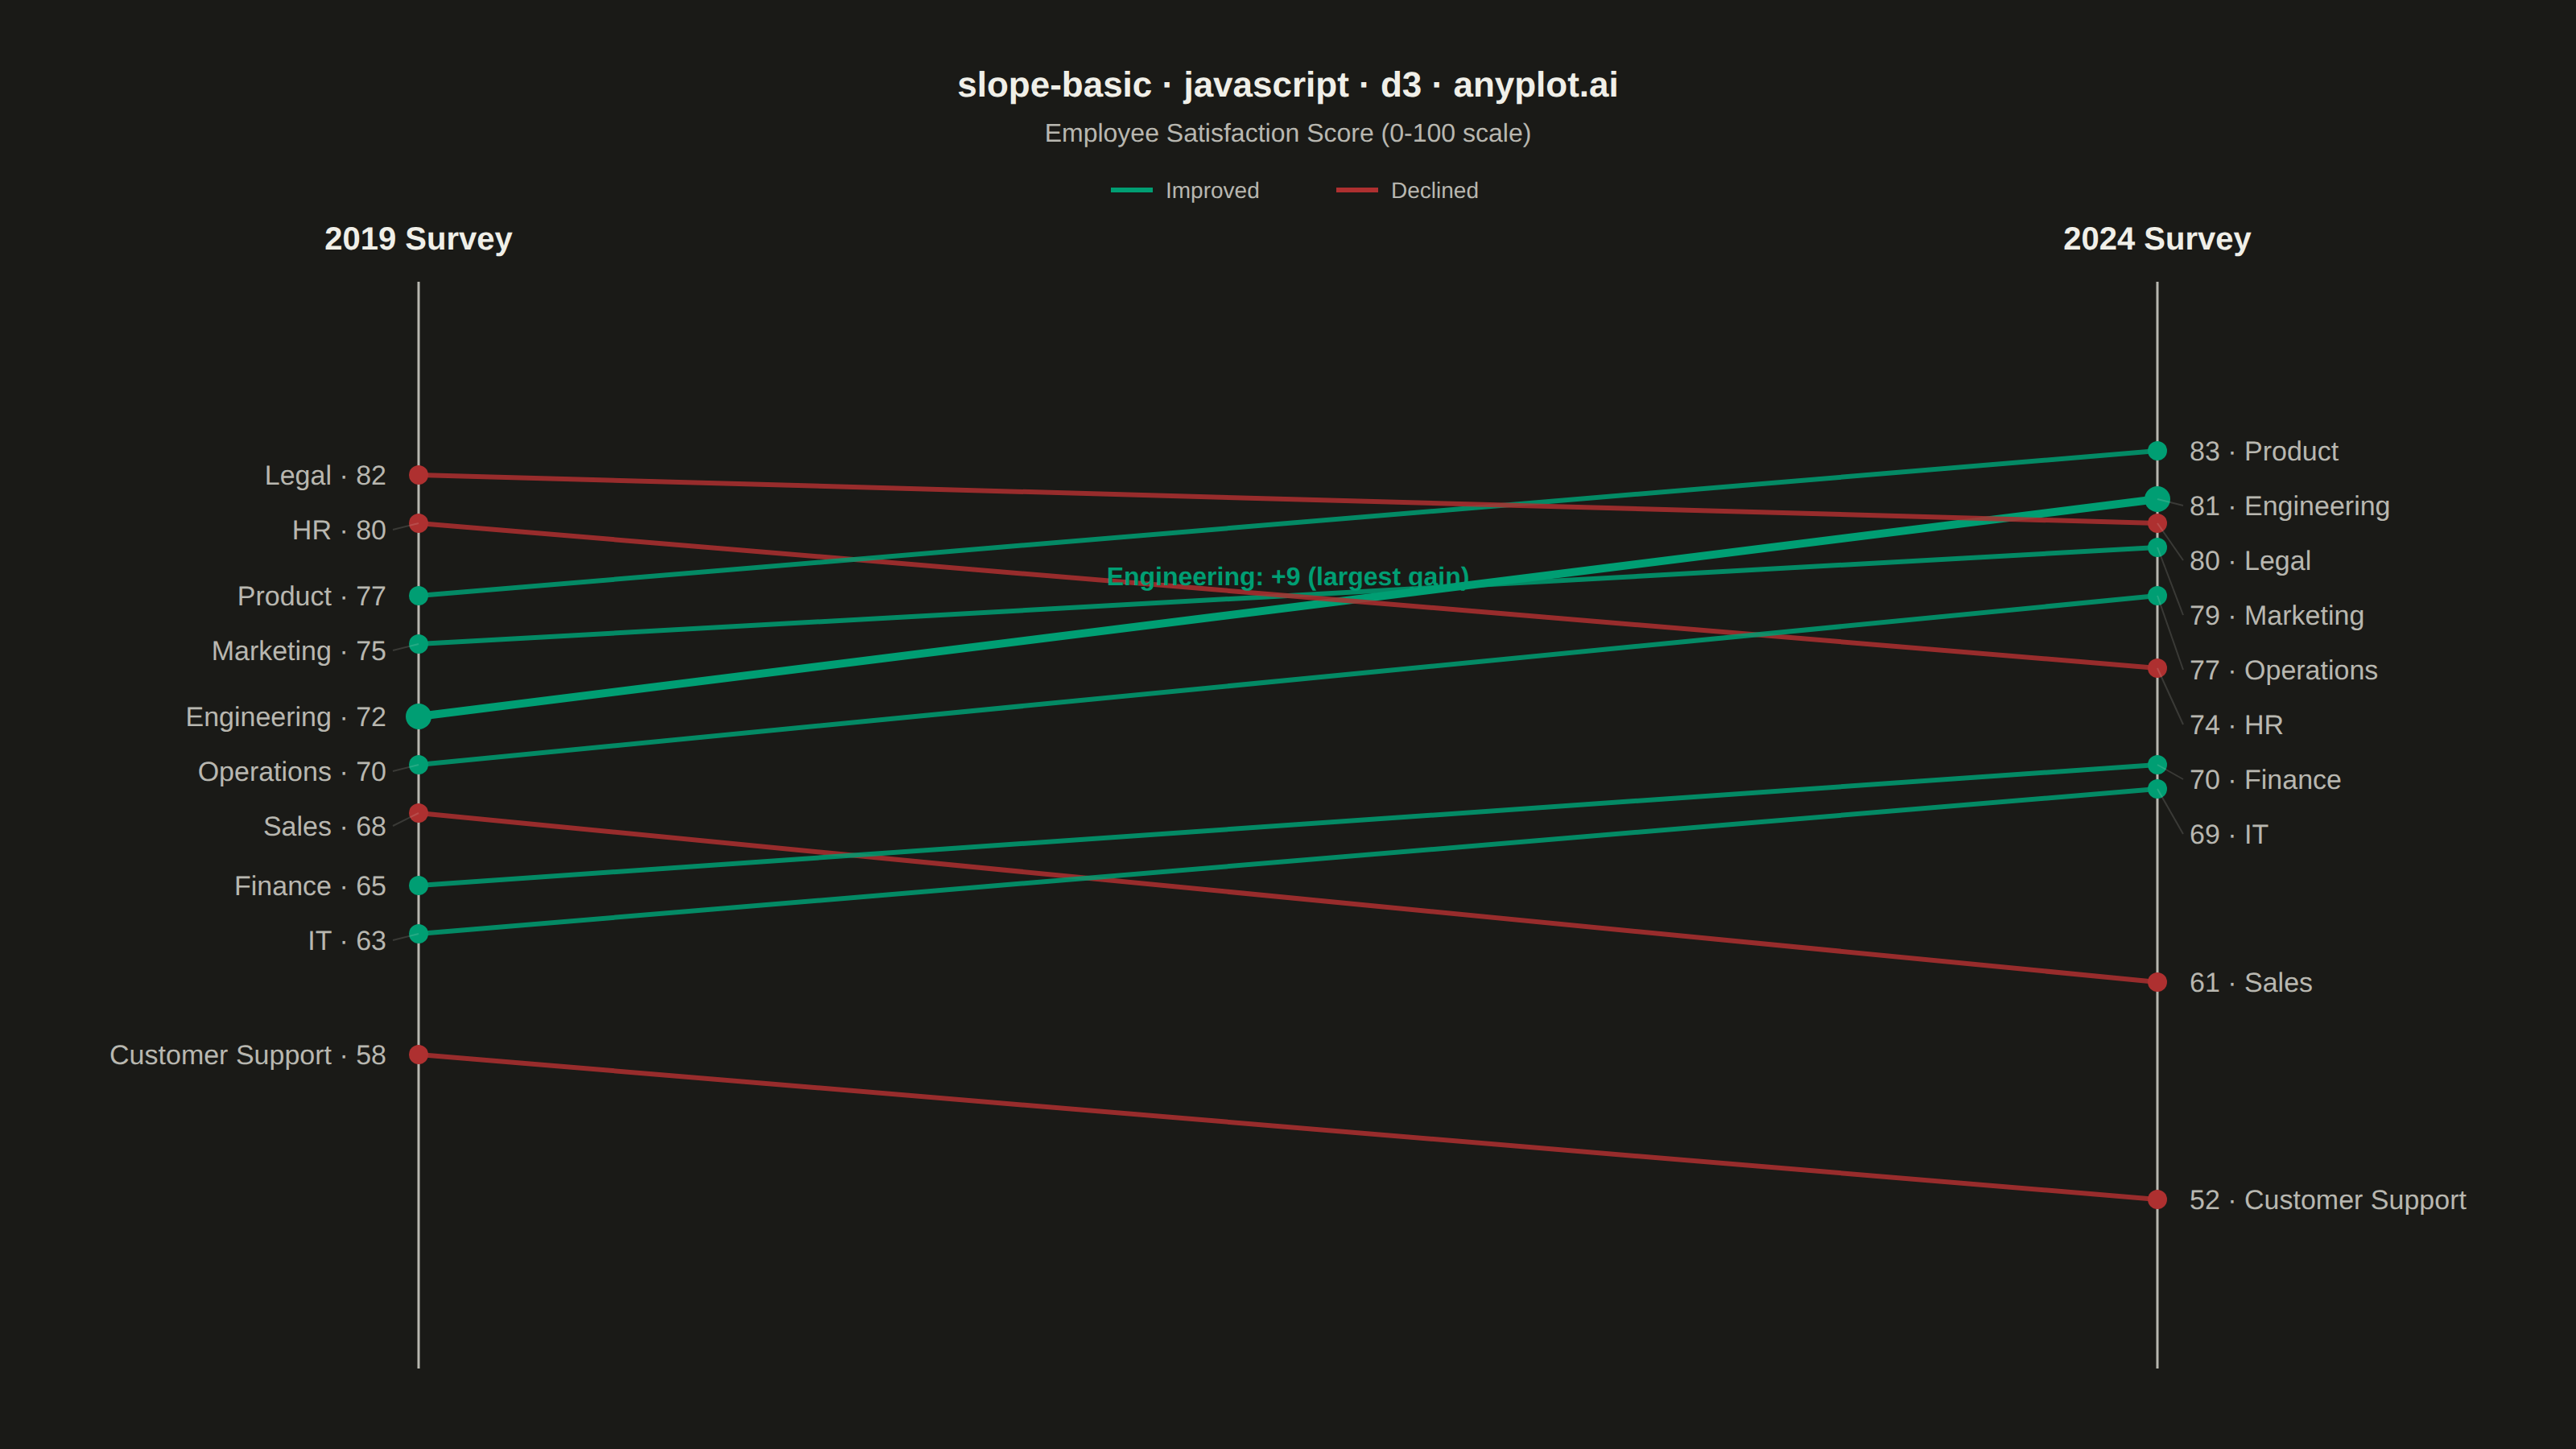
A slope chart (slopegraph) visualizes changes between two time points by connecting values with lines across vertical axes. It emphasizes the direction and magnitude of change rather than absolute values, making it ideal for spotting increases, decreases, and rank changes at a glance. This chart type excels at before/after comparisons and highlighting which items improved or declined.
// anyplot.ai
// slope-basic: Basic Slope Chart (Slopegraph)
// Library: d3 7.9.0 | JavaScript 22.23.1
// Quality: 92/100 | Updated: 2026-07-26

const t = window.ANYPLOT_TOKENS;
const { width, height } = window.ANYPLOT_SIZE;

const margin = { top: 175, right: 260, bottom: 50, left: 260 };
const iw = width - margin.left - margin.right;
const ih = height - margin.top - margin.bottom;

// --- Data: employee satisfaction score (0-100) by department, 2019 vs 2024 survey
const data = [
  { department: "Engineering", year2019: 72, year2024: 81 },
  { department: "Sales", year2019: 68, year2024: 61 },
  { department: "Marketing", year2019: 75, year2024: 79 },
  { department: "HR", year2019: 80, year2024: 74 },
  { department: "Finance", year2019: 65, year2024: 70 },
  { department: "Customer Support", year2019: 58, year2024: 52 },
  { department: "Operations", year2019: 70, year2024: 77 },
  { department: "Product", year2019: 77, year2024: 83 },
  { department: "Legal", year2019: 82, year2024: 80 },
  { department: "IT", year2019: 63, year2024: 69 },
];

// --- Scale --------------------------------------------------------------------
const allValues = data.flatMap((d) => [d.year2019, d.year2024]);
const y = d3
  .scaleLinear()
  .domain([d3.min(allValues) - 5, d3.max(allValues) + 5])
  .nice()
  .range([ih, 0]);

const increaseColor = t.palette[0]; // brand green — always first series, doubles as "improved"
const decreaseColor = t.palette[4]; // matte red — Imprint semantic anchor for decline
const colorOf = (d) => (d.year2024 >= d.year2019 ? increaseColor : decreaseColor);

// --- Storytelling focal point: call out the single largest mover ---------------
const standout = d3.greatest(data, (d) => Math.abs(d.year2024 - d.year2019));

// --- Label decluttering: keep the true data point, nudge stacked labels apart --
// Slope charts pack many labels along two narrow columns; a plain scaleLinear
// position collides whenever two entities share a close value. Sort by position,
// enforce a minimum gap top-to-bottom, then re-settle from the bottom if the
// pass pushed the last label past the plot bounds.
function declutter(points, minGap) {
  const sorted = points.slice().sort((a, b) => a.y - b.y);
  for (let i = 1; i < sorted.length; i++) {
    if (sorted[i].y - sorted[i - 1].y < minGap) sorted[i].y = sorted[i - 1].y + minGap;
  }
  const overflow = sorted[sorted.length - 1].y - ih;
  if (overflow > 0) {
    for (let i = sorted.length - 1; i >= 0; i--) {
      sorted[i].y -= overflow;
      if (i > 0 && sorted[i].y - sorted[i - 1].y >= minGap) break;
    }
  }
  return sorted;
}

const minGap = 34;
const leftLabels = declutter(
  data.map((d) => ({ d, trueY: y(d.year2019), y: y(d.year2019) })),
  minGap
);
const rightLabels = declutter(
  data.map((d) => ({ d, trueY: y(d.year2024), y: y(d.year2024) })),
  minGap
);

// --- SVG mount ------------------------------------------------------------------
const svg = d3.select("#container").append("svg").attr("width", width).attr("height", height);
const g = svg.append("g").attr("transform", `translate(${margin.left},${margin.top})`);

// --- Vertical axes: the two survey years ----------------------------------------
g.append("line")
  .attr("x1", 0).attr("x2", 0).attr("y1", 0).attr("y2", ih)
  .attr("stroke", t.inkSoft).attr("stroke-width", 1.5);
g.append("line")
  .attr("x1", iw).attr("x2", iw).attr("y1", 0).attr("y2", ih)
  .attr("stroke", t.inkSoft).attr("stroke-width", 1.5);

g.append("text")
  .attr("x", 0).attr("y", -20).attr("text-anchor", "middle")
  .attr("fill", t.ink).style("font-size", "20px").style("font-weight", "600")
  .text("2019 Survey");
g.append("text")
  .attr("x", iw).attr("y", -20).attr("text-anchor", "middle")
  .attr("fill", t.ink).style("font-size", "20px").style("font-weight", "600")
  .text("2024 Survey");

// --- Slope lines + endpoint markers ----------------------------------------------
g.selectAll(".slope-line")
  .data(data)
  .join("line")
  .attr("class", "slope-line")
  .attr("x1", 0).attr("y1", (d) => y(d.year2019))
  .attr("x2", iw).attr("y2", (d) => y(d.year2024))
  .attr("stroke", colorOf)
  .attr("stroke-width", (d) => (d === standout ? 5 : 3))
  .attr("opacity", (d) => (d === standout ? 1 : 0.85));

g.selectAll(".start-point")
  .data(data)
  .join("circle")
  .attr("class", "start-point")
  .attr("cx", 0).attr("cy", (d) => y(d.year2019))
  .attr("r", (d) => (d === standout ? 8 : 6)).attr("fill", colorOf);

g.selectAll(".end-point")
  .data(data)
  .join("circle")
  .attr("class", "end-point")
  .attr("cx", iw).attr("cy", (d) => y(d.year2024))
  .attr("r", (d) => (d === standout ? 8 : 6)).attr("fill", colorOf);

// --- Focal-point annotation: label the standout mover at its line midpoint -----
const standoutDelta = standout.year2024 - standout.year2019;
g.append("text")
  .attr("x", iw / 2)
  .attr("y", (y(standout.year2019) + y(standout.year2024)) / 2 - 14)
  .attr("text-anchor", "middle")
  .attr("fill", colorOf(standout)).style("font-size", "16px").style("font-weight", "700")
  .text(`${standout.department}: ${standoutDelta > 0 ? "+" : ""}${standoutDelta} (largest ${standoutDelta > 0 ? "gain" : "decline"})`);

// --- Leader ticks where a label was nudged off its true position -----------------
g.selectAll(".leader-left")
  .data(leftLabels.filter((p) => Math.abs(p.y - p.trueY) > 1))
  .join("line")
  .attr("class", "leader-left")
  .attr("x1", 0).attr("y1", (p) => p.trueY)
  .attr("x2", -16).attr("y2", (p) => p.y)
  .attr("stroke", t.grid).attr("stroke-width", 1);

g.selectAll(".leader-right")
  .data(rightLabels.filter((p) => Math.abs(p.y - p.trueY) > 1))
  .join("line")
  .attr("class", "leader-right")
  .attr("x1", iw).attr("y1", (p) => p.trueY)
  .attr("x2", iw + 16).attr("y2", (p) => p.y)
  .attr("stroke", t.grid).attr("stroke-width", 1);

// --- Endpoint labels ---------------------------------------------------------------
g.selectAll(".label-left")
  .data(leftLabels)
  .join("text")
  .attr("class", "label-left")
  .attr("x", -20).attr("y", (p) => p.y)
  .attr("dy", "0.35em").attr("text-anchor", "end")
  .attr("fill", t.inkSoft).style("font-size", "17px")
  .text((p) => `${p.d.department} · ${p.d.year2019}`);

g.selectAll(".label-right")
  .data(rightLabels)
  .join("text")
  .attr("class", "label-right")
  .attr("x", iw + 20).attr("y", (p) => p.y)
  .attr("dy", "0.35em").attr("text-anchor", "start")
  .attr("fill", t.inkSoft).style("font-size", "17px")
  .text((p) => `${p.d.year2024} · ${p.d.department}`);

// --- Legend: line direction -----------------------------------------------------
const legend = svg.append("g").attr("transform", `translate(${width / 2 - 110}, 118)`);
legend.append("line")
  .attr("x1", 0).attr("x2", 26).attr("y1", 0).attr("y2", 0)
  .attr("stroke", increaseColor).attr("stroke-width", 3);
legend.append("text")
  .attr("x", 34).attr("y", 5)
  .attr("fill", t.inkSoft).style("font-size", "14px")
  .text("Improved");
legend.append("line")
  .attr("x1", 140).attr("x2", 166).attr("y1", 0).attr("y2", 0)
  .attr("stroke", decreaseColor).attr("stroke-width", 3);
legend.append("text")
  .attr("x", 174).attr("y", 5)
  .attr("fill", t.inkSoft).style("font-size", "14px")
  .text("Declined");

// --- Title + subtitle ------------------------------------------------------------
svg.append("text")
  .attr("x", width / 2).attr("y", 60).attr("text-anchor", "middle")
  .attr("fill", t.ink).style("font-size", "22px").style("font-weight", "600")
  .text("slope-basic · javascript · d3 · anyplot.ai");
svg.append("text")
  .attr("x", width / 2).attr("y", 88).attr("text-anchor", "middle")
  .attr("fill", t.inkSoft).style("font-size", "16px")
  .text("Employee Satisfaction Score (0-100 scale)");
Runnable source as JSON, for any HTTP client: https://api.anyplot.ai/specs/slope-basic/d3/code. Any spec id and library id listed in llms-full.txt fit the same URL shape; every URL below is complete and callable.
{
  "spec_id": "slope-basic",
  "language": "javascript",
  "library": "d3",
  "page": "https://anyplot.ai/slope-basic/javascript/d3",
  "hub": "https://anyplot.ai/slope-basic",
  "code_json": "https://api.anyplot.ai/specs/slope-basic/d3/code",
  "spec_json": "https://api.anyplot.ai/specs/slope-basic",
  "render_light_png": "https://storage.googleapis.com/anyplot-images/plots/slope-basic/javascript/d3/plot-light.png",
  "render_dark_png": "https://storage.googleapis.com/anyplot-images/plots/slope-basic/javascript/d3/plot-dark.png",
  "interactive_light_html": "https://storage.googleapis.com/anyplot-images/plots/slope-basic/javascript/d3/plot-light.html",
  "interactive_dark_html": "https://storage.googleapis.com/anyplot-images/plots/slope-basic/javascript/d3/plot-dark.html",
  "quality_score": 92.0,
  "license": "MIT",
  "guide": "https://anyplot.ai/llms.txt"
}
Part of Basic Slope Chart (Slopegraph) on anyplot.ai.