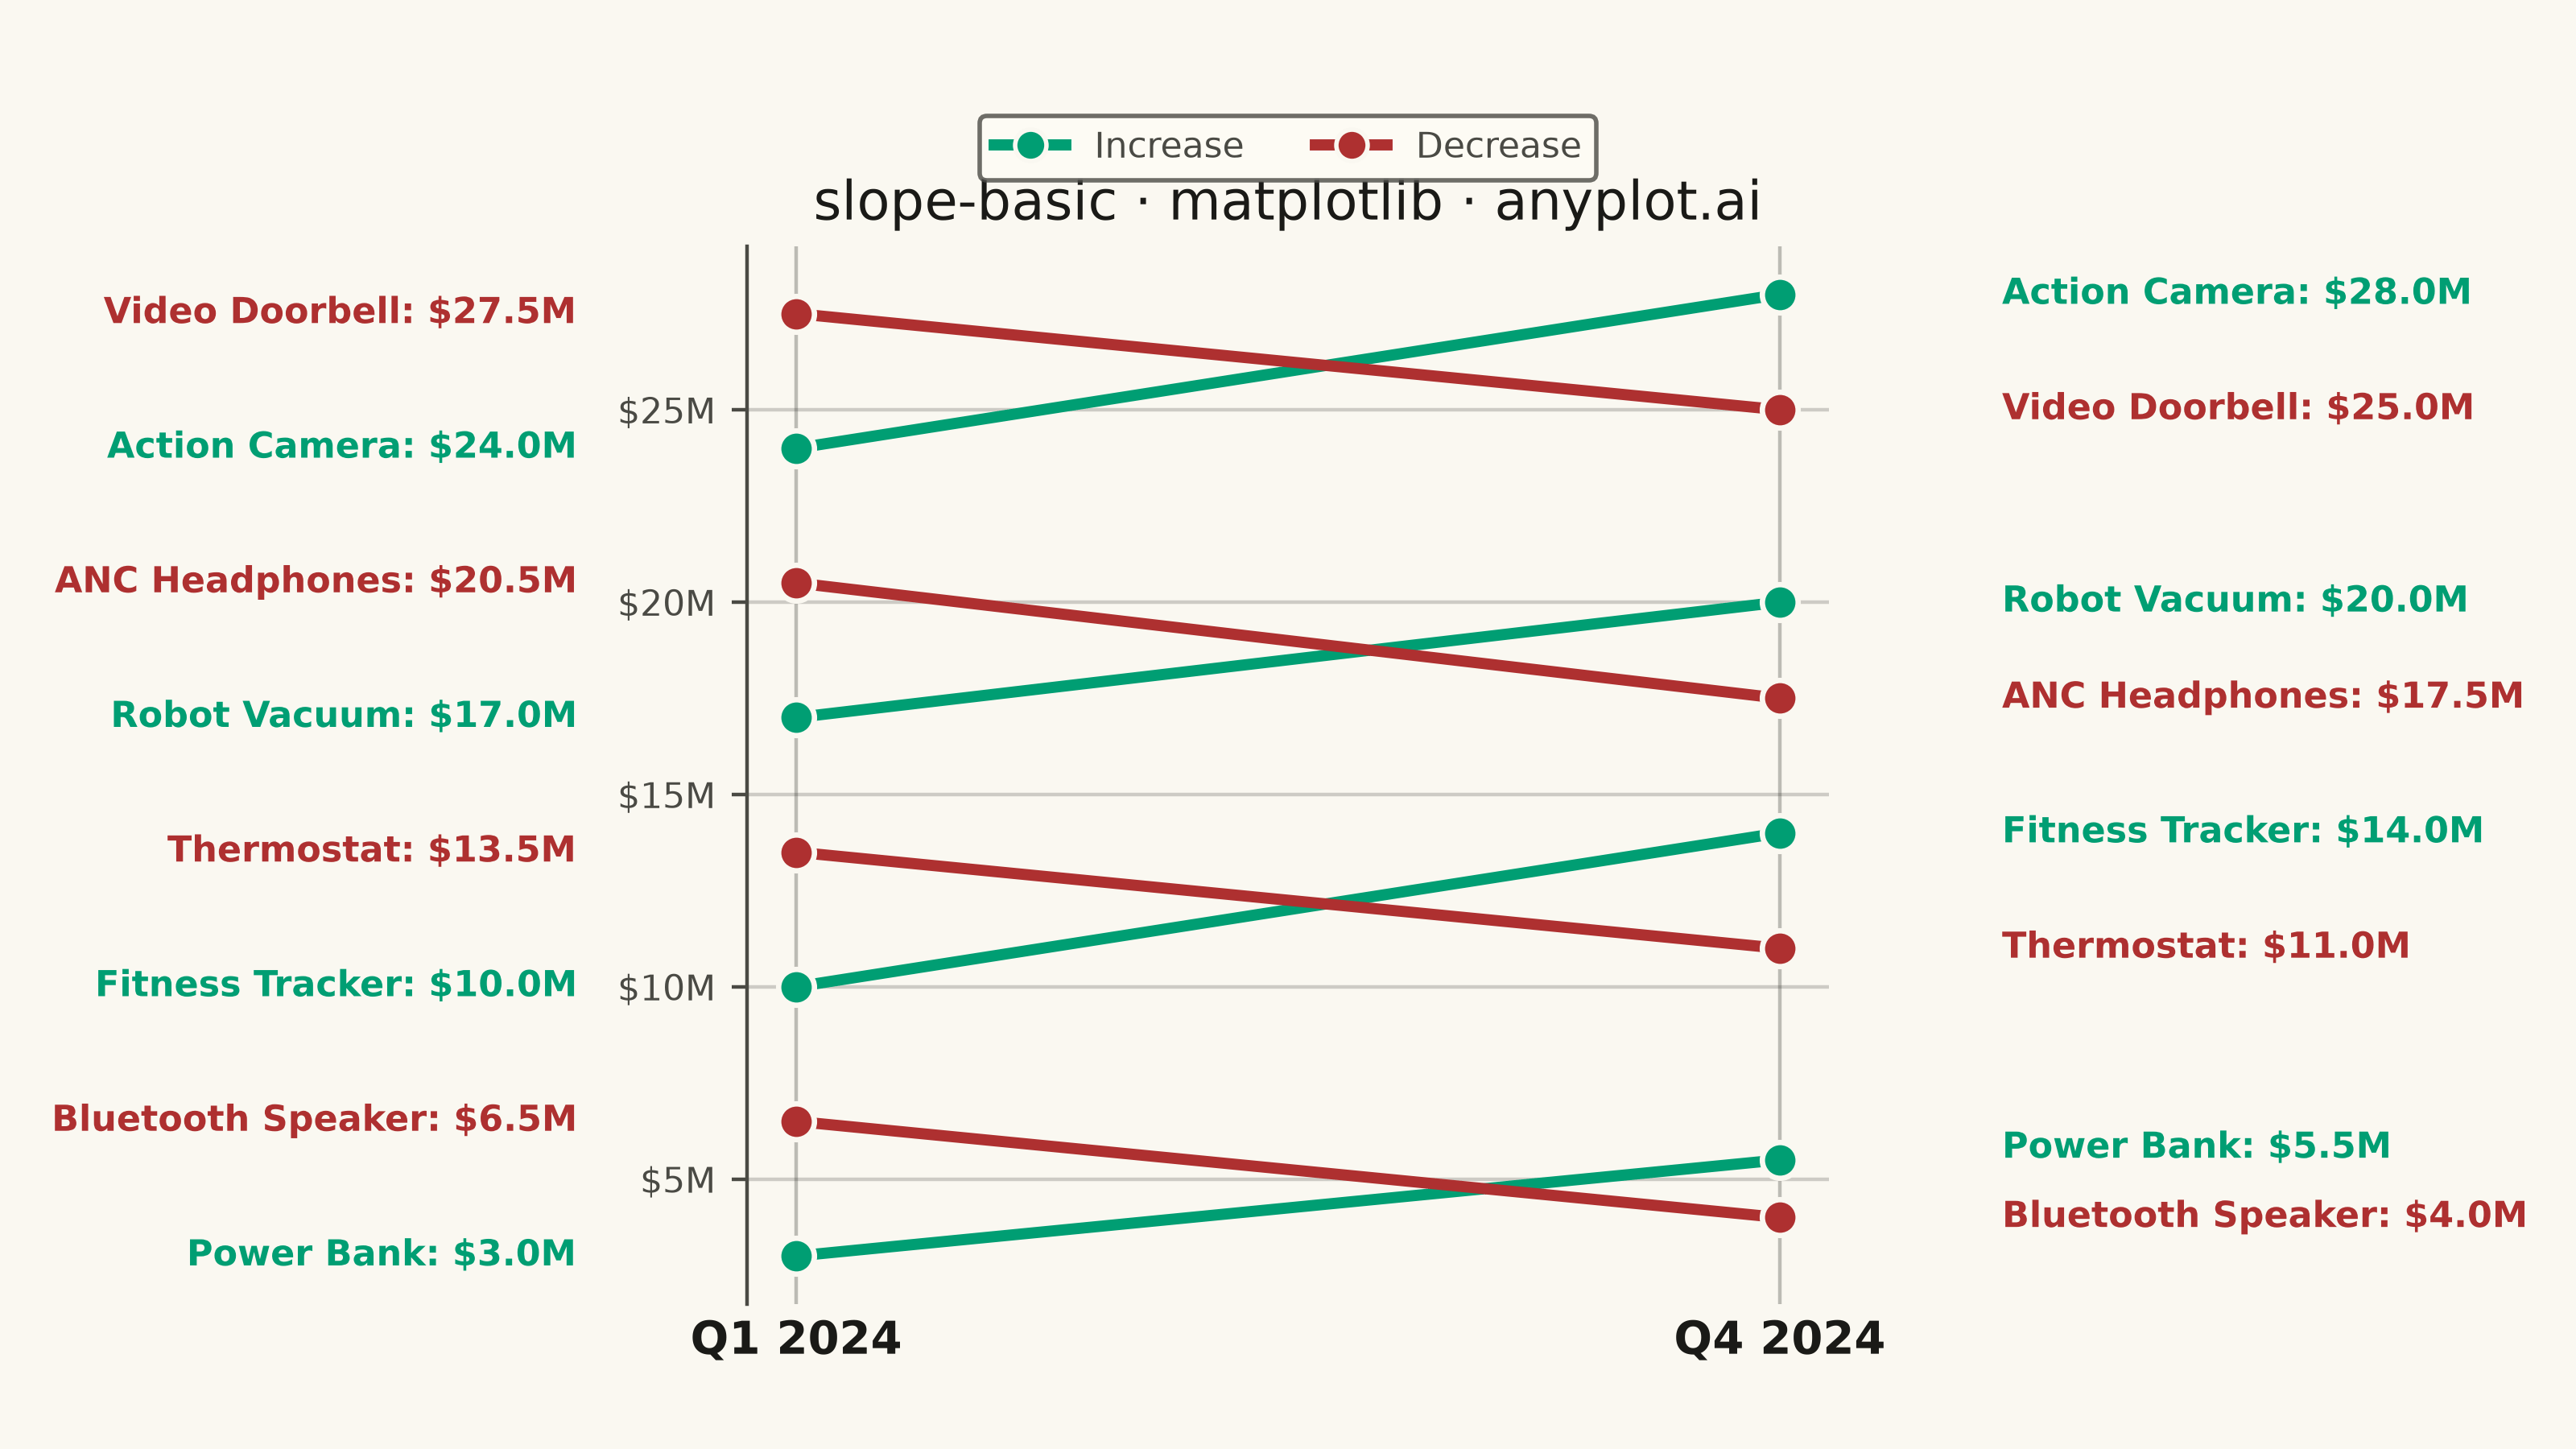
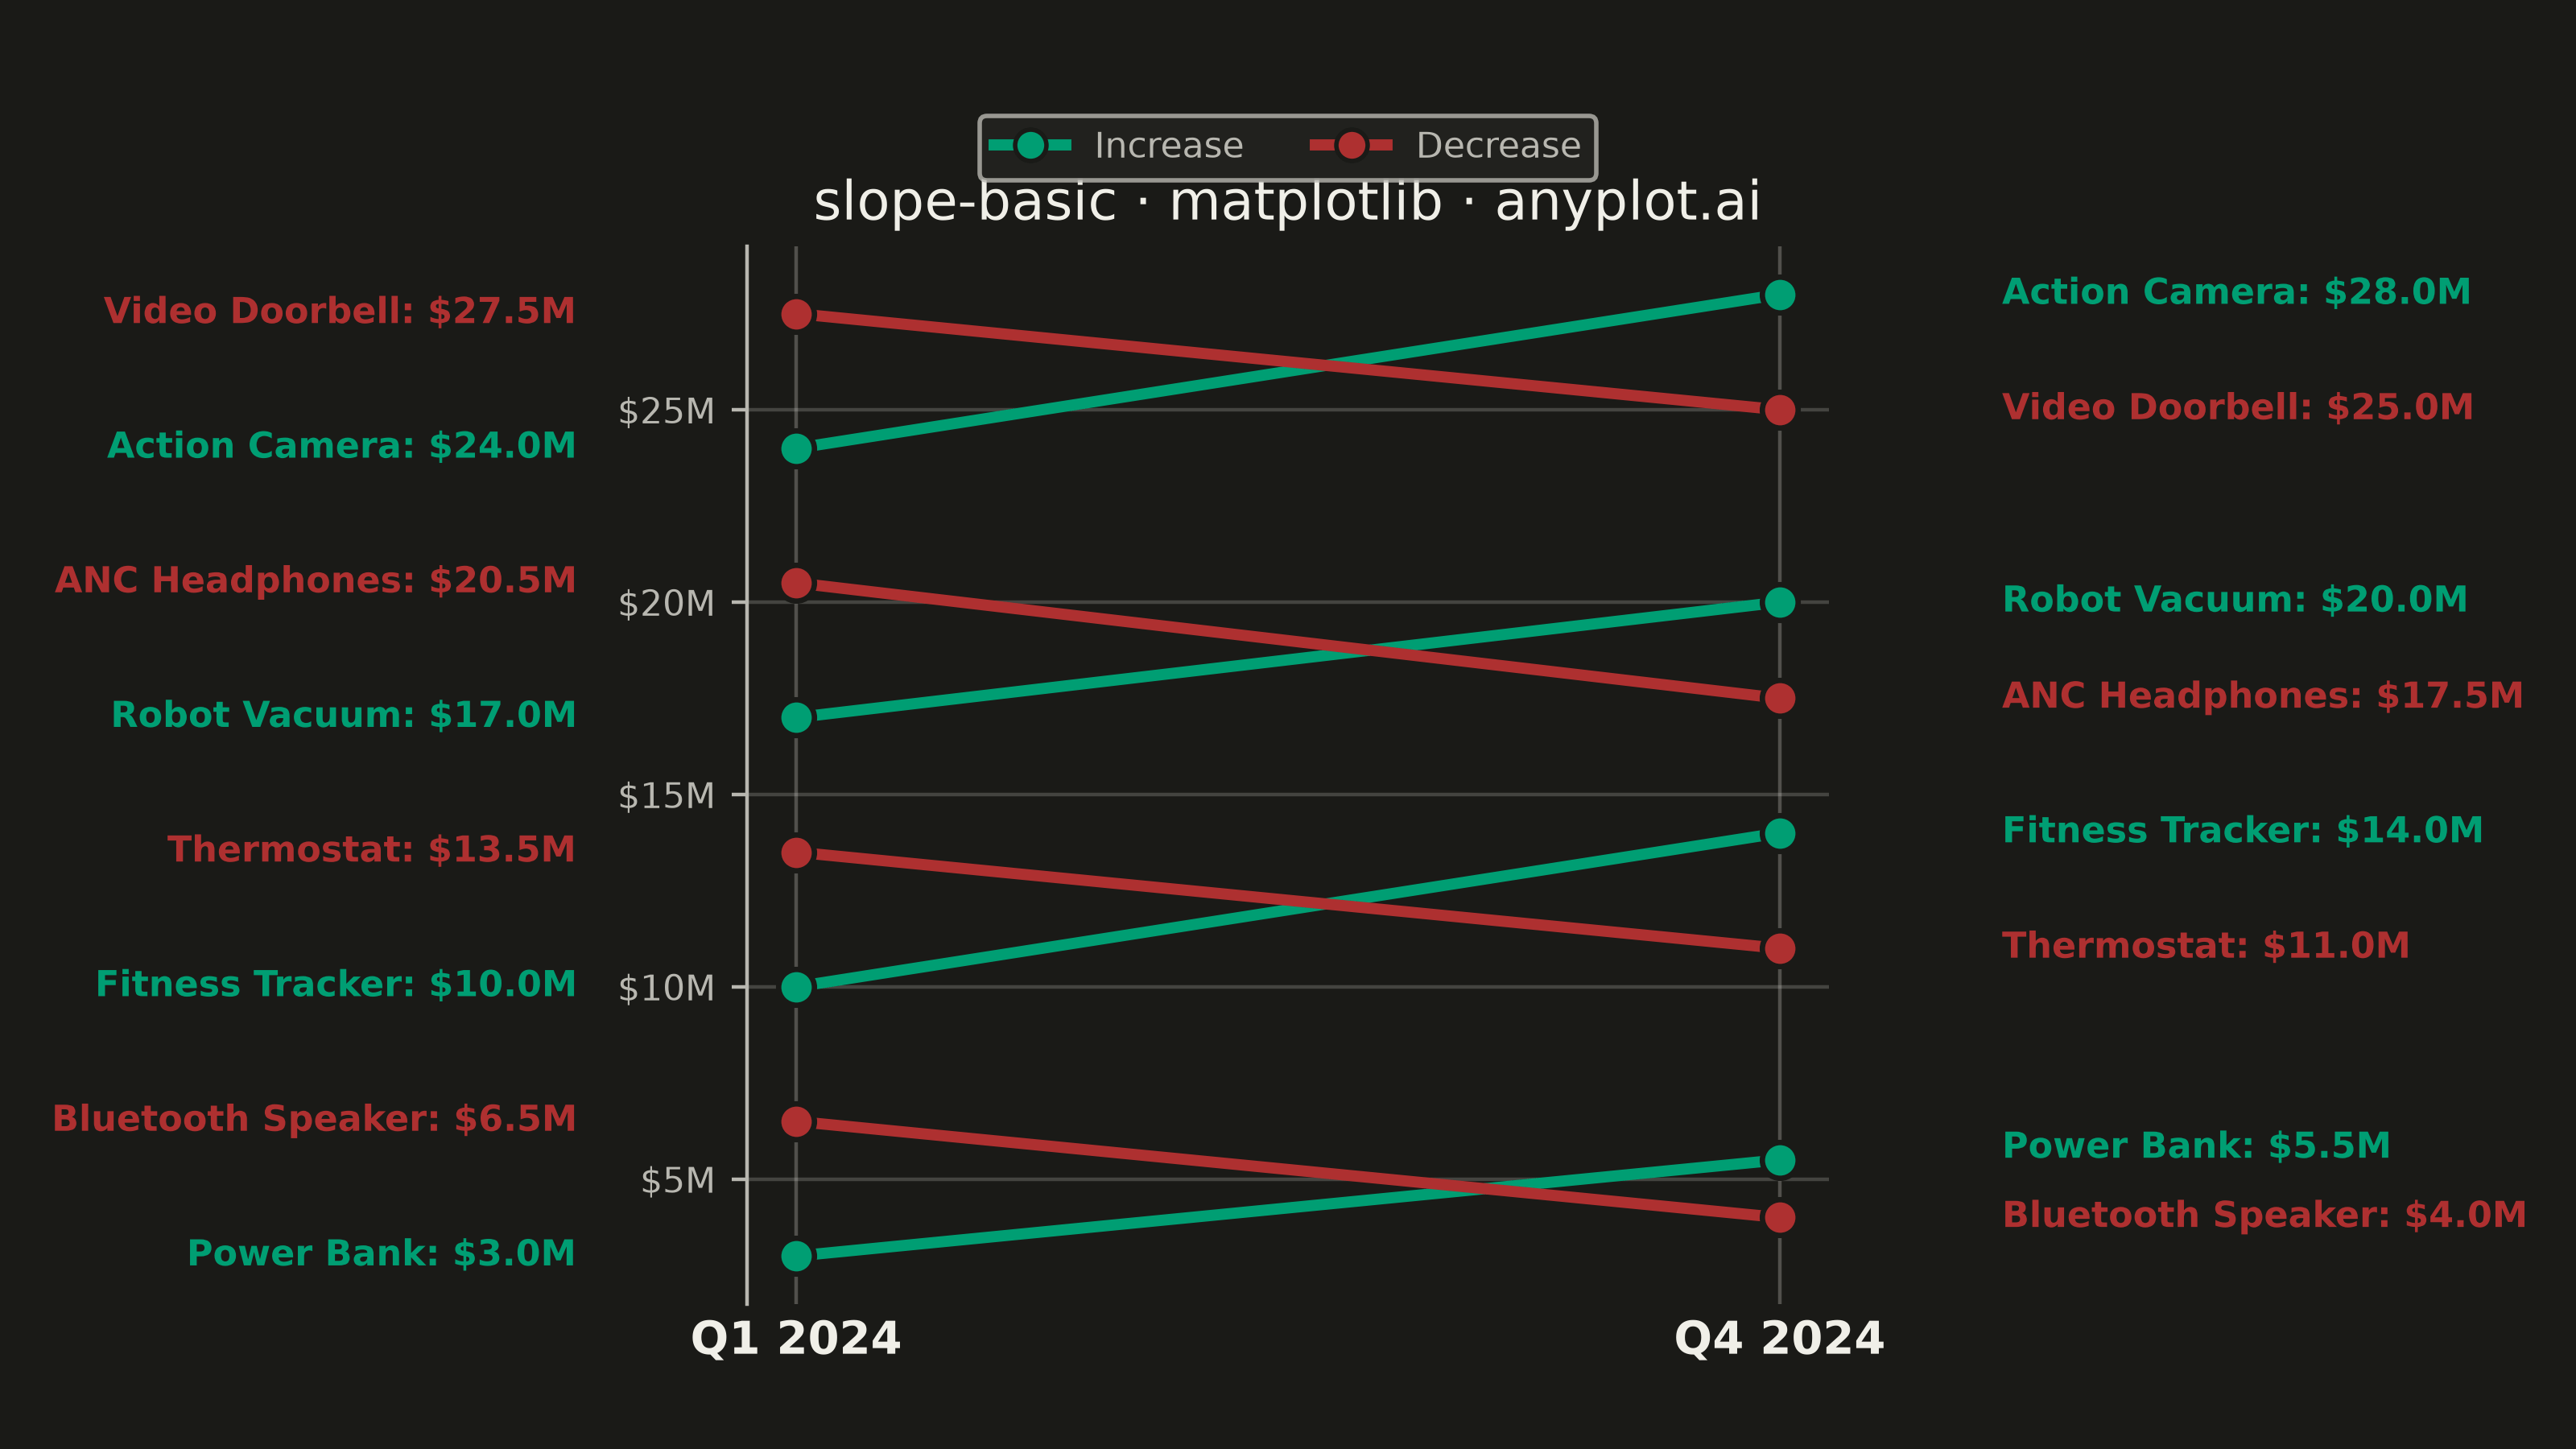
A slope chart (slopegraph) visualizes changes between two or more time points by connecting values with lines across vertical axes. It emphasizes the direction and magnitude of change rather than absolute values, making it ideal for spotting increases, decreases, and rank changes at a glance. This chart type excels at before/after comparisons and highlighting which items improved or declined.
""" anyplot.ai
slope-basic: Basic Slope Chart (Slopegraph)
Library: matplotlib 3.11.1 | Python 3.13.14
Quality: 93/100 | Updated: 2026-07-25
"""

import os

import matplotlib.patheffects as patheffects
import matplotlib.pyplot as plt
import matplotlib.ticker as mticker
from matplotlib.lines import Line2D
from matplotlib.transforms import blended_transform_factory


# Theme
THEME = os.getenv("ANYPLOT_THEME", "light")
PAGE_BG = "#FAF8F1" if THEME == "light" else "#1A1A17"
ELEVATED_BG = "#FFFDF6" if THEME == "light" else "#242420"
INK = "#1A1A17" if THEME == "light" else "#F0EFE8"
INK_SOFT = "#4A4A44" if THEME == "light" else "#B8B7B0"

COLOR_INC = "#009E73"  # Imprint green — profit/gain semantic anchor
COLOR_DEC = "#AE3030"  # Imprint matte red — loss/decrease semantic anchor

# Data: quarterly revenue for a consumer-electronics product line
products = [
    "Power Bank",
    "Bluetooth Speaker",
    "Fitness Tracker",
    "Thermostat",
    "Robot Vacuum",
    "ANC Headphones",
    "Action Camera",
    "Video Doorbell",
]
q1_sales = [3.0, 6.5, 10.0, 13.5, 17.0, 20.5, 24.0, 27.5]
q4_sales = [5.5, 4.0, 14.0, 11.0, 20.0, 17.5, 28.0, 25.0]
changes = [q4 - q1 for q1, q4 in zip(q1_sales, q4_sales, strict=True)]

# Label collision avoidance: sort by value and nudge positions if too close
min_gap = 1.8

q1_indexed = sorted(enumerate(q1_sales), key=lambda x: x[1])
q1_label_pos = [0.0] * len(q1_sales)
for i, (orig_idx, val) in enumerate(q1_indexed):
    if i == 0:
        q1_label_pos[orig_idx] = val
    else:
        prev_idx = q1_indexed[i - 1][0]
        if val - q1_label_pos[prev_idx] < min_gap:
            q1_label_pos[orig_idx] = q1_label_pos[prev_idx] + min_gap
        else:
            q1_label_pos[orig_idx] = val

q4_indexed = sorted(enumerate(q4_sales), key=lambda x: x[1])
q4_label_pos = [0.0] * len(q4_sales)
for i, (orig_idx, val) in enumerate(q4_indexed):
    if i == 0:
        q4_label_pos[orig_idx] = val
    else:
        prev_idx = q4_indexed[i - 1][0]
        if val - q4_label_pos[prev_idx] < min_gap:
            q4_label_pos[orig_idx] = q4_label_pos[prev_idx] + min_gap
        else:
            q4_label_pos[orig_idx] = val

# Plot — canonical landscape canvas: figsize x dpi = 3200x1800px, no bbox_inches="tight"
fig, ax = plt.subplots(figsize=(8, 4.5), dpi=400, facecolor=PAGE_BG)
ax.set_facecolor(PAGE_BG)
fig.subplots_adjust(left=0.29, right=0.71, top=0.83, bottom=0.1)

x_positions = [0, 1]

# Vertical column lines at axis positions — structural anchors for the slopegraph
for x in x_positions:
    ax.axvline(x, color=INK_SOFT, linewidth=0.8, alpha=0.35, zorder=0)

# Blended transform (axes-fraction x, data y): labels sit a fixed fraction of the
# axes width outside the plotted columns regardless of the data's y-range, so the
# collision-nudge math above only ever needs to reason in data (y) space.
label_transform = blended_transform_factory(ax.transAxes, ax.transData)
label_stroke = [patheffects.withStroke(linewidth=2, foreground=PAGE_BG)]

for i, (product, q1, q4, change) in enumerate(zip(products, q1_sales, q4_sales, changes, strict=True)):
    color = COLOR_INC if change >= 0 else COLOR_DEC
    ax.plot(
        x_positions,
        [q1, q4],
        marker="o",
        markersize=8,
        linewidth=2.5,
        color=color,
        markeredgecolor=PAGE_BG,
        markeredgewidth=1.2,
    )

    # Left label: product name + Q1 value; dotted stub if the label was nudged to avoid a collision
    lpos = q1_label_pos[i]
    if abs(lpos - q1) > 0.05:
        ax.plot(
            [-0.09, -0.09], [q1, lpos], color=color, linewidth=0.7, alpha=0.4, linestyle=":", transform=label_transform
        )
    ax.text(
        -0.16,
        lpos,
        f"{product}: ${q1:.1f}M",
        ha="right",
        va="center",
        fontsize=8,
        color=color,
        fontweight="bold",
        transform=label_transform,
        clip_on=False,
        path_effects=label_stroke,
    )

    # Right label: product name + Q4 value; dotted stub if the label was nudged to avoid a collision
    rpos = q4_label_pos[i]
    if abs(rpos - q4) > 0.05:
        ax.plot(
            [1.09, 1.09], [q4, rpos], color=color, linewidth=0.7, alpha=0.4, linestyle=":", transform=label_transform
        )
    ax.text(
        1.16,
        rpos,
        f"{product}: ${q4:.1f}M",
        ha="left",
        va="center",
        fontsize=8,
        color=color,
        fontweight="bold",
        transform=label_transform,
        clip_on=False,
        path_effects=label_stroke,
    )

# Style
ax.set_xlim(-0.05, 1.05)
ax.set_xticks(x_positions)
ax.set_xticklabels(["Q1 2024", "Q4 2024"], fontsize=10, fontweight="bold", color=INK)

title = "slope-basic · matplotlib · anyplot.ai"
title_fontsize = max(8, round(12 * 67 / len(title))) if len(title) > 67 else 12
ax.set_title(title, fontsize=title_fontsize, fontweight="medium", color=INK)

ax.tick_params(axis="x", length=0)
ax.tick_params(axis="y", labelsize=8, labelcolor=INK_SOFT, colors=INK_SOFT)

# FuncFormatter for y-axis: show units inline as "$XM" for self-documenting tick labels
ax.yaxis.set_major_formatter(mticker.FuncFormatter(lambda val, _: f"${val:.0f}M"))

ax.spines["top"].set_visible(False)
ax.spines["right"].set_visible(False)
ax.spines["bottom"].set_visible(False)
ax.spines["left"].set_color(INK_SOFT)

ax.grid(True, axis="y", alpha=0.2, linewidth=0.8, color=INK)

# Legend centered below title
legend_elements = [
    Line2D(
        [0], [0], color=COLOR_INC, linewidth=2.5, marker="o", markersize=7, markeredgecolor=PAGE_BG, label="Increase"
    ),
    Line2D(
        [0], [0], color=COLOR_DEC, linewidth=2.5, marker="o", markersize=7, markeredgecolor=PAGE_BG, label="Decrease"
    ),
]
leg = ax.legend(
    handles=legend_elements, loc="upper center", bbox_to_anchor=(0.5, 1.14), fontsize=8, frameon=True, ncol=2
)
leg.get_frame().set_facecolor(ELEVATED_BG)
leg.get_frame().set_edgecolor(INK_SOFT)
plt.setp(leg.get_texts(), color=INK_SOFT)

plt.savefig(f"plot-{THEME}.png", dpi=400, facecolor=PAGE_BG)
Runnable source as JSON, for any HTTP client: https://api.anyplot.ai/specs/slope-basic/matplotlib/code. Any spec id and library id listed in llms-full.txt fit the same URL shape; every URL below is complete and callable.
{
  "spec_id": "slope-basic",
  "language": "python",
  "library": "matplotlib",
  "page": "https://anyplot.ai/slope-basic/python/matplotlib",
  "hub": "https://anyplot.ai/slope-basic",
  "code_json": "https://api.anyplot.ai/specs/slope-basic/matplotlib/code",
  "spec_json": "https://api.anyplot.ai/specs/slope-basic",
  "render_light_png": "https://storage.googleapis.com/anyplot-images/plots/slope-basic/python/matplotlib/plot-light.png",
  "render_dark_png": "https://storage.googleapis.com/anyplot-images/plots/slope-basic/python/matplotlib/plot-dark.png",
  "quality_score": 93.0,
  "license": "MIT",
  "guide": "https://anyplot.ai/llms.txt"
}
Part of Basic Slope Chart (Slopegraph) on anyplot.ai.