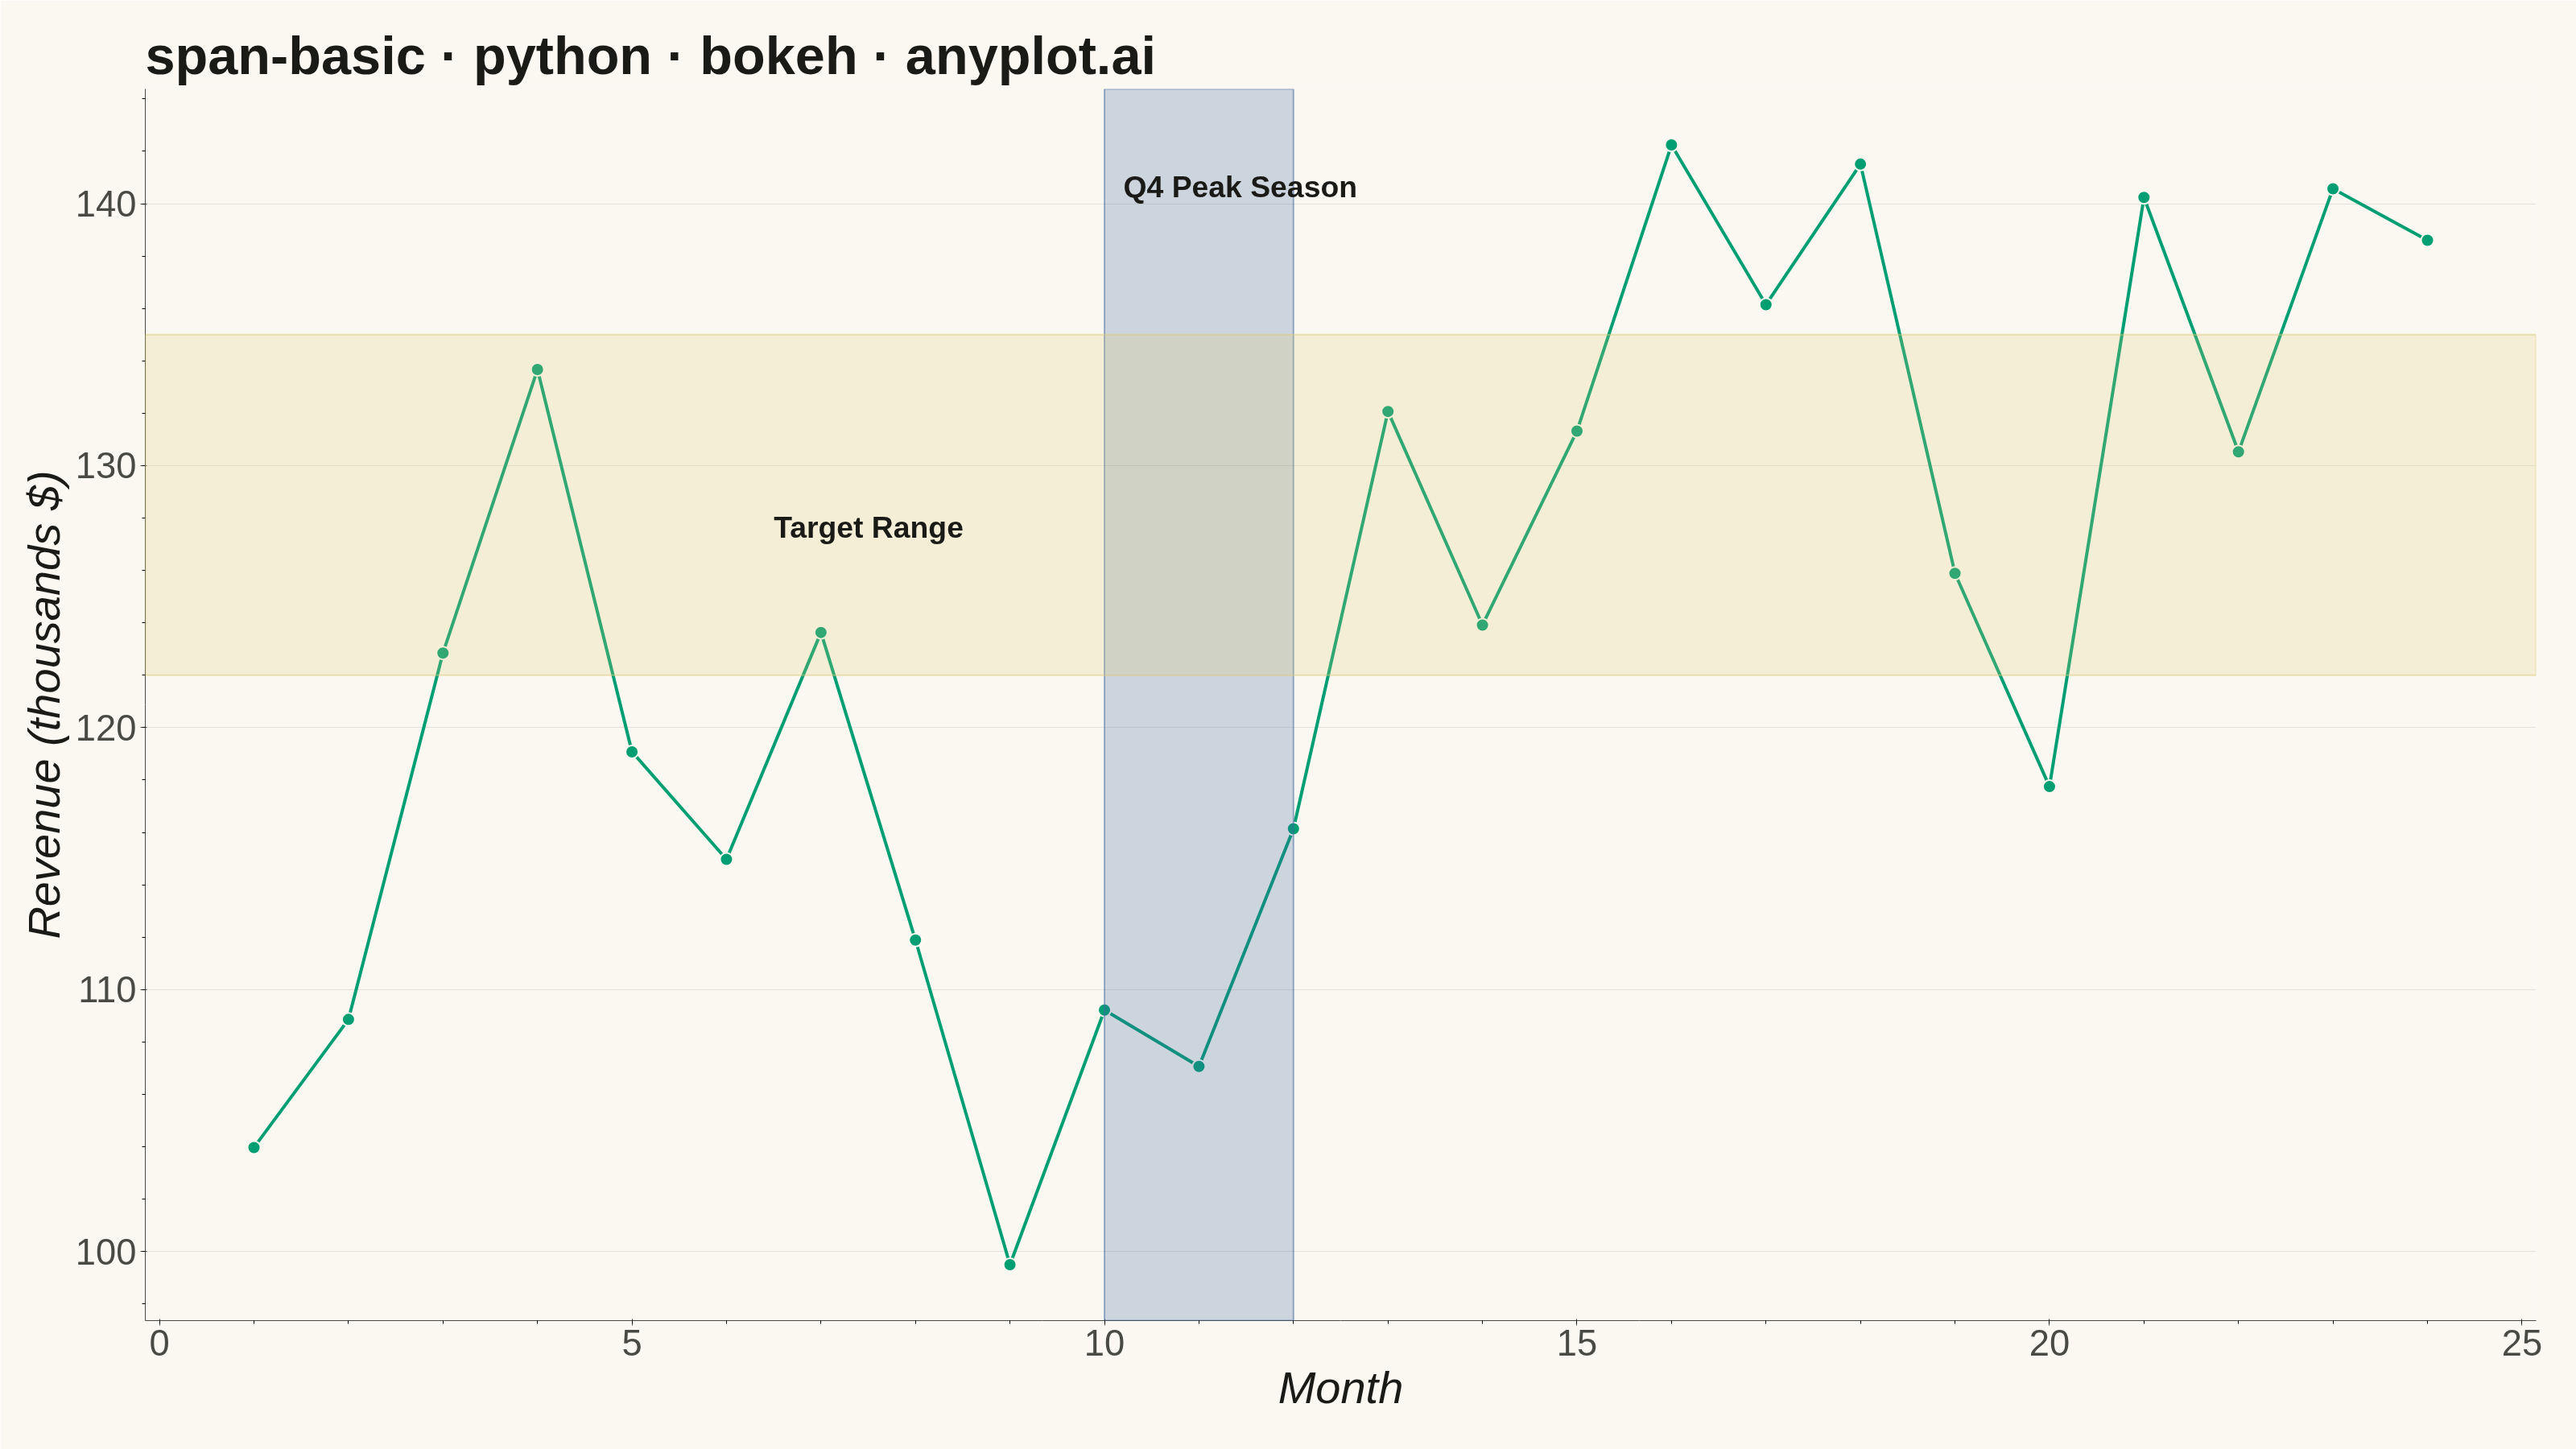
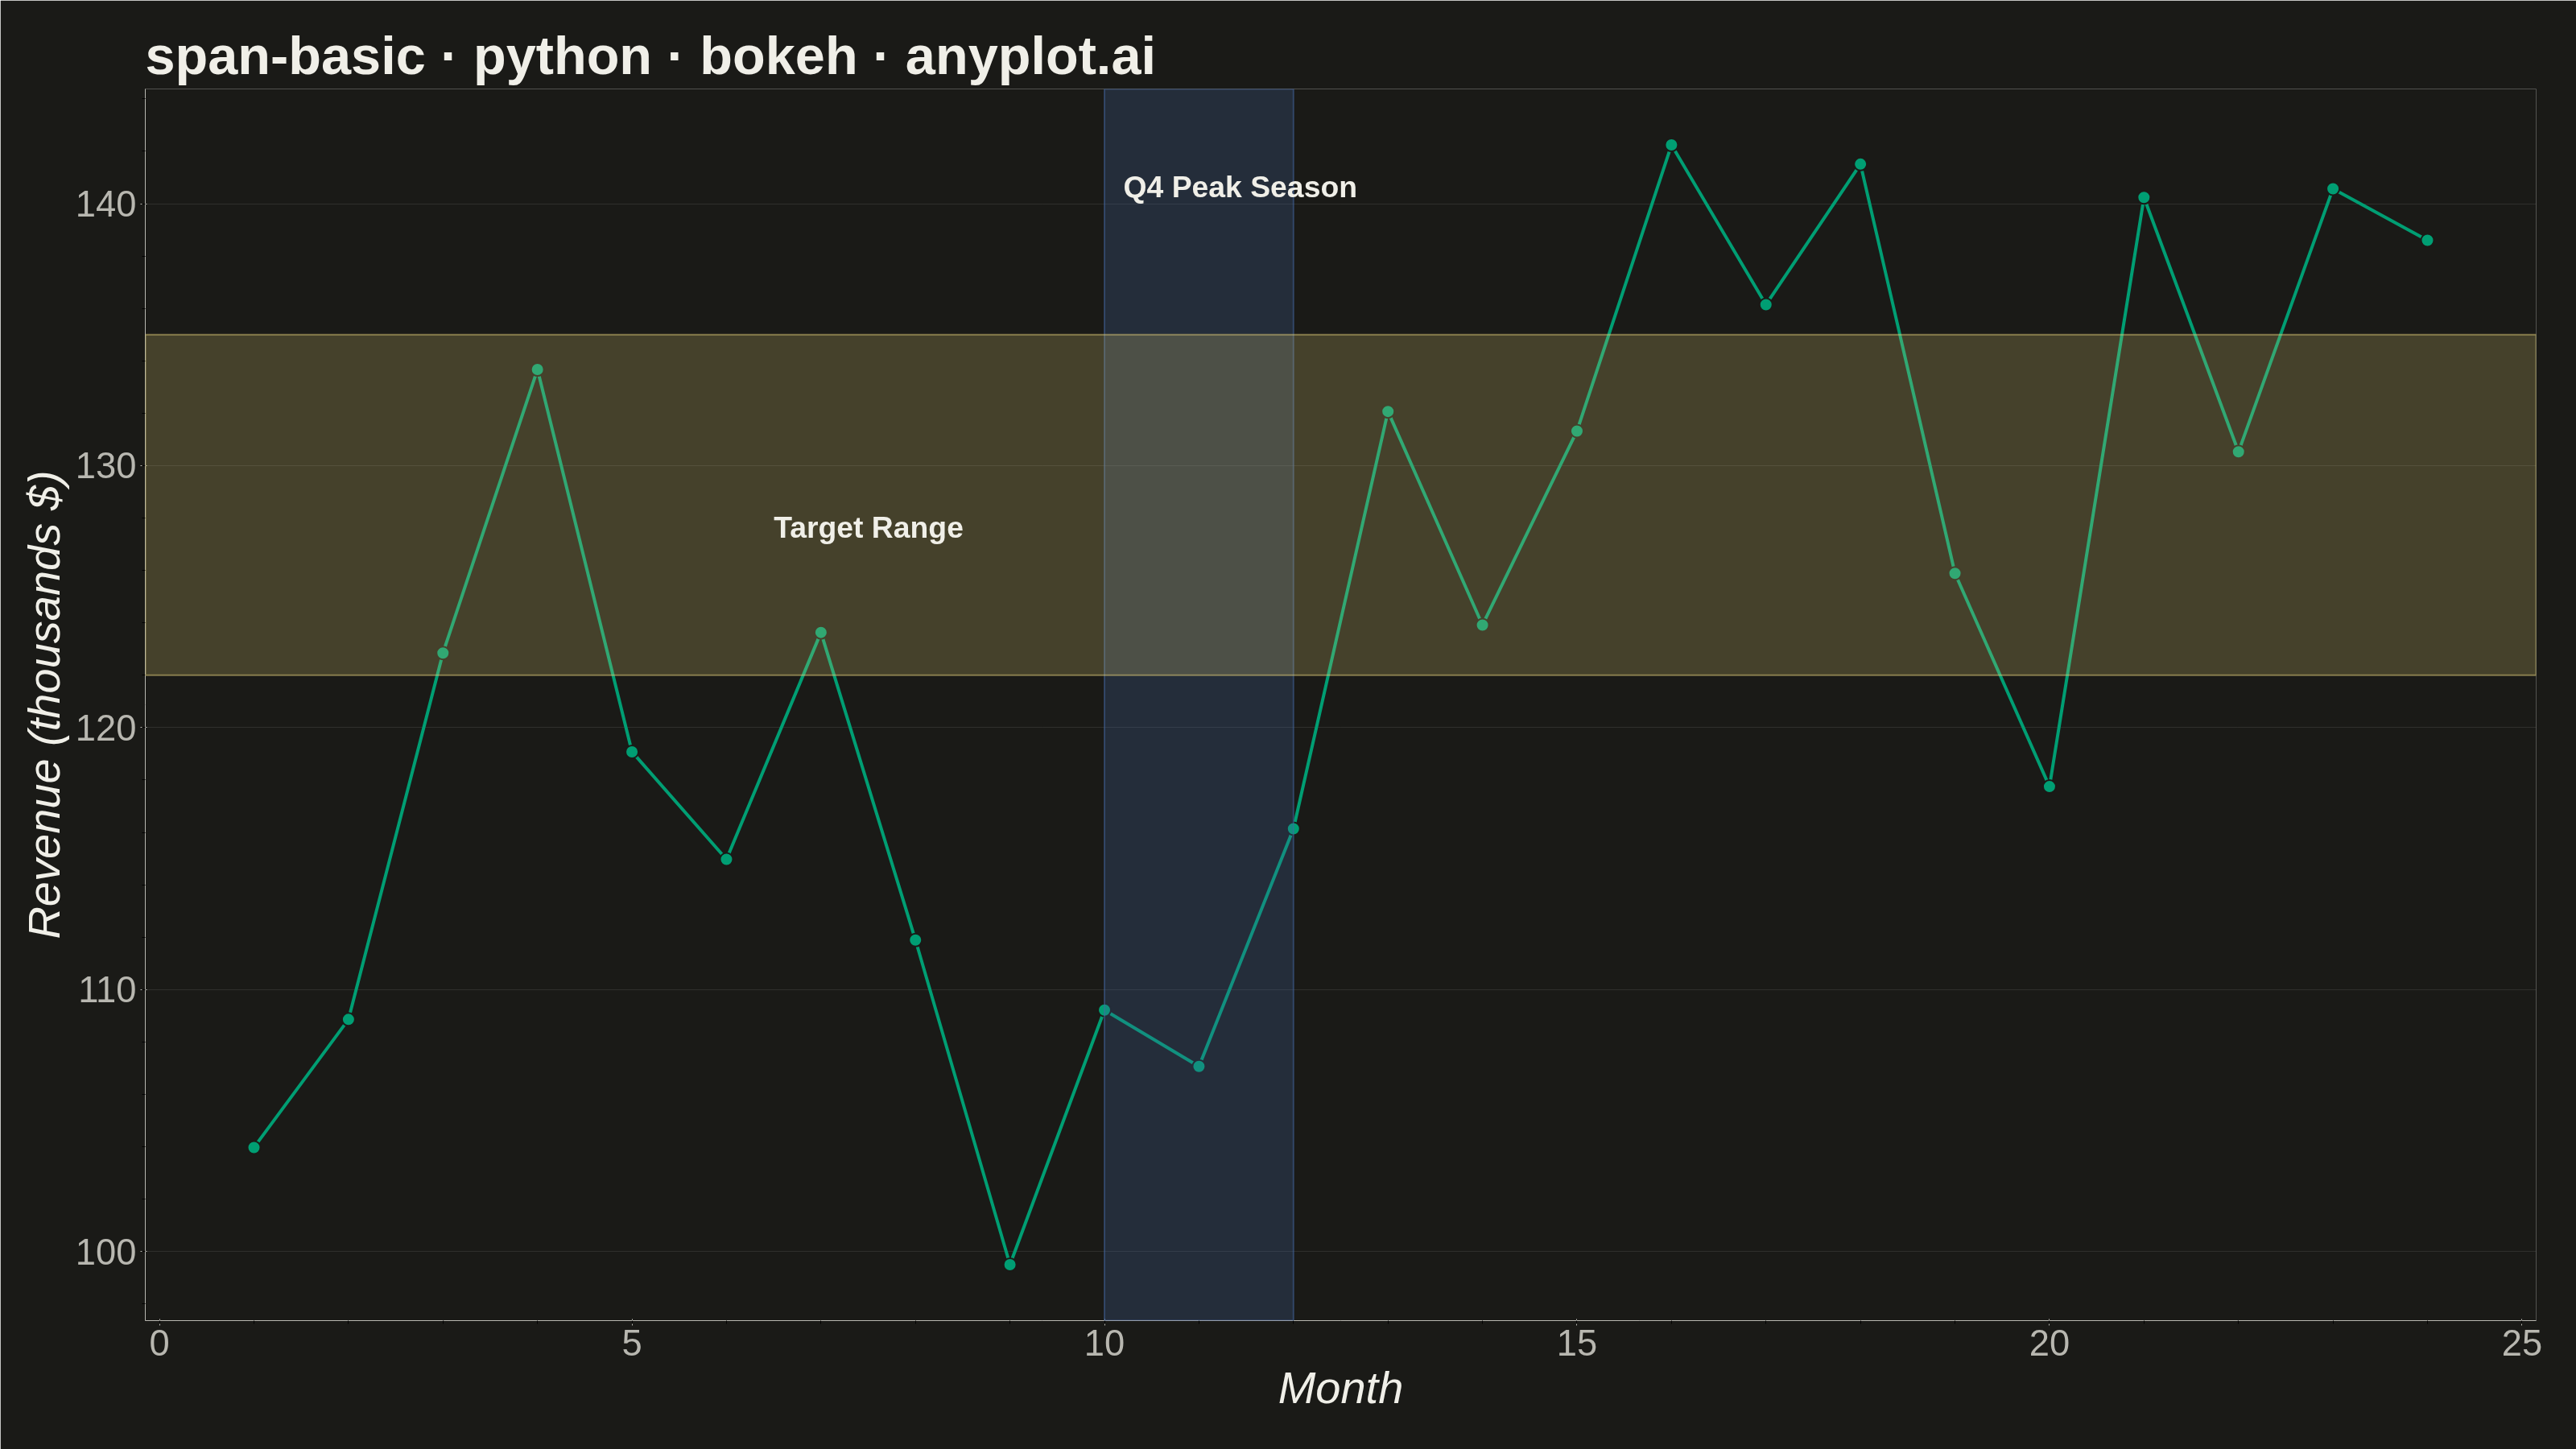
A span plot highlights a specific region of interest on a chart using a shaded rectangular area that spans the full height or width of the plot. Vertical spans mark ranges along the x-axis (e.g., time periods), while horizontal spans mark ranges along the y-axis (e.g., value thresholds). The semi-transparent fill allows underlying data to remain visible while drawing attention to the highlighted region.
Preview render from the Bokeh implementation.