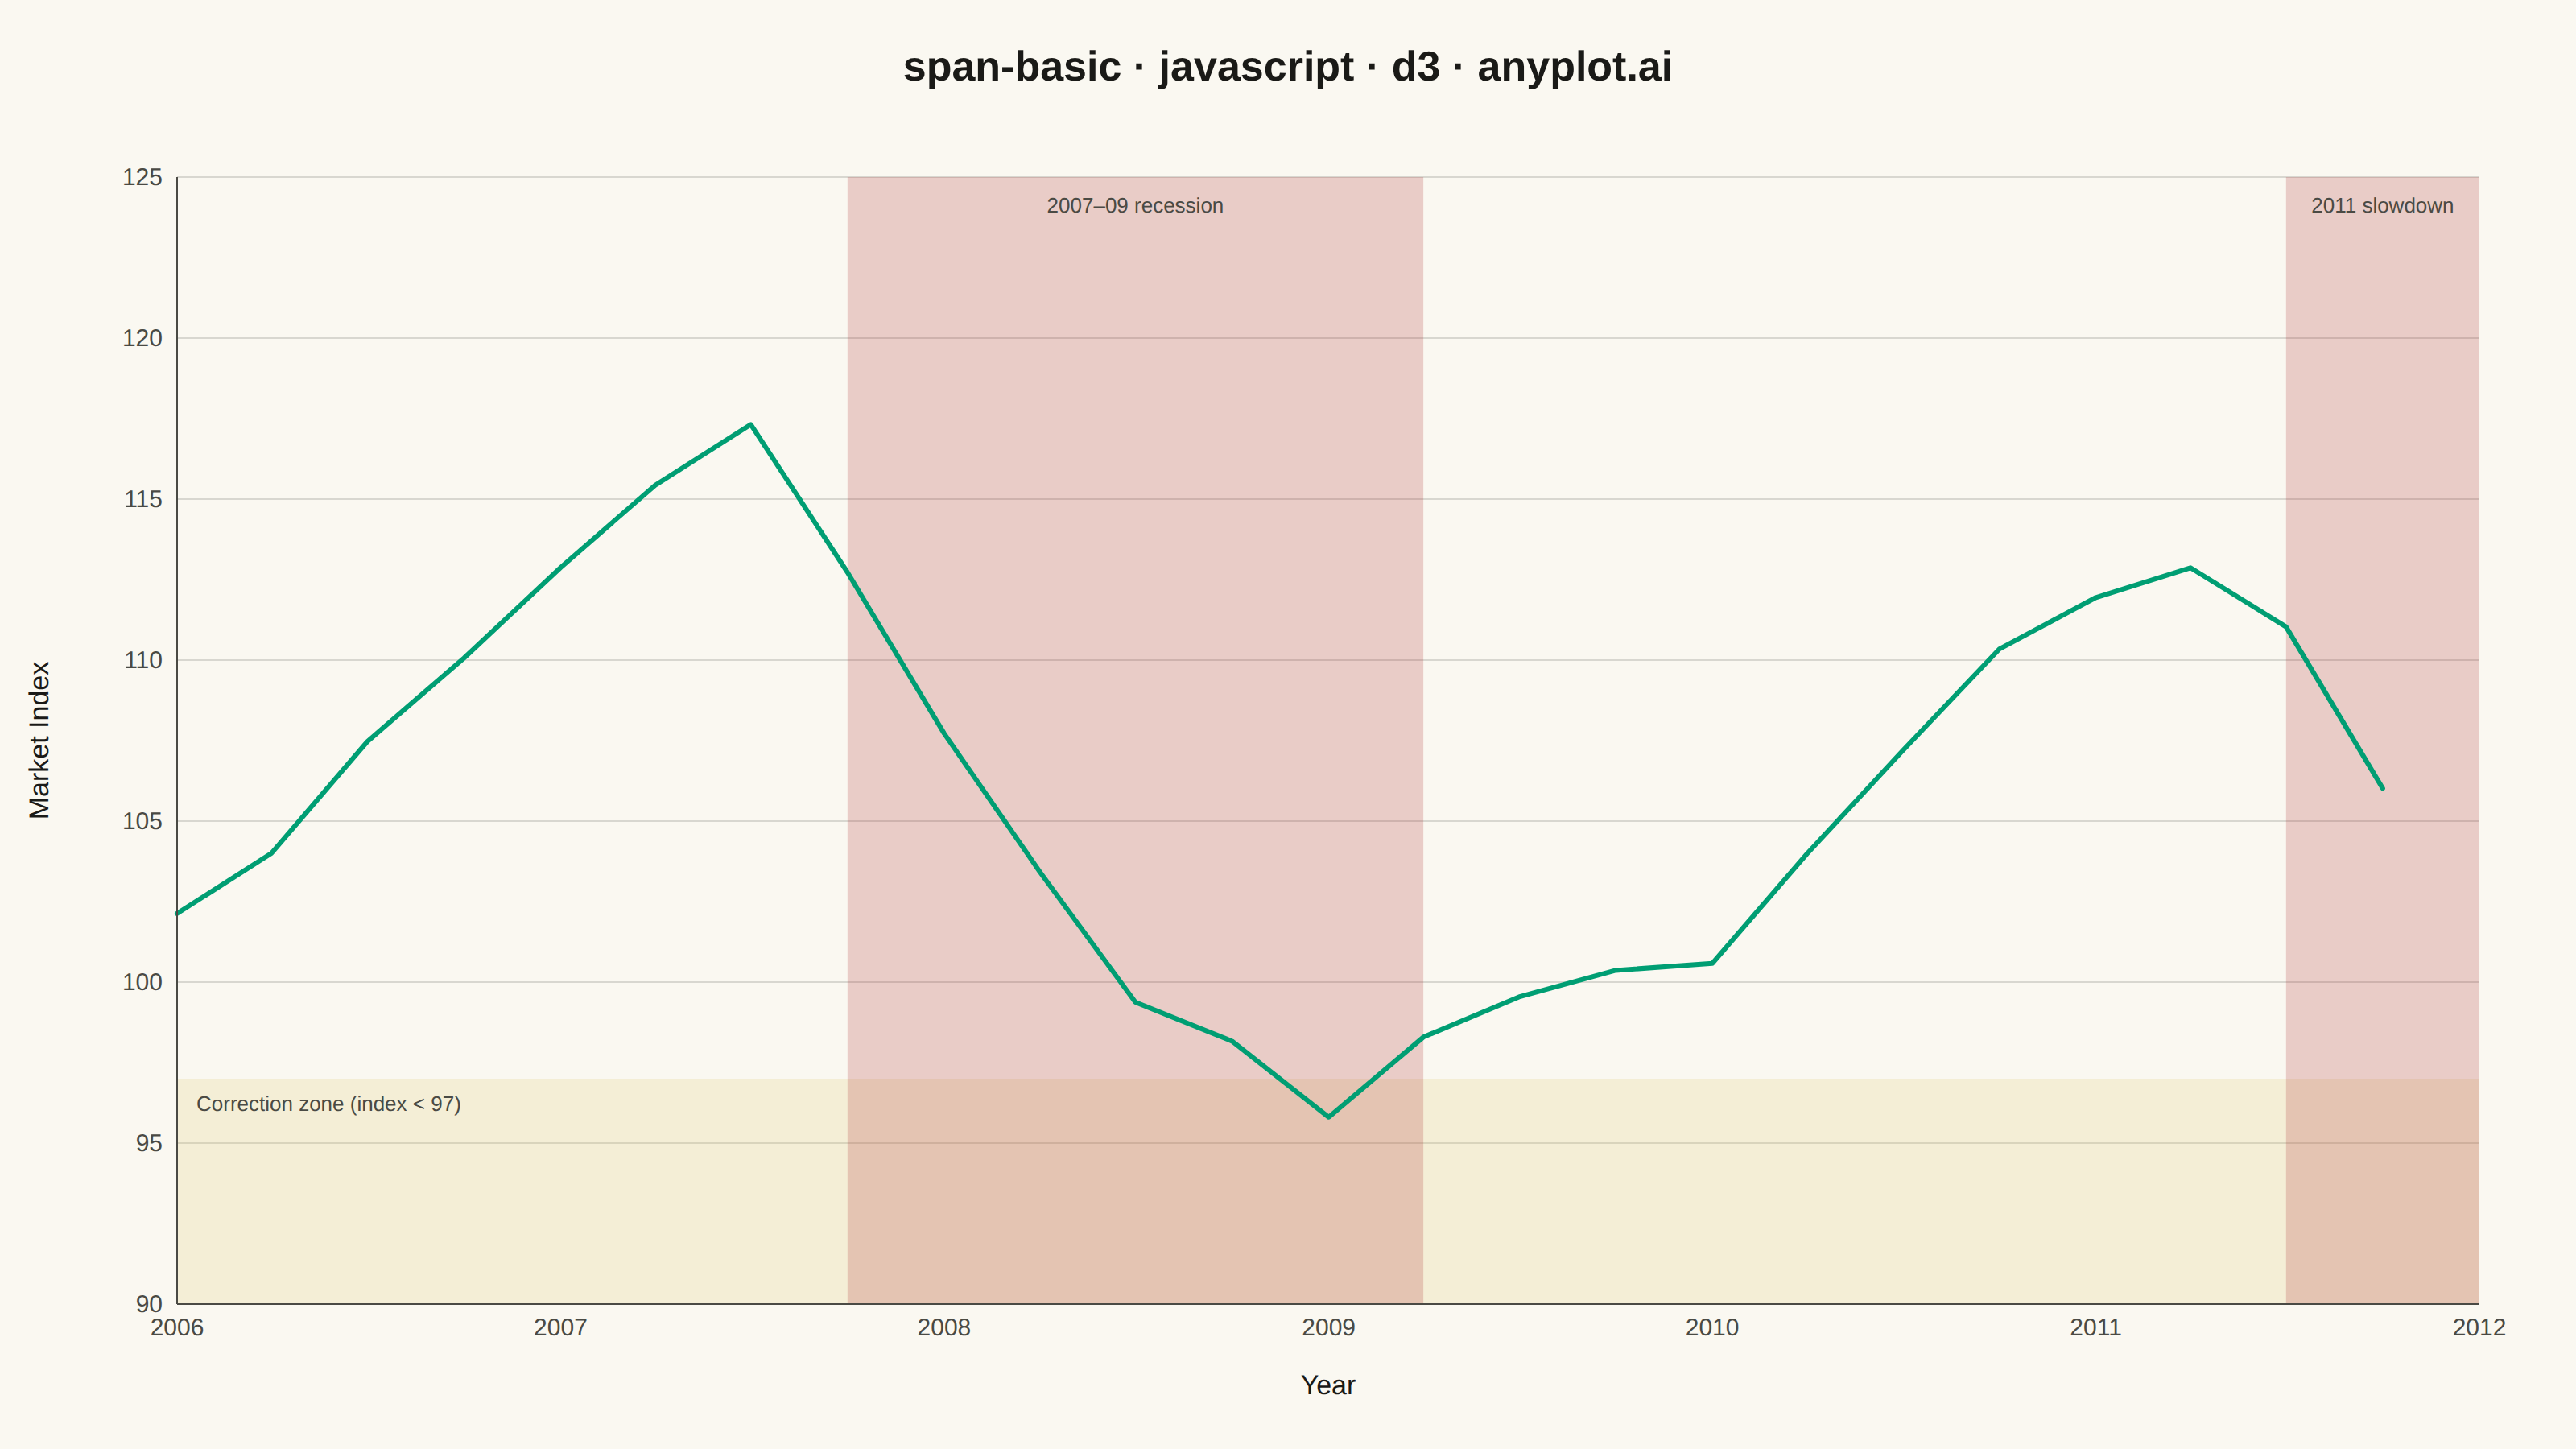
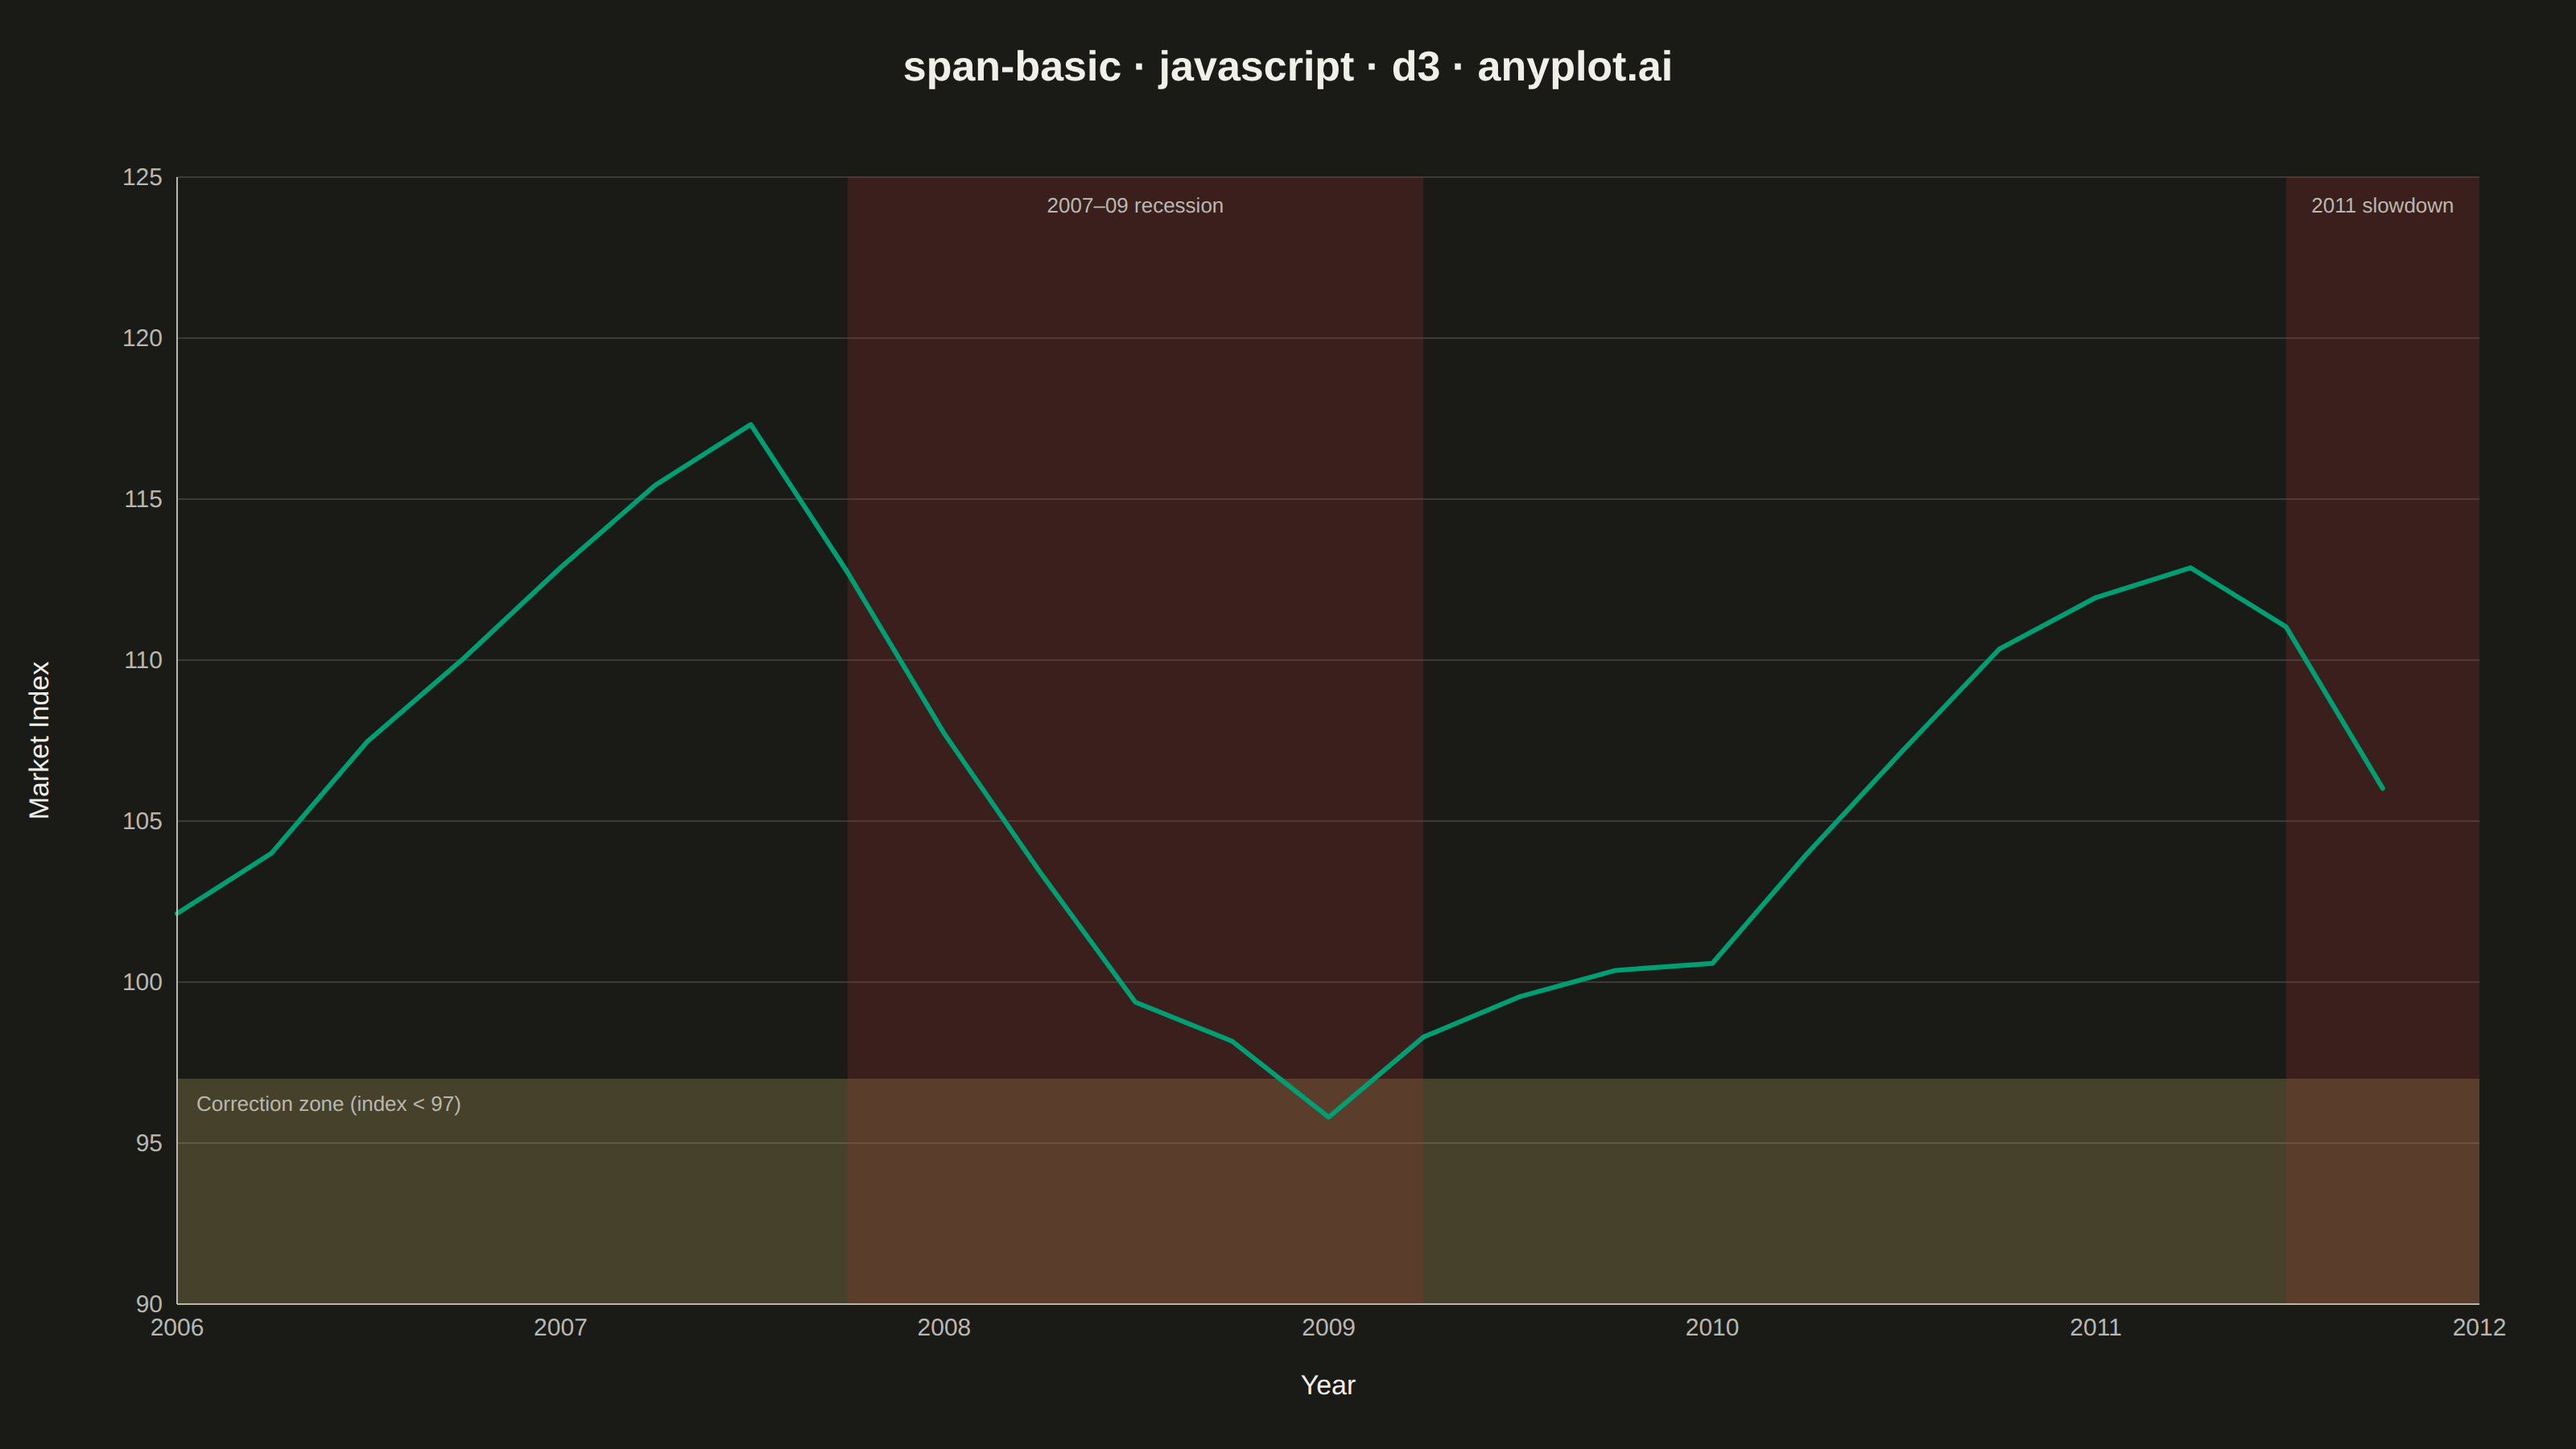
The same plot in 14 other libraries — JavaScript: Chart.js, Apache ECharts, Highcharts, MUI X Charts; Python: Altair, Bokeh, lets-plot, Matplotlib, Plotly, plotnine, Pygal, Seaborn; R: ggplot2; Julia: Makie.jl. Compare all 15 side by side: Basic Span Plot (Highlighted Region) in Python, R, Julia and JavaScript.
A span plot highlights a specific region of interest on a chart using a shaded rectangular area that spans the full height or width of the plot. Vertical spans mark ranges along the x-axis (e.g., time periods), while horizontal spans mark ranges along the y-axis (e.g., value thresholds). The semi-transparent fill allows underlying data to remain visible while drawing attention to the highlighted region.
// anyplot.ai
// span-basic: Basic Span Plot (Highlighted Region)
// Library: d3 7.9.0 | JavaScript 22.23.1
// Quality: 91/100 | Created: 2026-07-25

const t = window.ANYPLOT_TOKENS;
const { width, height } = window.ANYPLOT_SIZE;
const margin = { top: 110, right: 60, bottom: 90, left: 110 };
const iw = width - margin.left - margin.right;
const ih = height - margin.top - margin.bottom;

// --- Data (in-memory, deterministic) ----------------------------------------
// Quarterly stock index level, 2006–2011, with two recession periods marked.
function lcg(seed) {
  let s = seed;
  return () => {
    s = (s * 1103515245 + 12345) & 0x7fffffff;
    return s / 0x7fffffff;
  };
}
const rand = lcg(42);

const quarters = [];
for (let year = 2006; year <= 2011; year++) {
  for (let q = 0; q < 4; q++) quarters.push(new Date(year, q * 3, 1));
}

let level = 100;
const series = quarters.map((date, i) => {
  const inRecession =
    (date >= new Date(2007, 9, 1) && date < new Date(2009, 3, 1)) ||
    (date >= new Date(2011, 6, 1) && date < new Date(2011, 12, 1));
  const drift = inRecession ? -3.2 : 1.8;
  level += drift + (rand() - 0.5) * 4;
  level = Math.max(level, 55);
  return { date, index: level };
});

const verticalSpans = [
  { start: new Date(2007, 9, 1), end: new Date(2009, 3, 1), label: "2007–09 recession" },
  { start: new Date(2011, 6, 1), end: new Date(2011, 12, 1), label: "2011 slowdown" },
];

// A horizontal span demonstrates the spec's other direction: a fixed value-threshold
// "correction zone" band, independent of x, spanning the full plot width.
const horizontalSpans = [{ start: 60, end: 97, label: "Correction zone (index < 97)" }];

// --- SVG mount ---------------------------------------------------------------
const svg = d3.select("#container").append("svg").attr("width", width).attr("height", height);
const g = svg.append("g").attr("transform", `translate(${margin.left},${margin.top})`);

// --- Scales --------------------------------------------------------------------
// Domain covers both the series dates and every vertical span's start/end so a span
// that extends past the last data point never extrapolates past the plotted x-axis.
const x = d3
  .scaleTime()
  .domain(d3.extent([...series.map((d) => d.date), ...verticalSpans.flatMap((s) => [s.start, s.end])]))
  .range([0, iw]);
const y = d3
  .scaleLinear()
  .domain([d3.min(series, (d) => d.index) * 0.95, d3.max(series, (d) => d.index) * 1.05])
  .nice()
  .range([ih, 0]);

// --- Gridlines (y-axis only) ---------------------------------------------------
g.append("g")
  .selectAll("line")
  .data(y.ticks(6))
  .join("line")
  .attr("x1", 0)
  .attr("x2", iw)
  .attr("y1", (d) => y(d))
  .attr("y2", (d) => y(d))
  .attr("stroke", t.grid)
  .attr("stroke-width", 1);

// --- Horizontal span (drawn beneath everything) — value-threshold band ----------
const hSpanColor = t.amber; // amber — semantic anchor for warning/caution thresholds
g.selectAll(".hspan")
  .data(horizontalSpans)
  .join("rect")
  .attr("class", "hspan")
  .attr("x", 0)
  .attr("y", (d) => Math.max(y(d.end), 0))
  .attr("width", iw)
  .attr("height", (d) => Math.min(y(d.start), ih) - Math.max(y(d.end), 0))
  .attr("fill", hSpanColor)
  .attr("opacity", 0.22);

g.selectAll(".hspan-label")
  .data(horizontalSpans)
  .join("text")
  .attr("class", "hspan-label")
  .attr("x", 12)
  .attr("y", (d) => Math.max(y(d.end), 0) + 20)
  .attr("text-anchor", "start")
  .attr("fill", t.inkSoft)
  .style("font-size", "13px")
  .style("font-weight", "500")
  .text((d) => d.label);

// --- Vertical spans (drawn beneath the line) ------------------------------------
const spanColor = t.palette[4]; // matte red — semantic anchor for downturn periods
g.selectAll(".span")
  .data(verticalSpans)
  .join("rect")
  .attr("class", "span")
  .attr("x", (d) => x(d.start))
  .attr("y", 0)
  .attr("width", (d) => x(d.end) - x(d.start))
  .attr("height", ih)
  .attr("fill", spanColor)
  .attr("opacity", 0.22);

g.selectAll(".span-label")
  .data(verticalSpans)
  .join("text")
  .attr("class", "span-label")
  .attr("x", (d) => x(d.start) + (x(d.end) - x(d.start)) / 2)
  .attr("y", 22)
  .attr("text-anchor", "middle")
  .attr("fill", t.inkSoft)
  .style("font-size", "13px")
  .style("font-weight", "500")
  .text((d) => d.label);

// --- Line (drawn above the spans) -----------------------------------------------
const line = d3
  .line()
  .x((d) => x(d.date))
  .y((d) => y(d.index));

g.append("path")
  .datum(series)
  .attr("fill", "none")
  .attr("stroke", t.palette[0])
  .attr("stroke-width", 3)
  .attr("stroke-linejoin", "round")
  .attr("stroke-linecap", "round")
  .attr("d", line);

// --- Axes -------------------------------------------------------------------
const xAxis = g
  .append("g")
  .attr("transform", `translate(0,${ih})`)
  .call(d3.axisBottom(x).ticks(d3.timeYear.every(1)).tickFormat(d3.timeFormat("%Y")).tickSizeOuter(0));
const yAxis = g.append("g").call(d3.axisLeft(y).ticks(6).tickSizeOuter(0));

for (const ax of [xAxis, yAxis]) {
  ax.selectAll("text").attr("fill", t.inkSoft).style("font-size", "15px");
  ax.selectAll("line").attr("stroke", t.inkSoft);
  ax.select(".domain").attr("stroke", t.inkSoft);
}
xAxis.selectAll("line").remove();
yAxis.selectAll("line").remove();

// --- Axis titles --------------------------------------------------------------
g.append("text")
  .attr("x", iw / 2)
  .attr("y", ih + 56)
  .attr("text-anchor", "middle")
  .attr("fill", t.ink)
  .style("font-size", "17px")
  .text("Year");

g.append("text")
  .attr("transform", "rotate(-90)")
  .attr("x", -ih / 2)
  .attr("y", -80)
  .attr("text-anchor", "middle")
  .attr("fill", t.ink)
  .style("font-size", "17px")
  .text("Market Index");

// --- Title ------------------------------------------------------------------
svg
  .append("text")
  .attr("x", width / 2)
  .attr("y", 50)
  .attr("text-anchor", "middle")
  .attr("fill", t.ink)
  .style("font-size", "26px")
  .style("font-weight", "600")
  .text("span-basic · javascript · d3 · anyplot.ai");
Runnable source as JSON, for any HTTP client: https://api.anyplot.ai/specs/span-basic/d3/code. Any spec id and library id listed in llms-full.txt fit the same URL shape; every URL below is complete and callable.
{
  "spec_id": "span-basic",
  "language": "javascript",
  "library": "d3",
  "page": "https://anyplot.ai/span-basic/javascript/d3",
  "hub": "https://anyplot.ai/span-basic",
  "code_json": "https://api.anyplot.ai/specs/span-basic/d3/code",
  "spec_json": "https://api.anyplot.ai/specs/span-basic",
  "render_light_png": "https://storage.googleapis.com/anyplot-images/plots/span-basic/javascript/d3/plot-light.png",
  "render_dark_png": "https://storage.googleapis.com/anyplot-images/plots/span-basic/javascript/d3/plot-dark.png",
  "interactive_light_html": "https://storage.googleapis.com/anyplot-images/plots/span-basic/javascript/d3/plot-light.html",
  "interactive_dark_html": "https://storage.googleapis.com/anyplot-images/plots/span-basic/javascript/d3/plot-dark.html",
  "quality_score": 91.0,
  "license": "MIT",
  "guide": "https://anyplot.ai/llms.txt"
}
Part of Basic Span Plot (Highlighted Region) on anyplot.ai.