The same plot in 14 other libraries — JavaScript: D3.js, Apache ECharts, Highcharts, MUI X Charts; Python: Altair, Bokeh, lets-plot, Matplotlib, Plotly, plotnine, Pygal, Seaborn; R: ggplot2; Julia: Makie.jl. Compare all 15 side by side: Basic Span Plot (Highlighted Region) in Python, R, Julia and JavaScript.
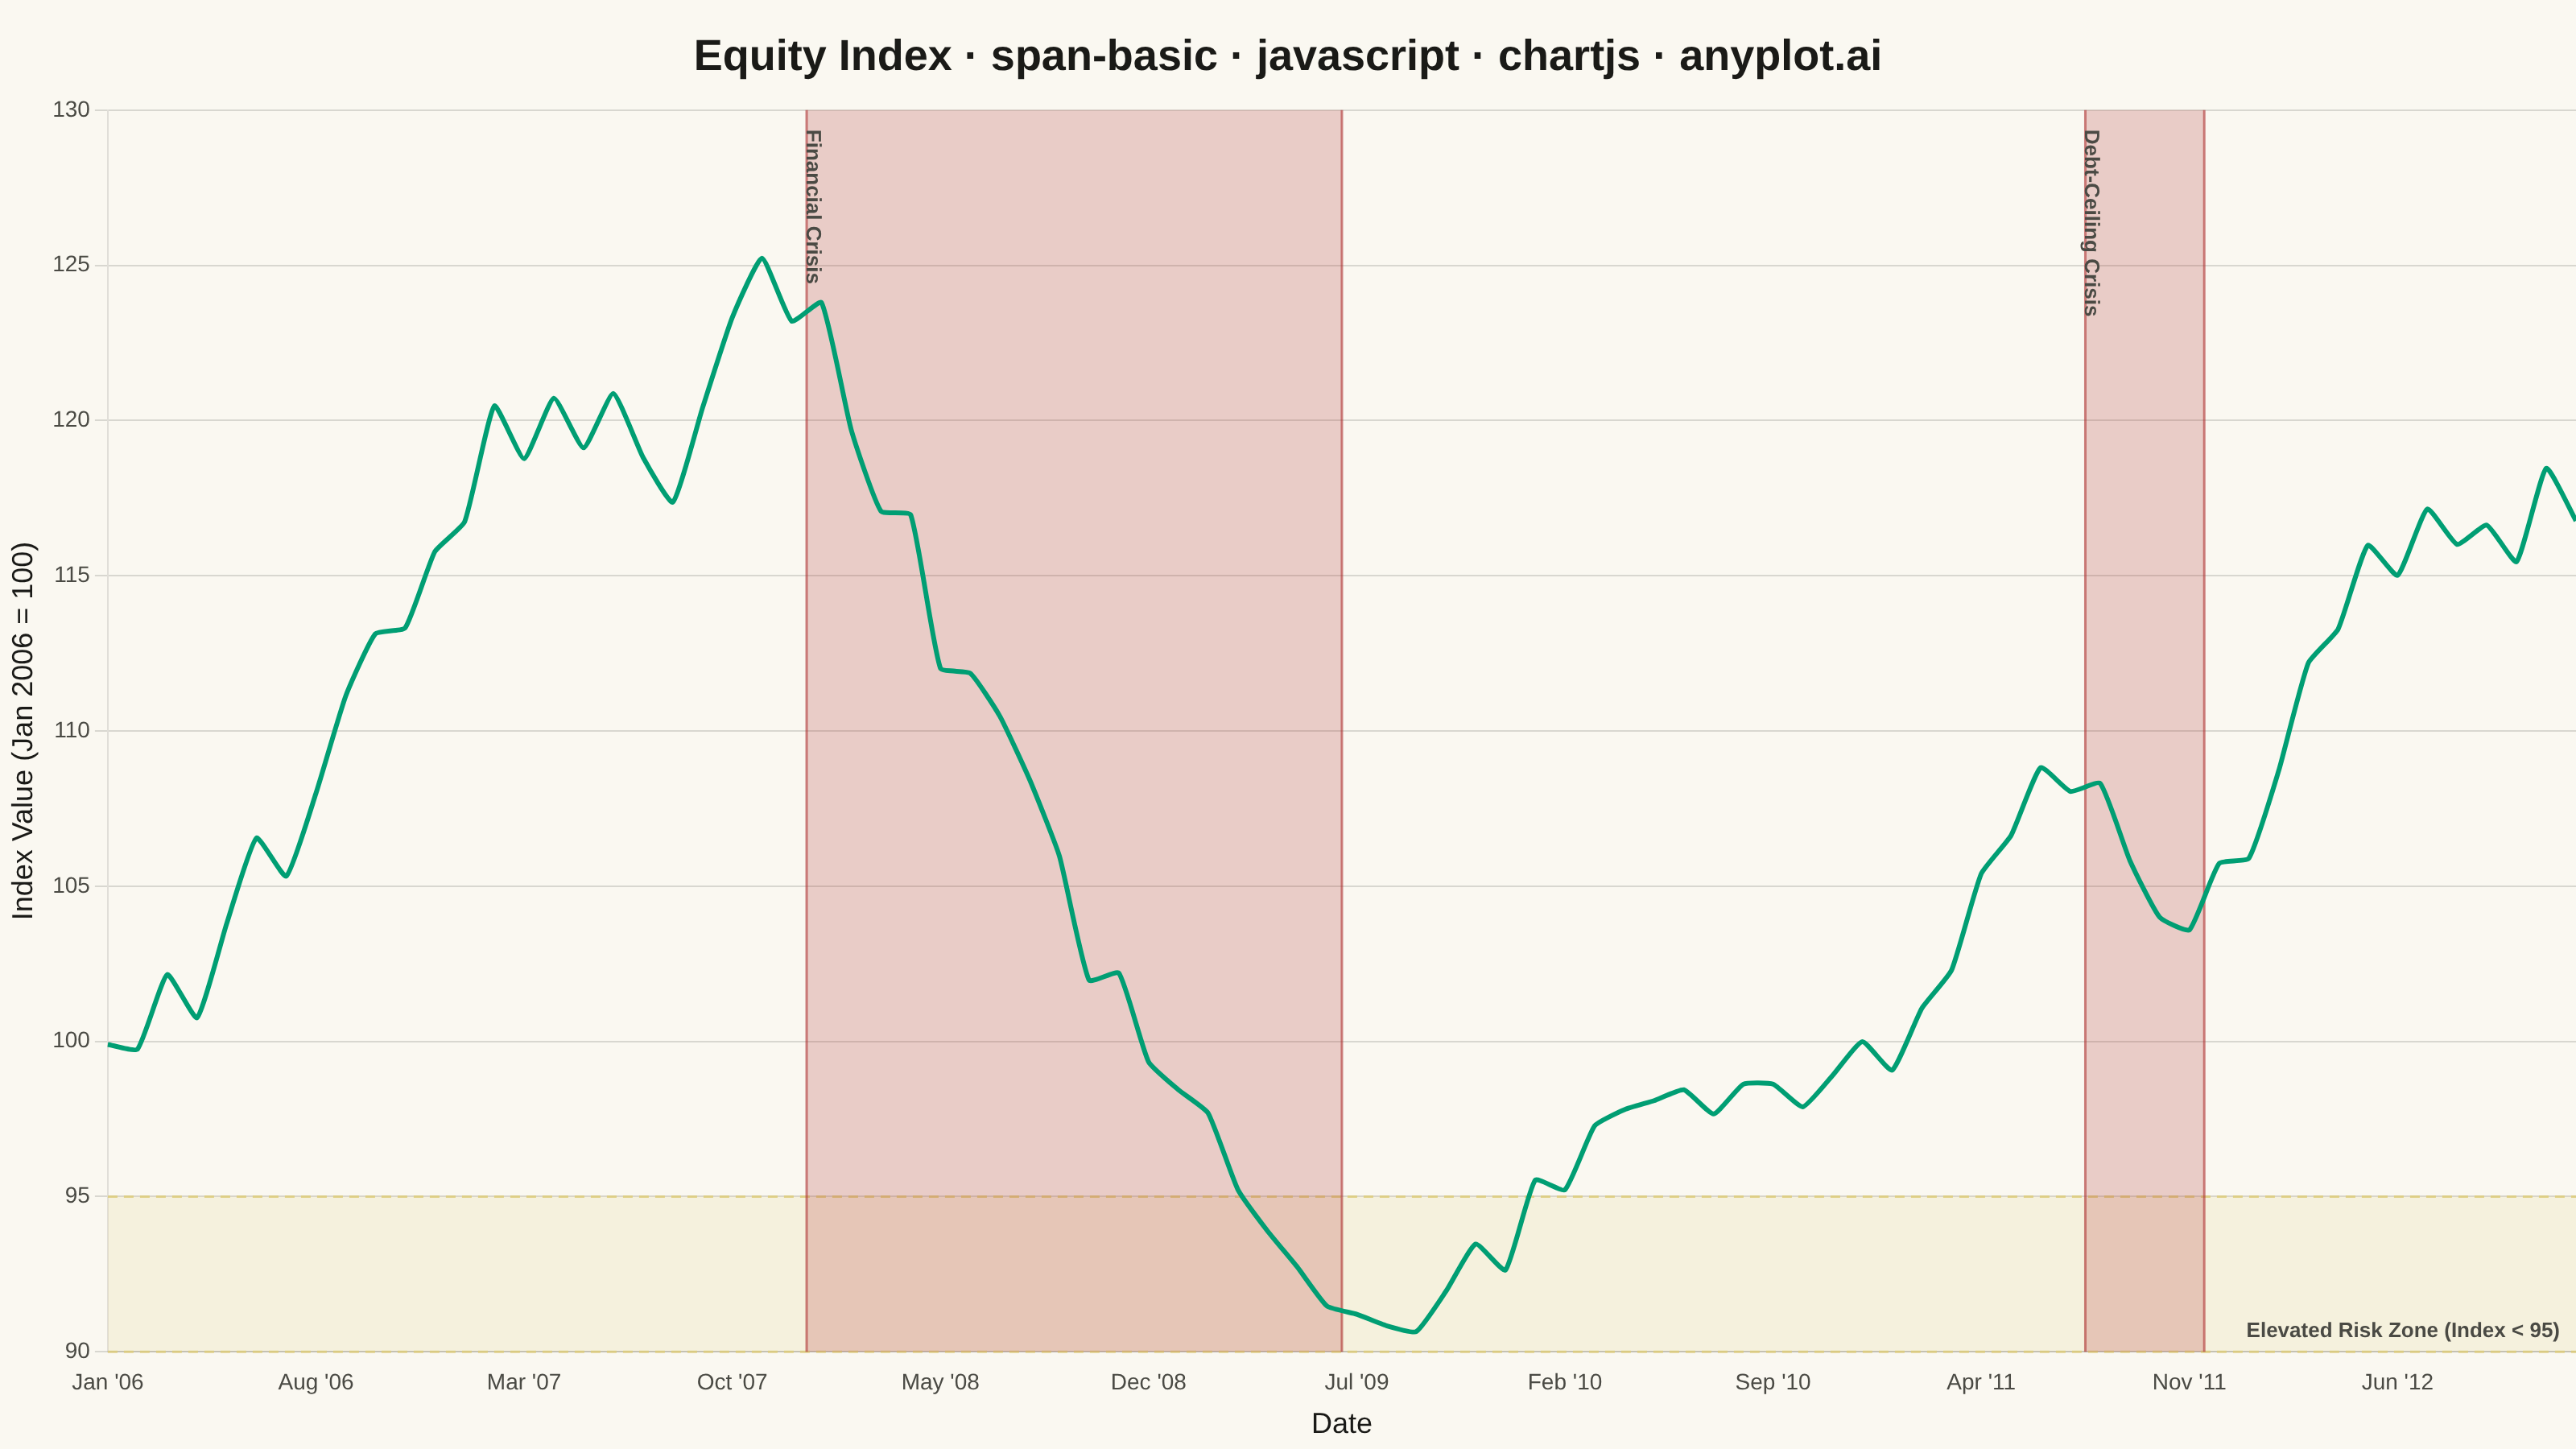
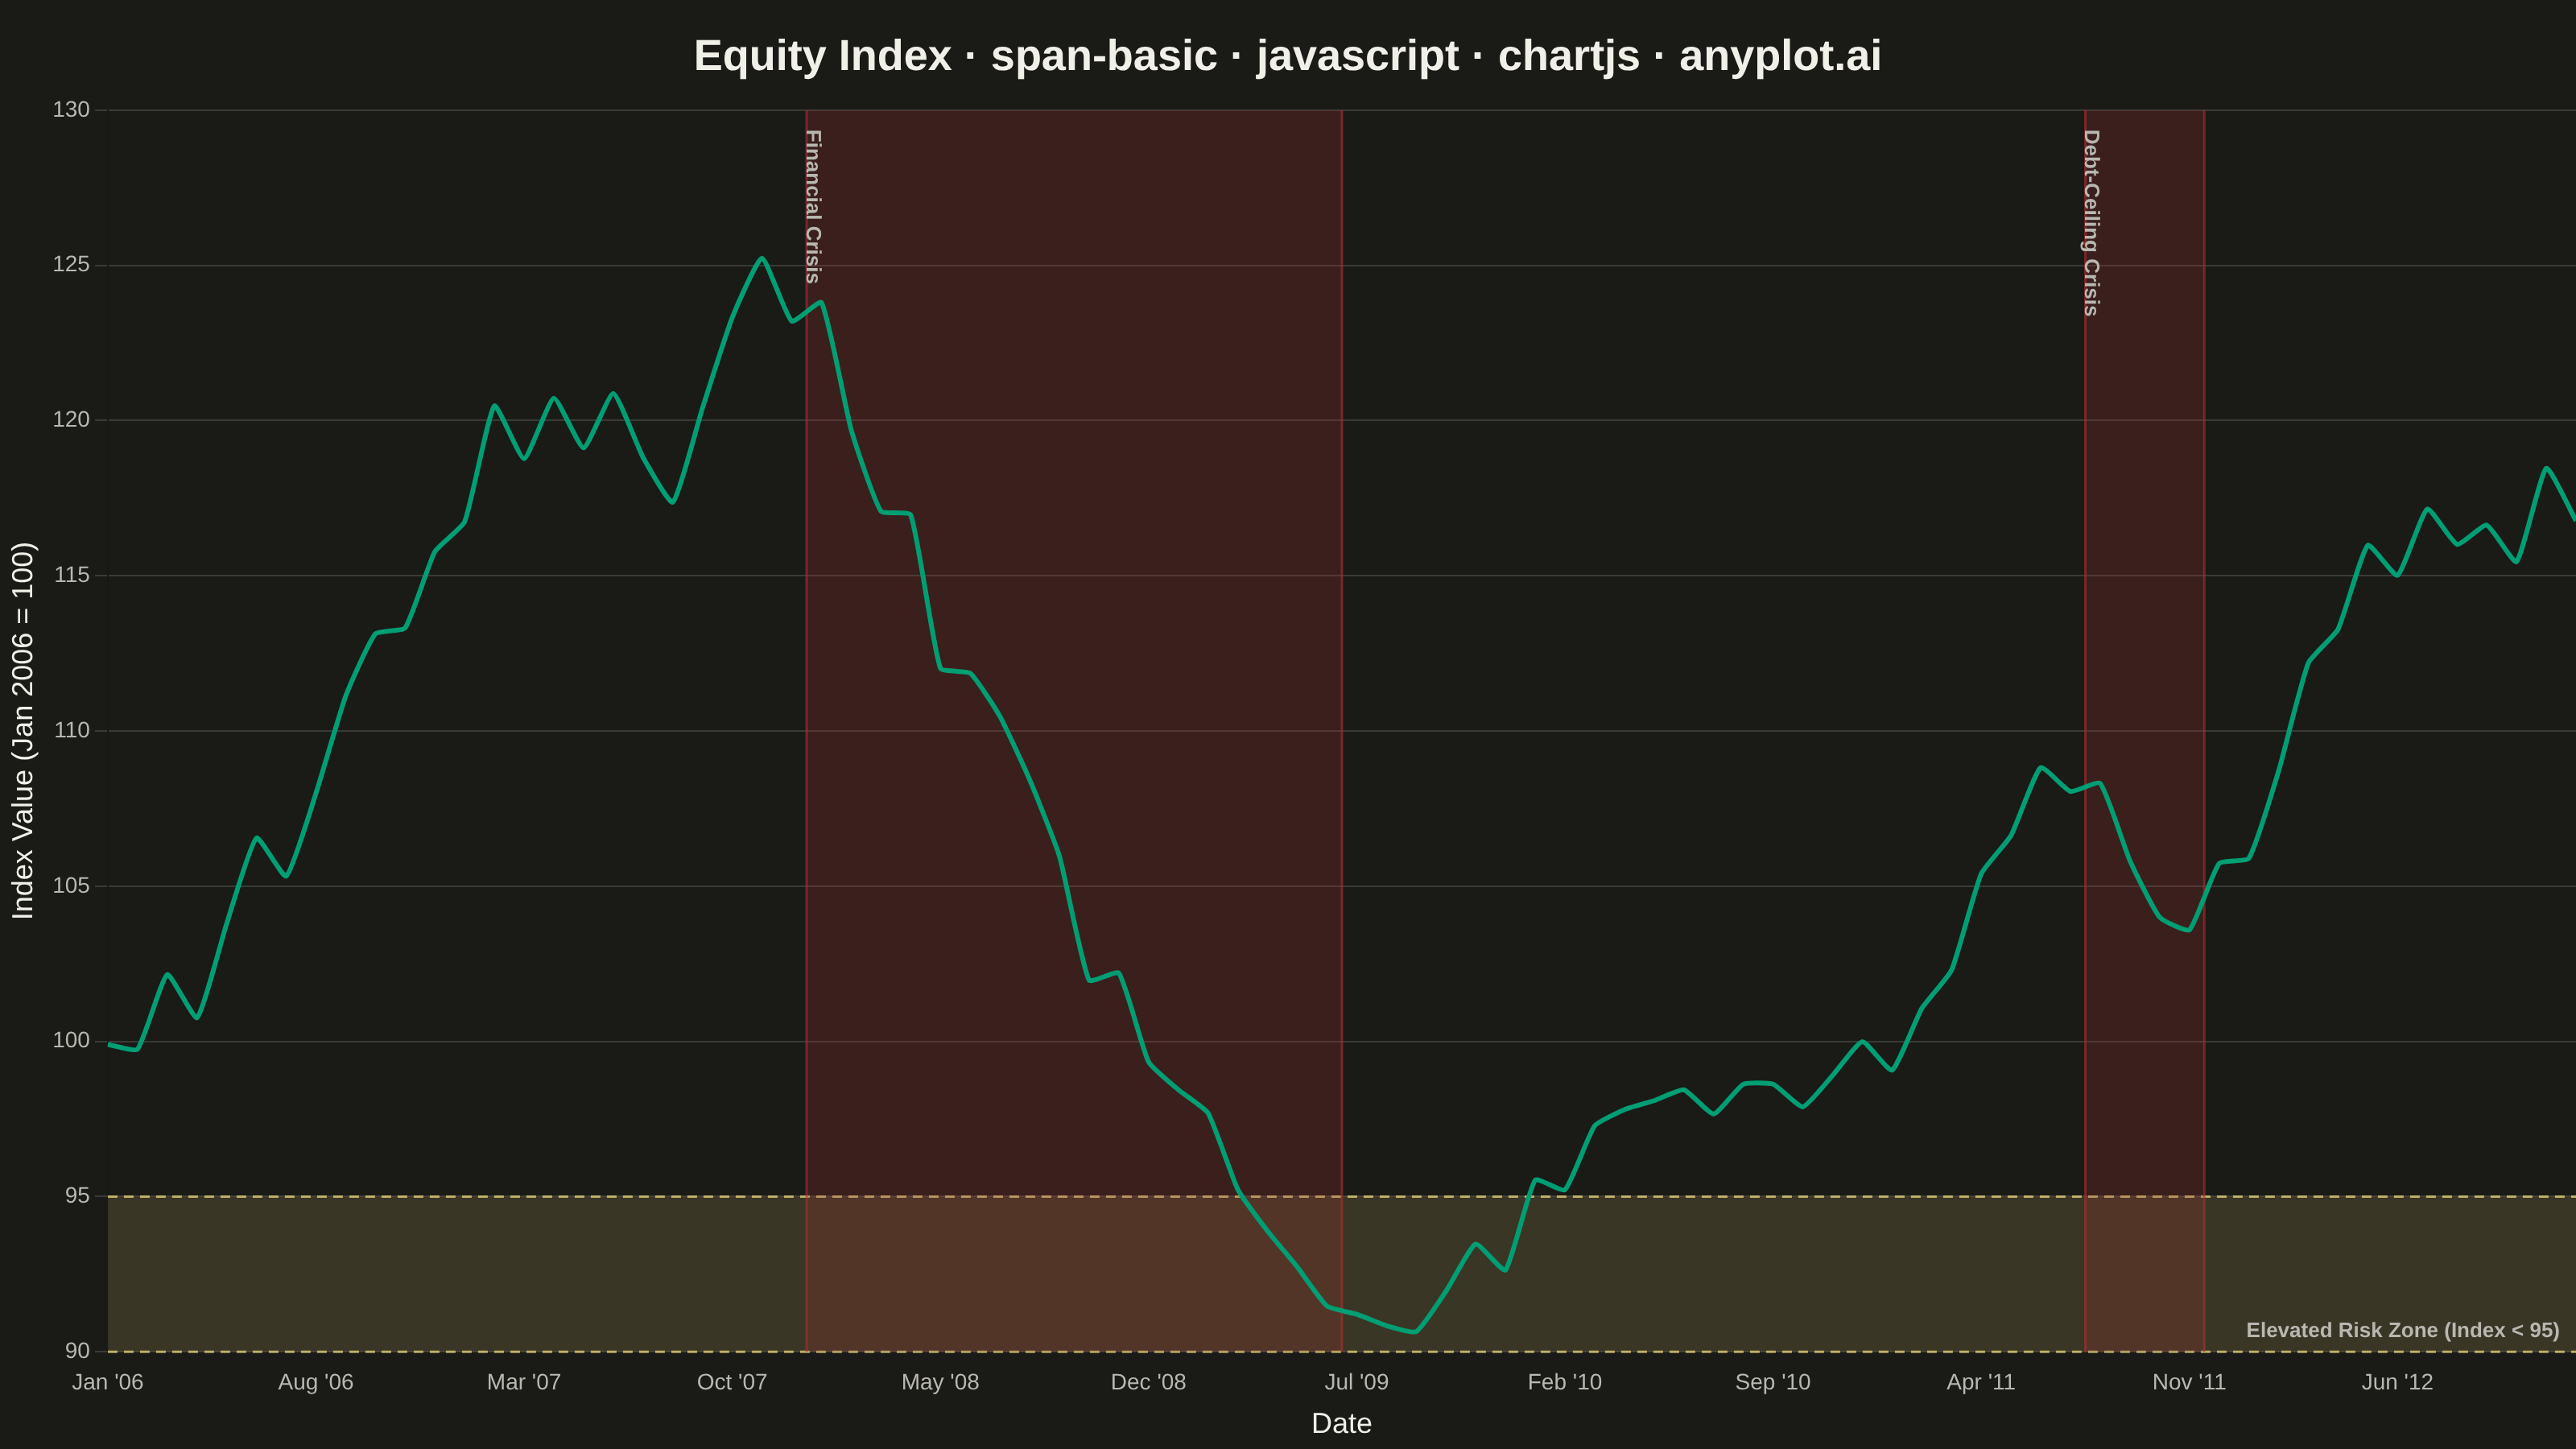
A span plot highlights a specific region of interest on a chart using a shaded rectangular area that spans the full height or width of the plot. Vertical spans mark ranges along the x-axis (e.g., time periods), while horizontal spans mark ranges along the y-axis (e.g., value thresholds). The semi-transparent fill allows underlying data to remain visible while drawing attention to the highlighted region.
// anyplot.ai
// span-basic: Basic Span Plot (Highlighted Region)
// Library: chartjs 4.4.7 | JavaScript 22.23.1
// Quality: 92/100 | Created: 2026-07-25

const t = window.ANYPLOT_TOKENS;

function hexToRgba(hex, alpha) {
  const r = parseInt(hex.slice(1, 3), 16);
  const g = parseInt(hex.slice(3, 5), 16);
  const b = parseInt(hex.slice(5, 7), 16);
  return `rgba(${r}, ${g}, ${b}, ${alpha})`;
}

// Tiny fixed-seed LCG — the browser has no seeded RNG
function lcg(seed) {
  let state = seed >>> 0;
  return () => {
    state = (Math.imul(state, 1664525) + 1013904223) >>> 0;
    return state / 4294967296;
  };
}
const rand = lcg(20260725);

// --- Data: illustrative equity index, monthly, 2006-2012 -------------------
const MONTH_NAMES = ["Jan", "Feb", "Mar", "Apr", "May", "Jun", "Jul", "Aug", "Sep", "Oct", "Nov", "Dec"];
const START_YEAR = 2006;
const MONTHS = 84; // Jan 2006 - Dec 2012

// Two vertical spans: recession periods marking market downturns
const verticalSpans = [
  { startIdx: 24, endIdx: 41, label: "Financial Crisis" }, // Jan 2008 - Jun 2009
  { startIdx: 67, endIdx: 70, label: "Debt-Ceiling Crisis" }, // Aug 2011 - Nov 2011
];
const inAnySpan = (i) => verticalSpans.some((s) => i >= s.startIdx && i <= s.endIdx);

// One horizontal span: an index-value threshold band (the "horizontal" direction).
// The upper bound sits just above the deepest crisis dip so the line visibly
// enters the zone during the Financial Crisis, tying the two directions together.
const horizontalSpans = [{ startVal: 70, endVal: 95, label: "Elevated Risk Zone (Index < 95)" }];

const labels = [];
const indexValues = [];
let index = 100;
for (let i = 0; i < MONTHS; i++) {
  const year = START_YEAR + Math.floor(i / 12);
  labels.push(`${MONTH_NAMES[i % 12]} '${String(year).slice(2)}`);

  const drift = inAnySpan(i) ? -0.018 : 0.0075;
  const noise = (rand() - 0.5) * 0.05;
  index *= 1 + drift + noise;
  indexValues.push(Math.round(index * 100) / 100);
}

// --- Mount -------------------------------------------------------------
const canvas = document.createElement("canvas");
document.getElementById("container").appendChild(canvas);

// Inline plugin: shade the crisis periods (vertical) and the risk-zone threshold
// (horizontal) behind the line, covering both `direction` values from the spec.
// Drawn in beforeDatasetsDraw so the line renders on top of the fills.
const spanHighlight = {
  id: "spanHighlight",
  beforeDatasetsDraw(chart) {
    const { ctx, chartArea, scales } = chart;
    const xScale = scales.x;
    const yScale = scales.y;
    const step = xScale.getPixelForValue(1) - xScale.getPixelForValue(0);
    const half = step / 2;

    ctx.save();

    // Horizontal span first (full width, thin band) so the vertical spans stay
    // the visually dominant fill where the two overlap.
    const amberFill = hexToRgba(t.amber, 0.16);
    const amberEdge = hexToRgba(t.amber, 0.8);
    horizontalSpans.forEach((span) => {
      // Clamp to the plot area: the band's outer edge may fall outside the
      // auto-scaled axis range, but the fill must never bleed past the frame.
      const top = Math.max(chartArea.top, yScale.getPixelForValue(span.endVal));
      const bottom = Math.min(chartArea.bottom, yScale.getPixelForValue(span.startVal));

      ctx.fillStyle = amberFill;
      ctx.fillRect(chartArea.left, top, chartArea.right - chartArea.left, bottom - top);

      // Dashed edges distinguish the threshold band from the solid-edged crisis spans.
      ctx.strokeStyle = amberEdge;
      ctx.lineWidth = 1.5;
      ctx.setLineDash([6, 4]);
      ctx.beginPath();
      ctx.moveTo(chartArea.left, top);
      ctx.lineTo(chartArea.right, top);
      ctx.moveTo(chartArea.left, bottom);
      ctx.lineTo(chartArea.right, bottom);
      ctx.stroke();
      ctx.setLineDash([]);

      ctx.fillStyle = t.inkSoft;
      ctx.font = "600 13px sans-serif";
      ctx.textAlign = "right";
      ctx.textBaseline = "bottom";
      ctx.fillText(span.label, chartArea.right - 10, bottom - 6);
    });

    // Vertical crisis spans, with a solid edge line at each boundary.
    const redFill = hexToRgba(t.palette[4], 0.22); // matte red — semantic anchor for a "bad" period
    const redEdge = hexToRgba(t.palette[4], 0.6);
    verticalSpans.forEach((span) => {
      const left = xScale.getPixelForValue(span.startIdx) - half;
      const right = xScale.getPixelForValue(span.endIdx) + half;

      ctx.fillStyle = redFill;
      ctx.fillRect(left, chartArea.top, right - left, chartArea.bottom - chartArea.top);

      ctx.strokeStyle = redEdge;
      ctx.lineWidth = 1.5;
      ctx.beginPath();
      ctx.moveTo(left, chartArea.top);
      ctx.lineTo(left, chartArea.bottom);
      ctx.moveTo(right, chartArea.top);
      ctx.lineTo(right, chartArea.bottom);
      ctx.stroke();

      ctx.fillStyle = t.inkSoft;
      ctx.font = "600 13px sans-serif";
      ctx.textAlign = "left";
      ctx.textBaseline = "top";
      ctx.save();
      ctx.translate(left + 10, chartArea.top + 12);
      ctx.rotate(Math.PI / 2);
      ctx.fillText(span.label, 0, 0);
      ctx.restore();
    });

    ctx.restore();
  },
};

// --- Chart -----------------------------------------------------------------
const title = "Equity Index · span-basic · javascript · chartjs · anyplot.ai";
const titleFontSize = Math.round(27 * (title.length > 67 ? 67 / title.length : 1));

new Chart(canvas, {
  type: "line",
  plugins: [spanHighlight],
  data: {
    labels,
    datasets: [
      {
        label: "Equity Index",
        data: indexValues,
        borderColor: t.palette[0],
        backgroundColor: "transparent",
        borderWidth: 3,
        pointRadius: 0,
        tension: 0.15,
      },
    ],
  },
  options: {
    responsive: true,
    maintainAspectRatio: false,
    animation: false,
    layout: { padding: { top: 8 } },
    plugins: {
      title: {
        display: true,
        text: title,
        color: t.ink,
        font: { size: titleFontSize },
        padding: { top: 12, bottom: 16 },
      },
      legend: { display: false },
    },
    scales: {
      x: {
        ticks: { color: t.inkSoft, font: { size: 14 }, maxTicksLimit: 12, autoSkip: true },
        grid: { display: false },
        title: { display: true, text: "Date", color: t.ink, font: { size: 18 } },
      },
      y: {
        ticks: { color: t.inkSoft, font: { size: 14 } },
        grid: { color: t.grid },
        title: { display: true, text: "Index Value (Jan 2006 = 100)", color: t.ink, font: { size: 18 } },
      },
    },
  },
});
Runnable source as JSON, for any HTTP client: https://api.anyplot.ai/specs/span-basic/chartjs/code. Any spec id and library id listed in llms-full.txt fit the same URL shape; every URL below is complete and callable.
{
  "spec_id": "span-basic",
  "language": "javascript",
  "library": "chartjs",
  "page": "https://anyplot.ai/span-basic/javascript/chartjs",
  "hub": "https://anyplot.ai/span-basic",
  "code_json": "https://api.anyplot.ai/specs/span-basic/chartjs/code",
  "spec_json": "https://api.anyplot.ai/specs/span-basic",
  "render_light_png": "https://storage.googleapis.com/anyplot-images/plots/span-basic/javascript/chartjs/plot-light.png",
  "render_dark_png": "https://storage.googleapis.com/anyplot-images/plots/span-basic/javascript/chartjs/plot-dark.png",
  "interactive_light_html": "https://storage.googleapis.com/anyplot-images/plots/span-basic/javascript/chartjs/plot-light.html",
  "interactive_dark_html": "https://storage.googleapis.com/anyplot-images/plots/span-basic/javascript/chartjs/plot-dark.html",
  "quality_score": 92.0,
  "license": "MIT",
  "guide": "https://anyplot.ai/llms.txt"
}
Part of Basic Span Plot (Highlighted Region) on anyplot.ai.