The same plot in 14 other libraries — JavaScript: Chart.js, D3.js, Apache ECharts, Highcharts; Python: Altair, Bokeh, lets-plot, Matplotlib, Plotly, plotnine, Pygal, Seaborn; R: ggplot2; Julia: Makie.jl. Compare all 15 side by side: Basic Span Plot (Highlighted Region) in Python, R, Julia and JavaScript.
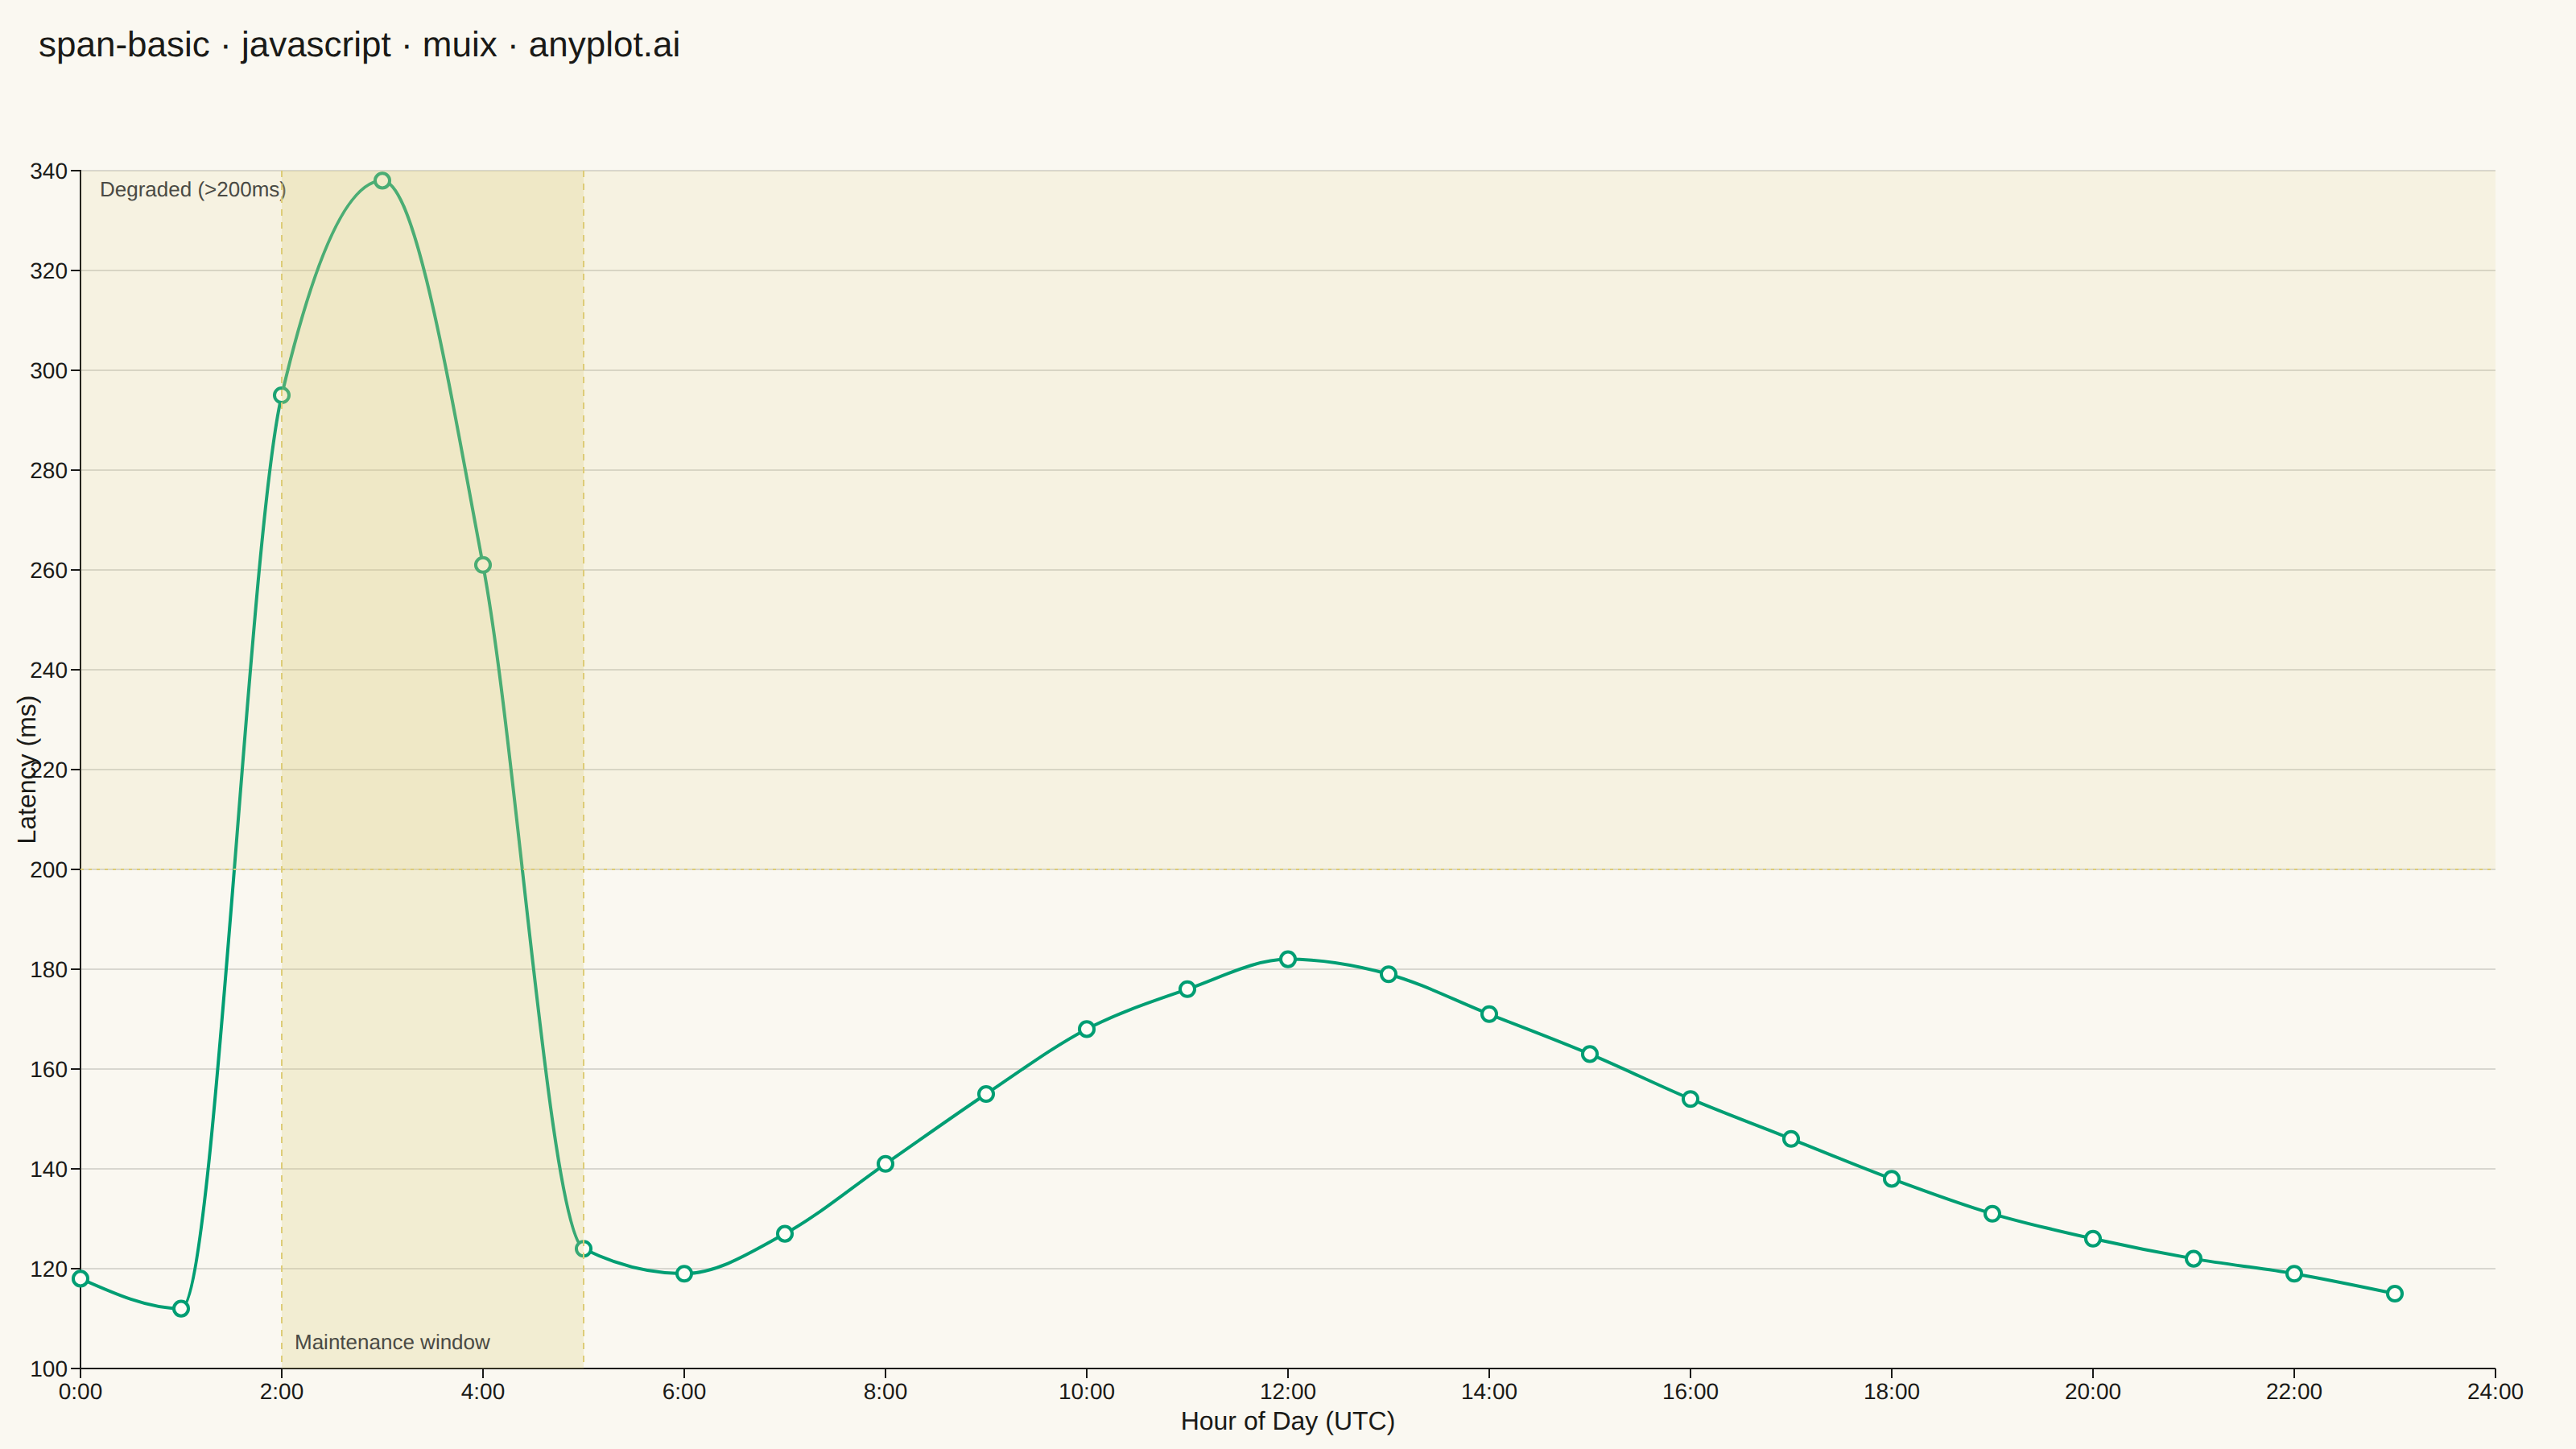
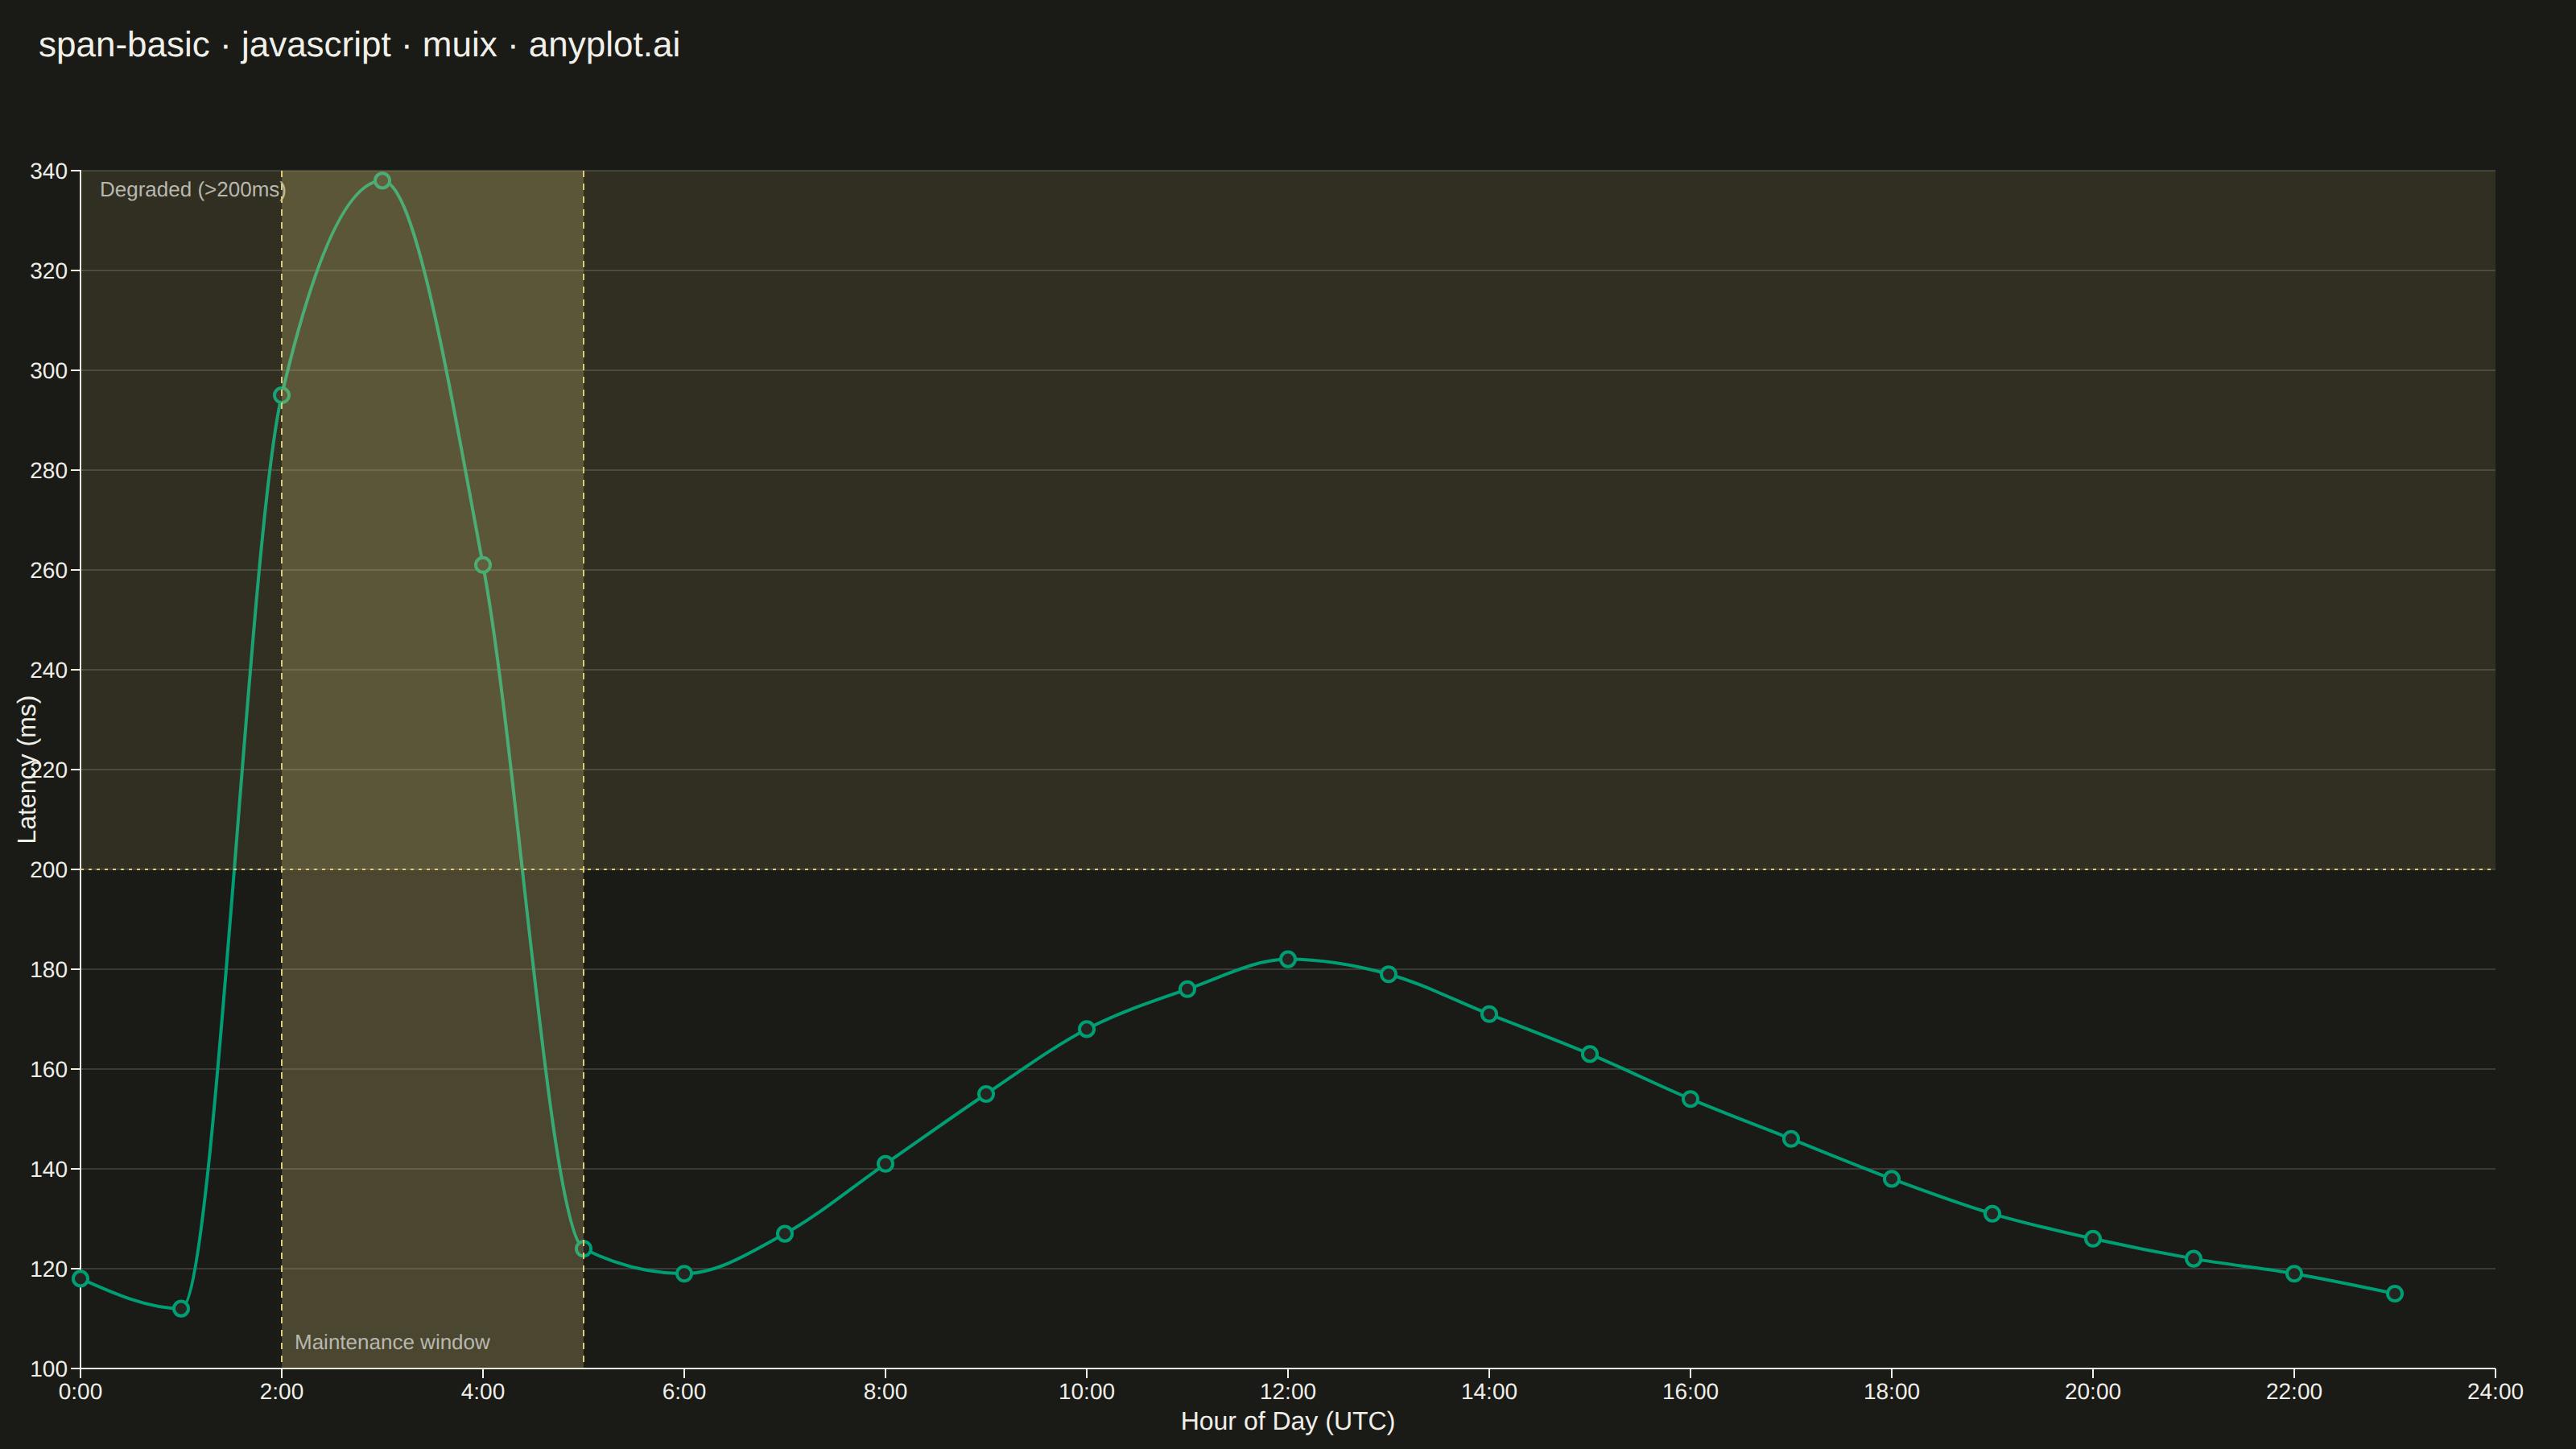
A span plot highlights a specific region of interest on a chart using a shaded rectangular area that spans the full height or width of the plot. Vertical spans mark ranges along the x-axis (e.g., time periods), while horizontal spans mark ranges along the y-axis (e.g., value thresholds). The semi-transparent fill allows underlying data to remain visible while drawing attention to the highlighted region.
// anyplot.ai
// span-basic: Basic Span Plot (Highlighted Region)
// Library: muix 7.29.1 | JavaScript 22.23.1
// Quality: 91/100 | Created: 2026-07-25
import { LineChart } from "@mui/x-charts/LineChart";
import { ChartsReferenceLine } from "@mui/x-charts/ChartsReferenceLine";
import { useDrawingArea, useXScale, useYScale } from "@mui/x-charts/hooks";
const t = window.ANYPLOT_TOKENS;
const TITLE = "span-basic · javascript · muix · anyplot.ai";
const TITLE_HEIGHT = 56;
// --- Data (in-memory, deterministic): hourly API latency over one day -------
const hours = Array.from({ length: 24 }, (_, i) => i);
const latencyMs = [
118, 112, 295, 338, 261, 124, 119, 127, 141, 155, 168, 176, 182, 179, 171,
163, 154, 146, 138, 131, 126, 122, 119, 115,
];
// Overnight maintenance window: reduced capacity drives up response times.
const MAINTENANCE_START = 2;
const MAINTENANCE_END = 5;
// Degraded-latency threshold: values above this are considered SLA breaches.
const DEGRADED_THRESHOLD = 200;
// --- Vertical span highlighting the maintenance window -----------------------
// No ChartsReferenceArea ships in the community package (7.29.1) — a rect
// positioned via the chart's own scale/drawing-area hooks reproduces it while
// staying entirely within the @mui/x-charts community surface.
function MaintenanceSpan() {
const xScale = useXScale();
const { top, height } = useDrawingArea();
const x0 = xScale(MAINTENANCE_START);
const x1 = xScale(MAINTENANCE_END);
const left = Math.min(x0, x1);
const width = Math.abs(x1 - x0);
return (
<g>
<rect
x={left}
y={top}
width={width}
height={height}
fill={t.amber}
fillOpacity={0.25}
/>
<text x={left + 8} y={top + height - 12} fontSize={13} fill={t.inkSoft}>
Maintenance window
</text>
</g>
);
}
// --- Horizontal span highlighting the degraded-latency threshold zone -------
// A second region on the y-axis (spec allows 1-5 spans on either direction)
// showing the value range above the SLA threshold, reusing the same
// hooks-based approach as MaintenanceSpan.
function ThresholdSpan() {
const yScale = useYScale();
const { left, top, width } = useDrawingArea();
const yThreshold = yScale(DEGRADED_THRESHOLD);
const bandTop = Math.min(top, yThreshold);
const bandHeight = Math.abs(yThreshold - top);
return (
<g>
<rect
x={left}
y={bandTop}
width={width}
height={bandHeight}
fill={t.amber}
fillOpacity={0.12}
/>
<text
x={left + 12}
y={bandTop + 16}
fontSize={13}
fill={t.inkSoft}
>
Degraded (>{DEGRADED_THRESHOLD}ms)
</text>
</g>
);
}
export default function Chart() {
const chartHeight = window.ANYPLOT_SIZE.height - TITLE_HEIGHT;
return (
<div
style={{
width: window.ANYPLOT_SIZE.width,
height: window.ANYPLOT_SIZE.height,
}}
>
<div
style={{
height: TITLE_HEIGHT,
lineHeight: `${TITLE_HEIGHT}px`,
paddingLeft: 24,
fontSize: 22,
fontWeight: 500,
color: t.ink,
}}
>
{TITLE}
</div>
<LineChart
width={window.ANYPLOT_SIZE.width}
height={chartHeight}
skipAnimation
series={[
{
data: latencyMs,
label: "API latency",
color: t.palette[0],
showMark: true,
curve: "monotoneX",
},
]}
xAxis={[
{
data: hours,
scaleType: "linear",
label: "Hour of Day (UTC)",
labelStyle: { fontSize: 16 },
tickLabelStyle: { fontSize: 14 },
valueFormatter: (v) => `${v}:00`,
tickMinStep: 2,
},
]}
yAxis={[
{
label: "Latency (ms)",
labelStyle: { fontSize: 16 },
tickLabelStyle: { fontSize: 14 },
},
]}
grid={{ horizontal: true }}
slotProps={{ legend: { hidden: true } }}
>
<ThresholdSpan />
<MaintenanceSpan />
<ChartsReferenceLine
x={MAINTENANCE_START}
lineStyle={{ stroke: t.amber, strokeDasharray: "4 4" }}
/>
<ChartsReferenceLine
x={MAINTENANCE_END}
lineStyle={{ stroke: t.amber, strokeDasharray: "4 4" }}
/>
<ChartsReferenceLine
y={DEGRADED_THRESHOLD}
lineStyle={{ stroke: t.amber, strokeDasharray: "2 3" }}
/>
</LineChart>
</div>
);
}
Runnable source as JSON, for any HTTP client: https://api.anyplot.ai/specs/span-basic/muix/code. Any spec id and library id listed in llms-full.txt fit the same URL shape; every URL below is complete and callable.
{
  "spec_id": "span-basic",
  "language": "javascript",
  "library": "muix",
  "page": "https://anyplot.ai/span-basic/javascript/muix",
  "hub": "https://anyplot.ai/span-basic",
  "code_json": "https://api.anyplot.ai/specs/span-basic/muix/code",
  "spec_json": "https://api.anyplot.ai/specs/span-basic",
  "render_light_png": "https://storage.googleapis.com/anyplot-images/plots/span-basic/javascript/muix/plot-light.png",
  "render_dark_png": "https://storage.googleapis.com/anyplot-images/plots/span-basic/javascript/muix/plot-dark.png",
  "interactive_light_html": "https://storage.googleapis.com/anyplot-images/plots/span-basic/javascript/muix/plot-light.html",
  "interactive_dark_html": "https://storage.googleapis.com/anyplot-images/plots/span-basic/javascript/muix/plot-dark.html",
  "quality_score": 91.0,
  "license": "MIT",
  "guide": "https://anyplot.ai/llms.txt"
}
Part of Basic Span Plot (Highlighted Region) on anyplot.ai.