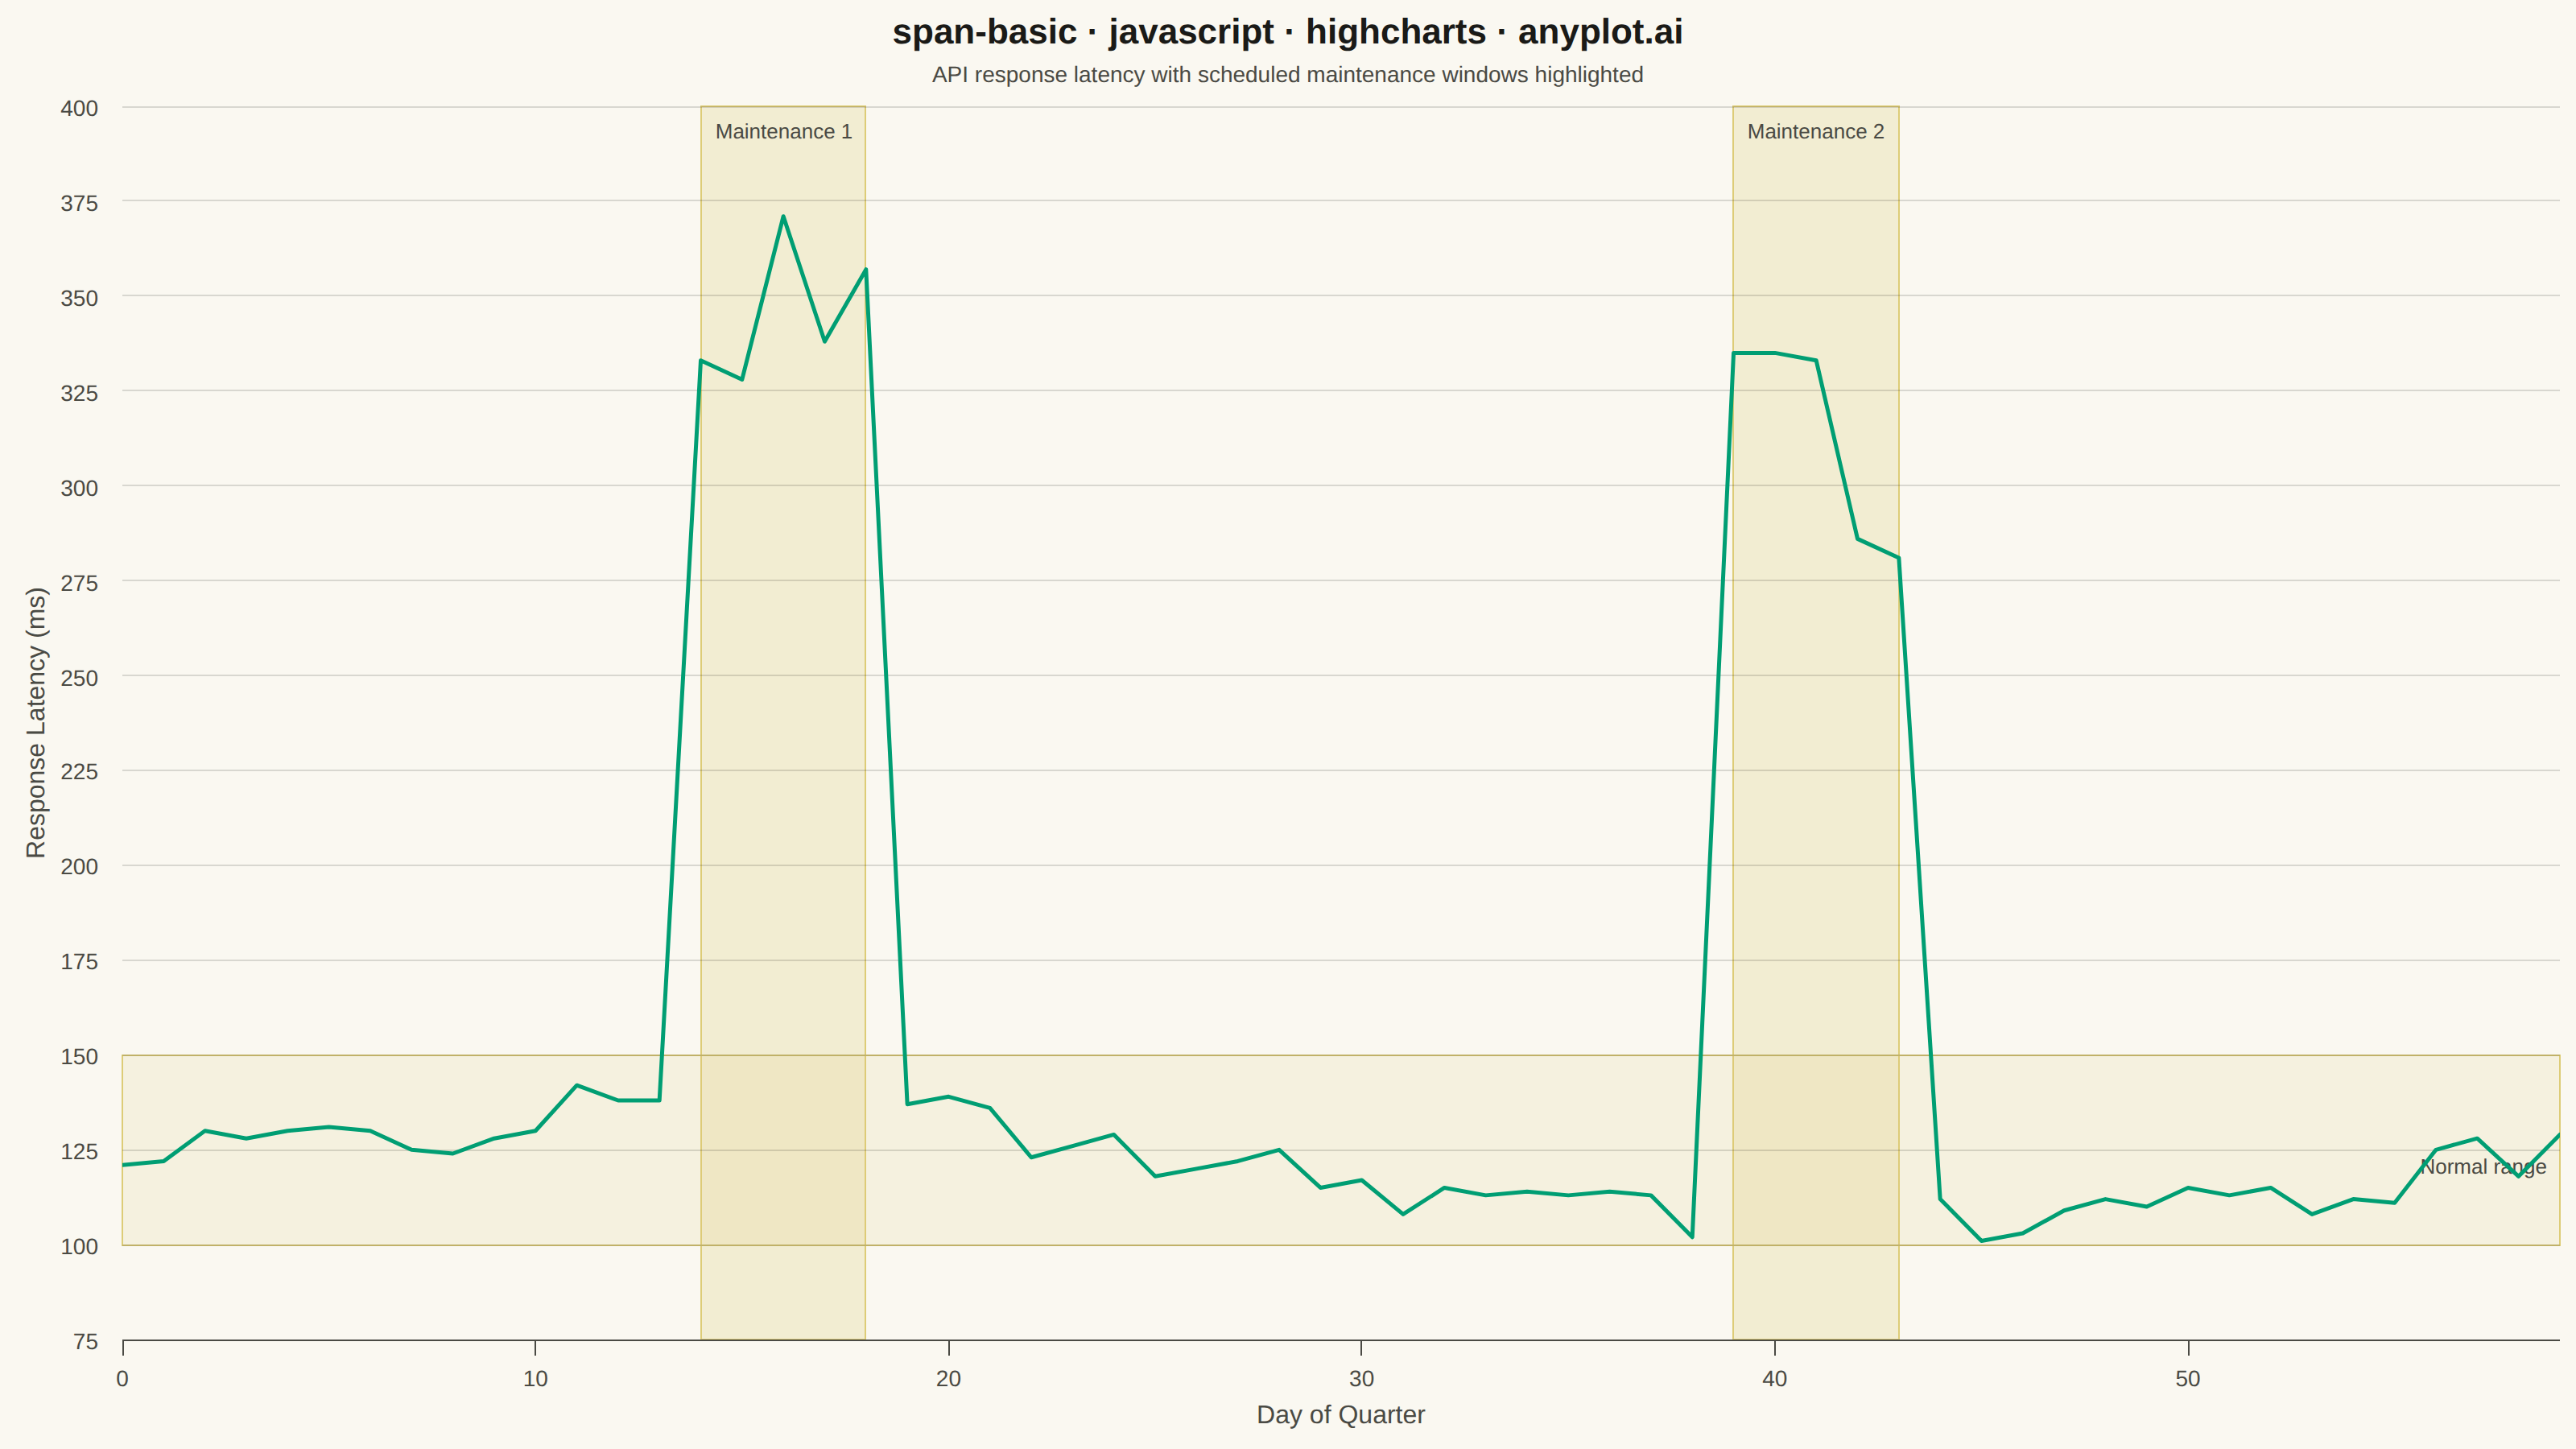
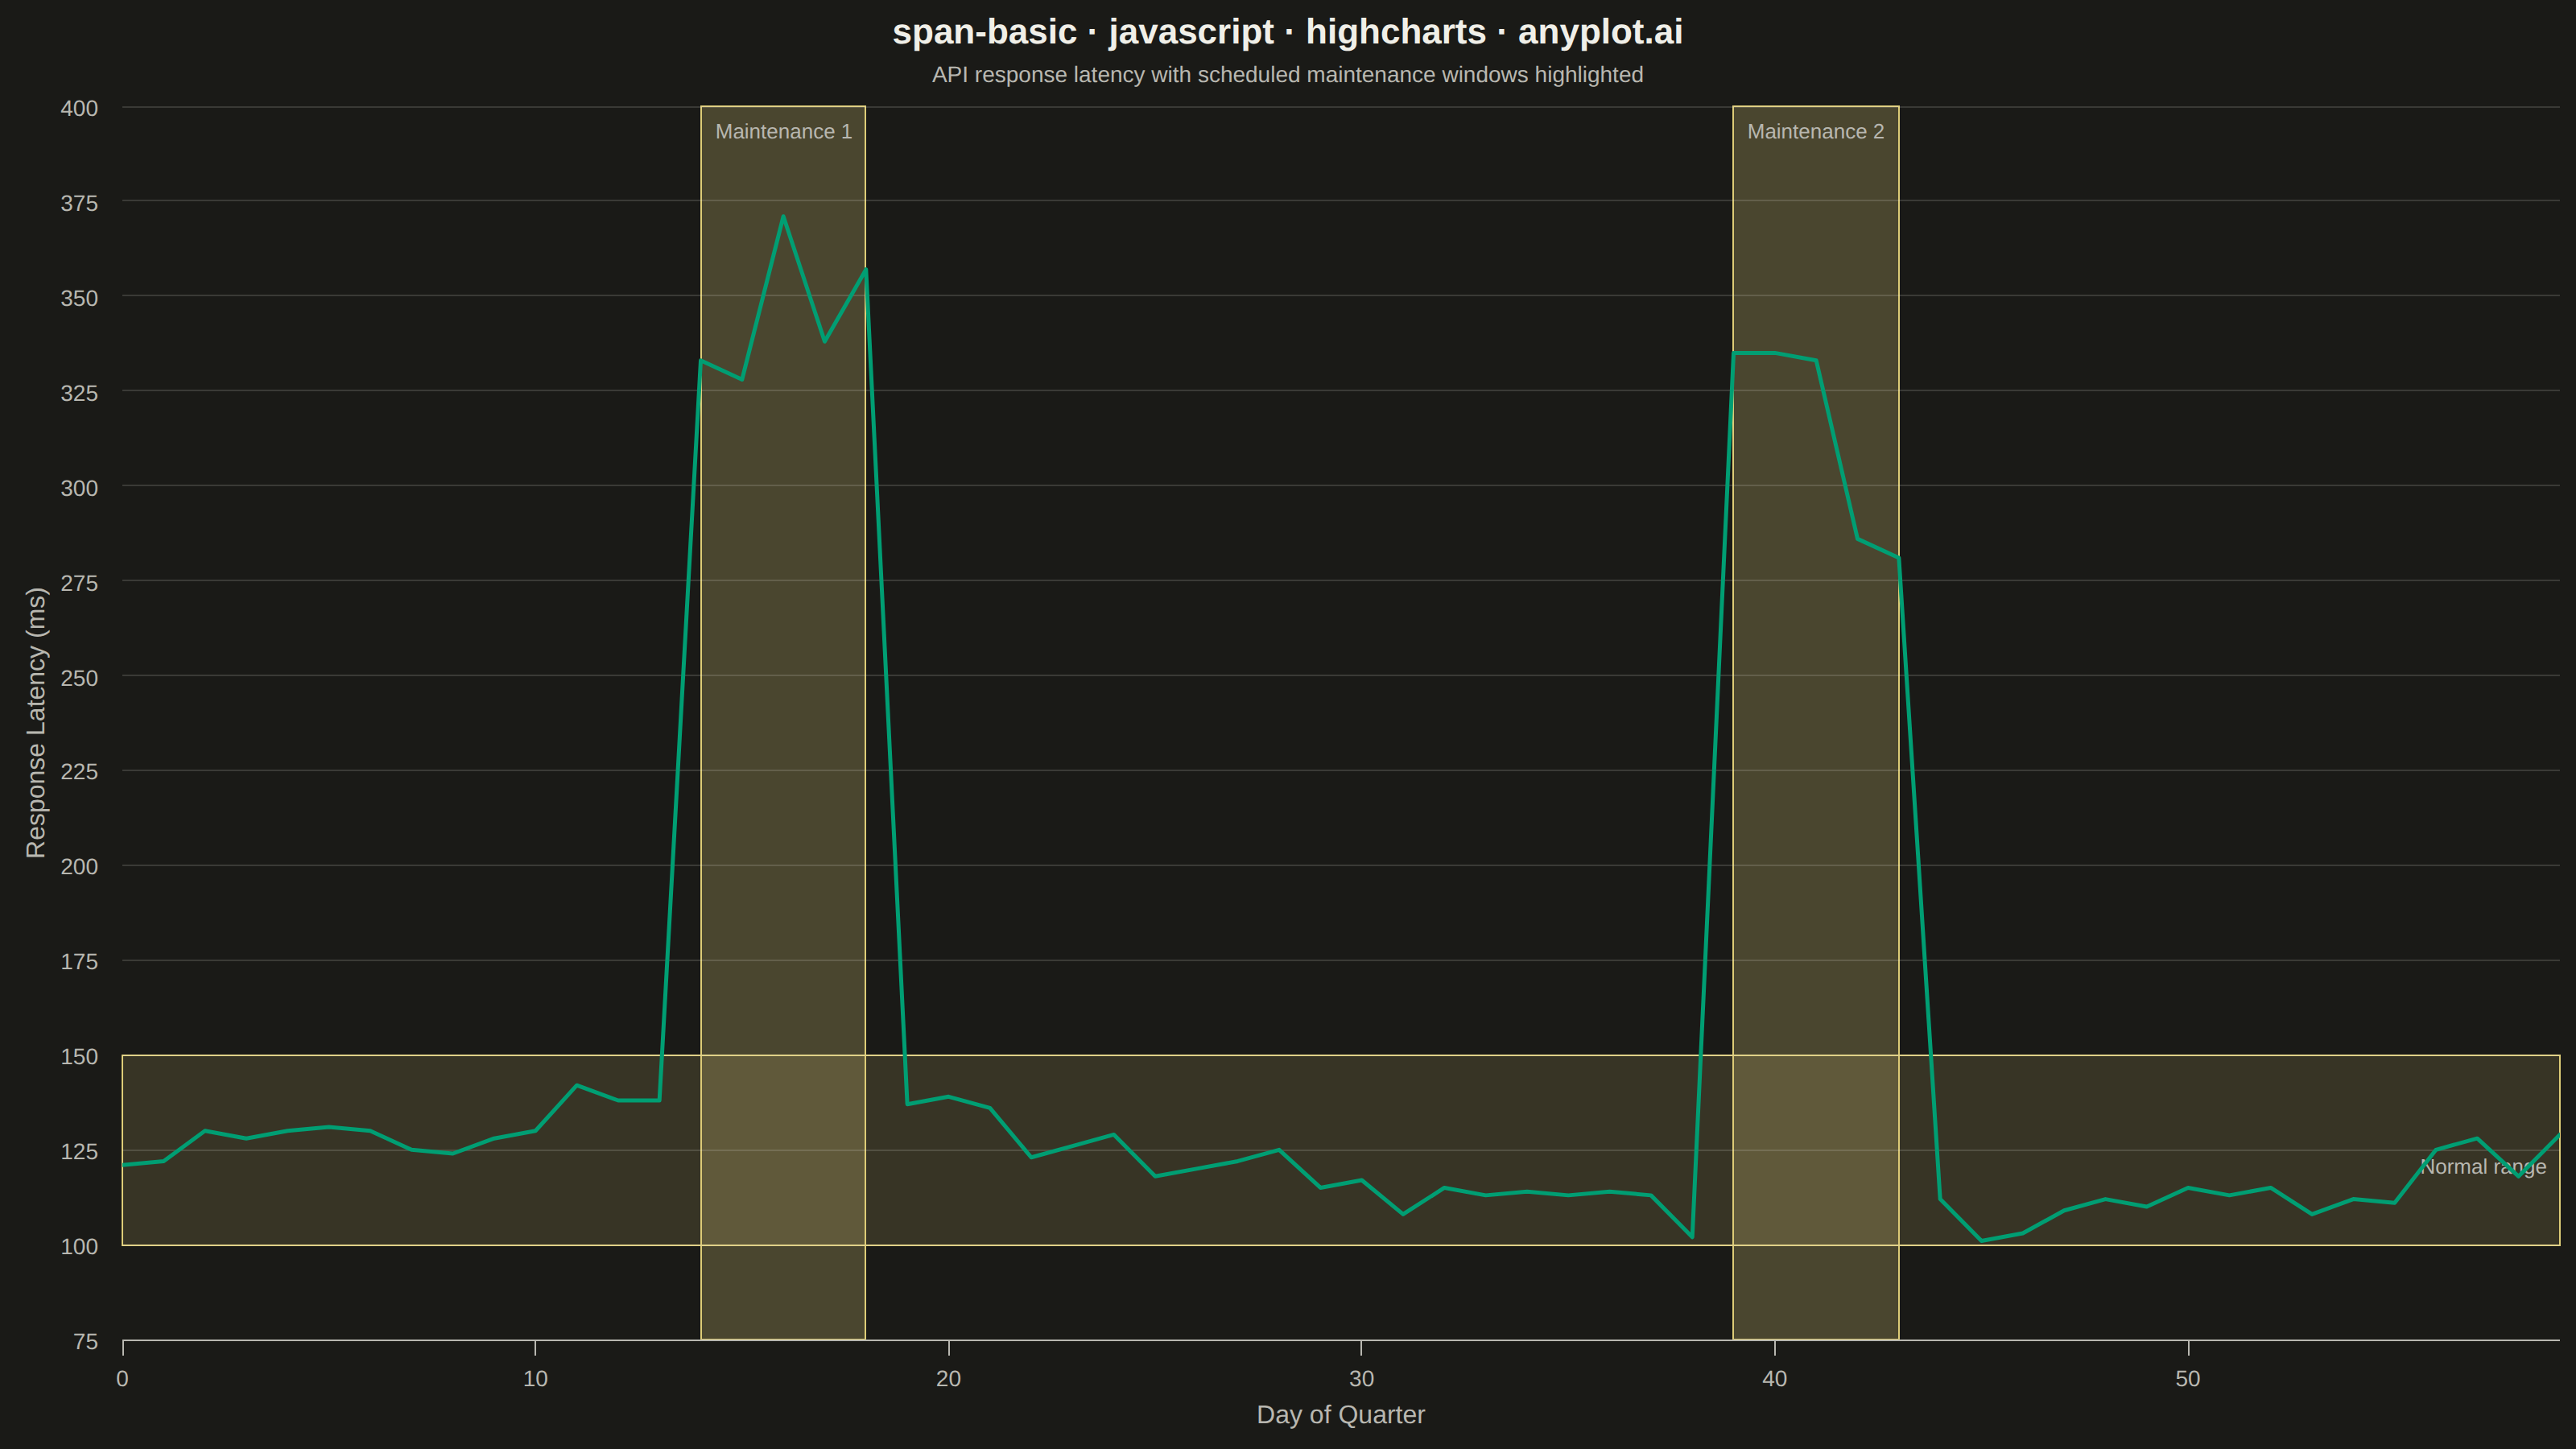
The same plot in 14 other libraries — JavaScript: Chart.js, D3.js, Apache ECharts, MUI X Charts; Python: Altair, Bokeh, lets-plot, Matplotlib, Plotly, plotnine, Pygal, Seaborn; R: ggplot2; Julia: Makie.jl. Compare all 15 side by side: Basic Span Plot (Highlighted Region) in Python, R, Julia and JavaScript.
A span plot highlights a specific region of interest on a chart using a shaded rectangular area that spans the full height or width of the plot. Vertical spans mark ranges along the x-axis (e.g., time periods), while horizontal spans mark ranges along the y-axis (e.g., value thresholds). The semi-transparent fill allows underlying data to remain visible while drawing attention to the highlighted region.
// anyplot.ai
// span-basic: Basic Span Plot (Highlighted Region)
// Library: highcharts 12.6.0 | JavaScript 22.23.1
// Quality: 92/100 | Created: 2026-07-25

const t = window.ANYPLOT_TOKENS;

// --- Data (in-memory, deterministic, tiny fixed-seed LCG) -------------------
let seed = 42;
function nextRandom() {
  seed = (seed * 1103515245 + 12345) & 0x7fffffff;
  return seed / 0x7fffffff;
}

const dayCount = 60;
const maintenanceWindows = [
  { from: 14, to: 18 },
  { from: 39, to: 43 },
];
const normalRange = { from: 100, to: 150 };
const inWindow = (day) => maintenanceWindows.some((w) => day >= w.from && day <= w.to);

const latencyMs = [];
for (let day = 0; day < dayCount; day += 1) {
  const baseline = 120 + 15 * Math.sin(day / 9);
  const spike = inWindow(day) ? 180 + 60 * nextRandom() : 0;
  const noise = (nextRandom() - 0.5) * 16;
  latencyMs.push(Math.round(baseline + spike + noise));
}

// --- Chart -------------------------------------------------------------------
Highcharts.chart("container", {
  chart: {
    type: "line",
    backgroundColor: "transparent",
    animation: false,
    style: { fontFamily: "inherit" },
  },
  credits: { enabled: false },
  colors: t.palette,
  title: {
    text: "span-basic · javascript · highcharts · anyplot.ai",
    style: { color: t.ink, fontSize: "22px", fontWeight: "600" },
  },
  subtitle: {
    text: "API response latency with scheduled maintenance windows highlighted",
    style: { color: t.inkSoft, fontSize: "14px" },
  },
  xAxis: {
    title: { text: "Day of Quarter", style: { color: t.inkSoft, fontSize: "16px" } },
    lineColor: t.inkSoft,
    tickColor: t.inkSoft,
    gridLineColor: t.grid,
    labels: { style: { color: t.inkSoft, fontSize: "14px" } },
    min: 0,
    max: dayCount - 1,
    tickInterval: 10,
    plotBands: maintenanceWindows.map((w, i) => ({
      from: w.from,
      to: w.to,
      color: `${t.amber}40`,
      borderColor: t.amber,
      borderWidth: 1,
      label: {
        text: `Maintenance ${i + 1}`,
        style: { color: t.inkSoft, fontSize: "13px" },
        rotation: 0,
        y: 20,
      },
    })),
  },
  yAxis: {
    title: { text: "Response Latency (ms)", style: { color: t.inkSoft, fontSize: "16px" } },
    gridLineColor: t.grid,
    lineColor: t.inkSoft,
    tickColor: t.inkSoft,
    labels: { style: { color: t.inkSoft, fontSize: "14px" } },
    plotBands: [
      {
        from: normalRange.from,
        to: normalRange.to,
        color: `${t.amber}26`,
        borderColor: t.amber,
        borderWidth: 1,
        label: {
          text: "Normal range",
          align: "right",
          style: { color: t.inkSoft, fontSize: "13px" },
          x: -8,
          y: 14,
        },
      },
    ],
  },
  legend: { enabled: false },
  plotOptions: {
    series: { animation: false },
    line: { marker: { enabled: false }, lineWidth: 2.5 },
  },
  tooltip: {
    backgroundColor: t.elevatedBg,
    borderColor: t.grid,
    style: { color: t.ink, fontSize: "13px" },
    headerFormat: "Day {point.x}<br/>",
    pointFormat: "{point.y} ms",
  },
  series: [
    {
      name: "Latency",
      data: latencyMs,
      color: t.palette[0],
    },
  ],
});
Runnable source as JSON, for any HTTP client: https://api.anyplot.ai/specs/span-basic/highcharts/code. Any spec id and library id listed in llms-full.txt fit the same URL shape; every URL below is complete and callable.
{
  "spec_id": "span-basic",
  "language": "javascript",
  "library": "highcharts",
  "page": "https://anyplot.ai/span-basic/javascript/highcharts",
  "hub": "https://anyplot.ai/span-basic",
  "code_json": "https://api.anyplot.ai/specs/span-basic/highcharts/code",
  "spec_json": "https://api.anyplot.ai/specs/span-basic",
  "render_light_png": "https://storage.googleapis.com/anyplot-images/plots/span-basic/javascript/highcharts/plot-light.png",
  "render_dark_png": "https://storage.googleapis.com/anyplot-images/plots/span-basic/javascript/highcharts/plot-dark.png",
  "interactive_light_html": "https://storage.googleapis.com/anyplot-images/plots/span-basic/javascript/highcharts/plot-light.html",
  "interactive_dark_html": "https://storage.googleapis.com/anyplot-images/plots/span-basic/javascript/highcharts/plot-dark.html",
  "quality_score": 92.0,
  "license": "MIT",
  "guide": "https://anyplot.ai/llms.txt"
}
Part of Basic Span Plot (Highlighted Region) on anyplot.ai.