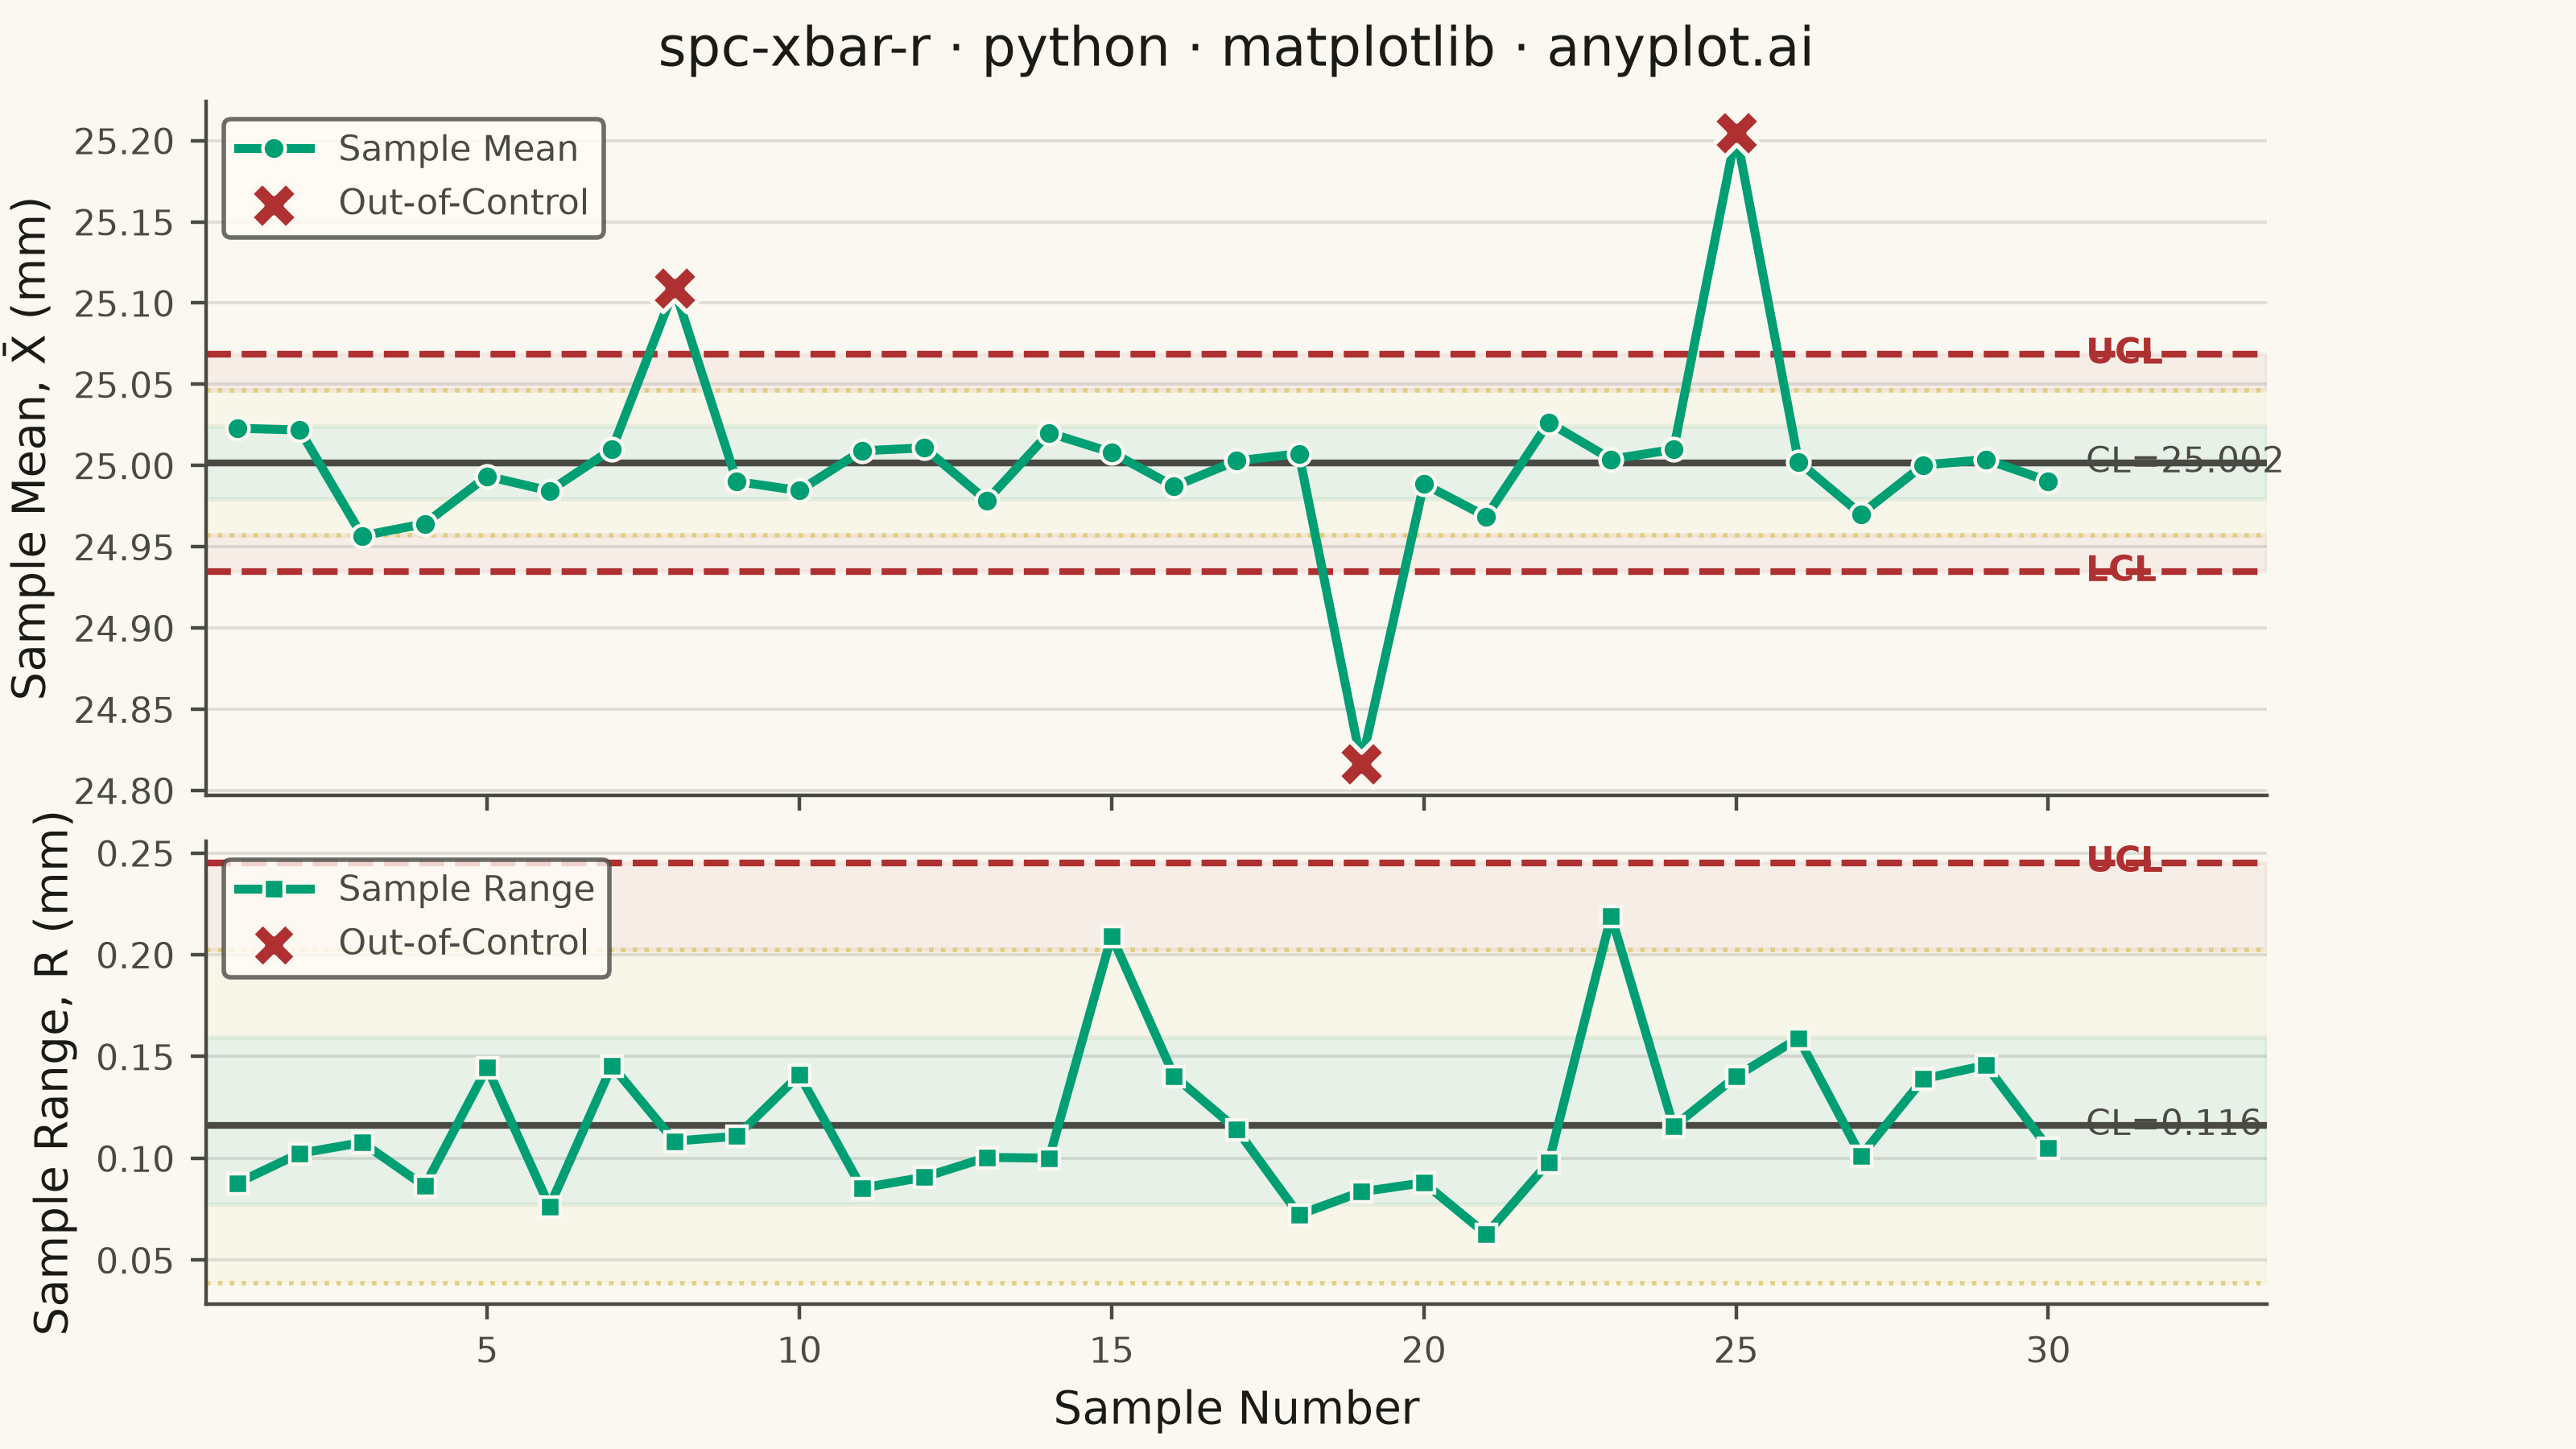
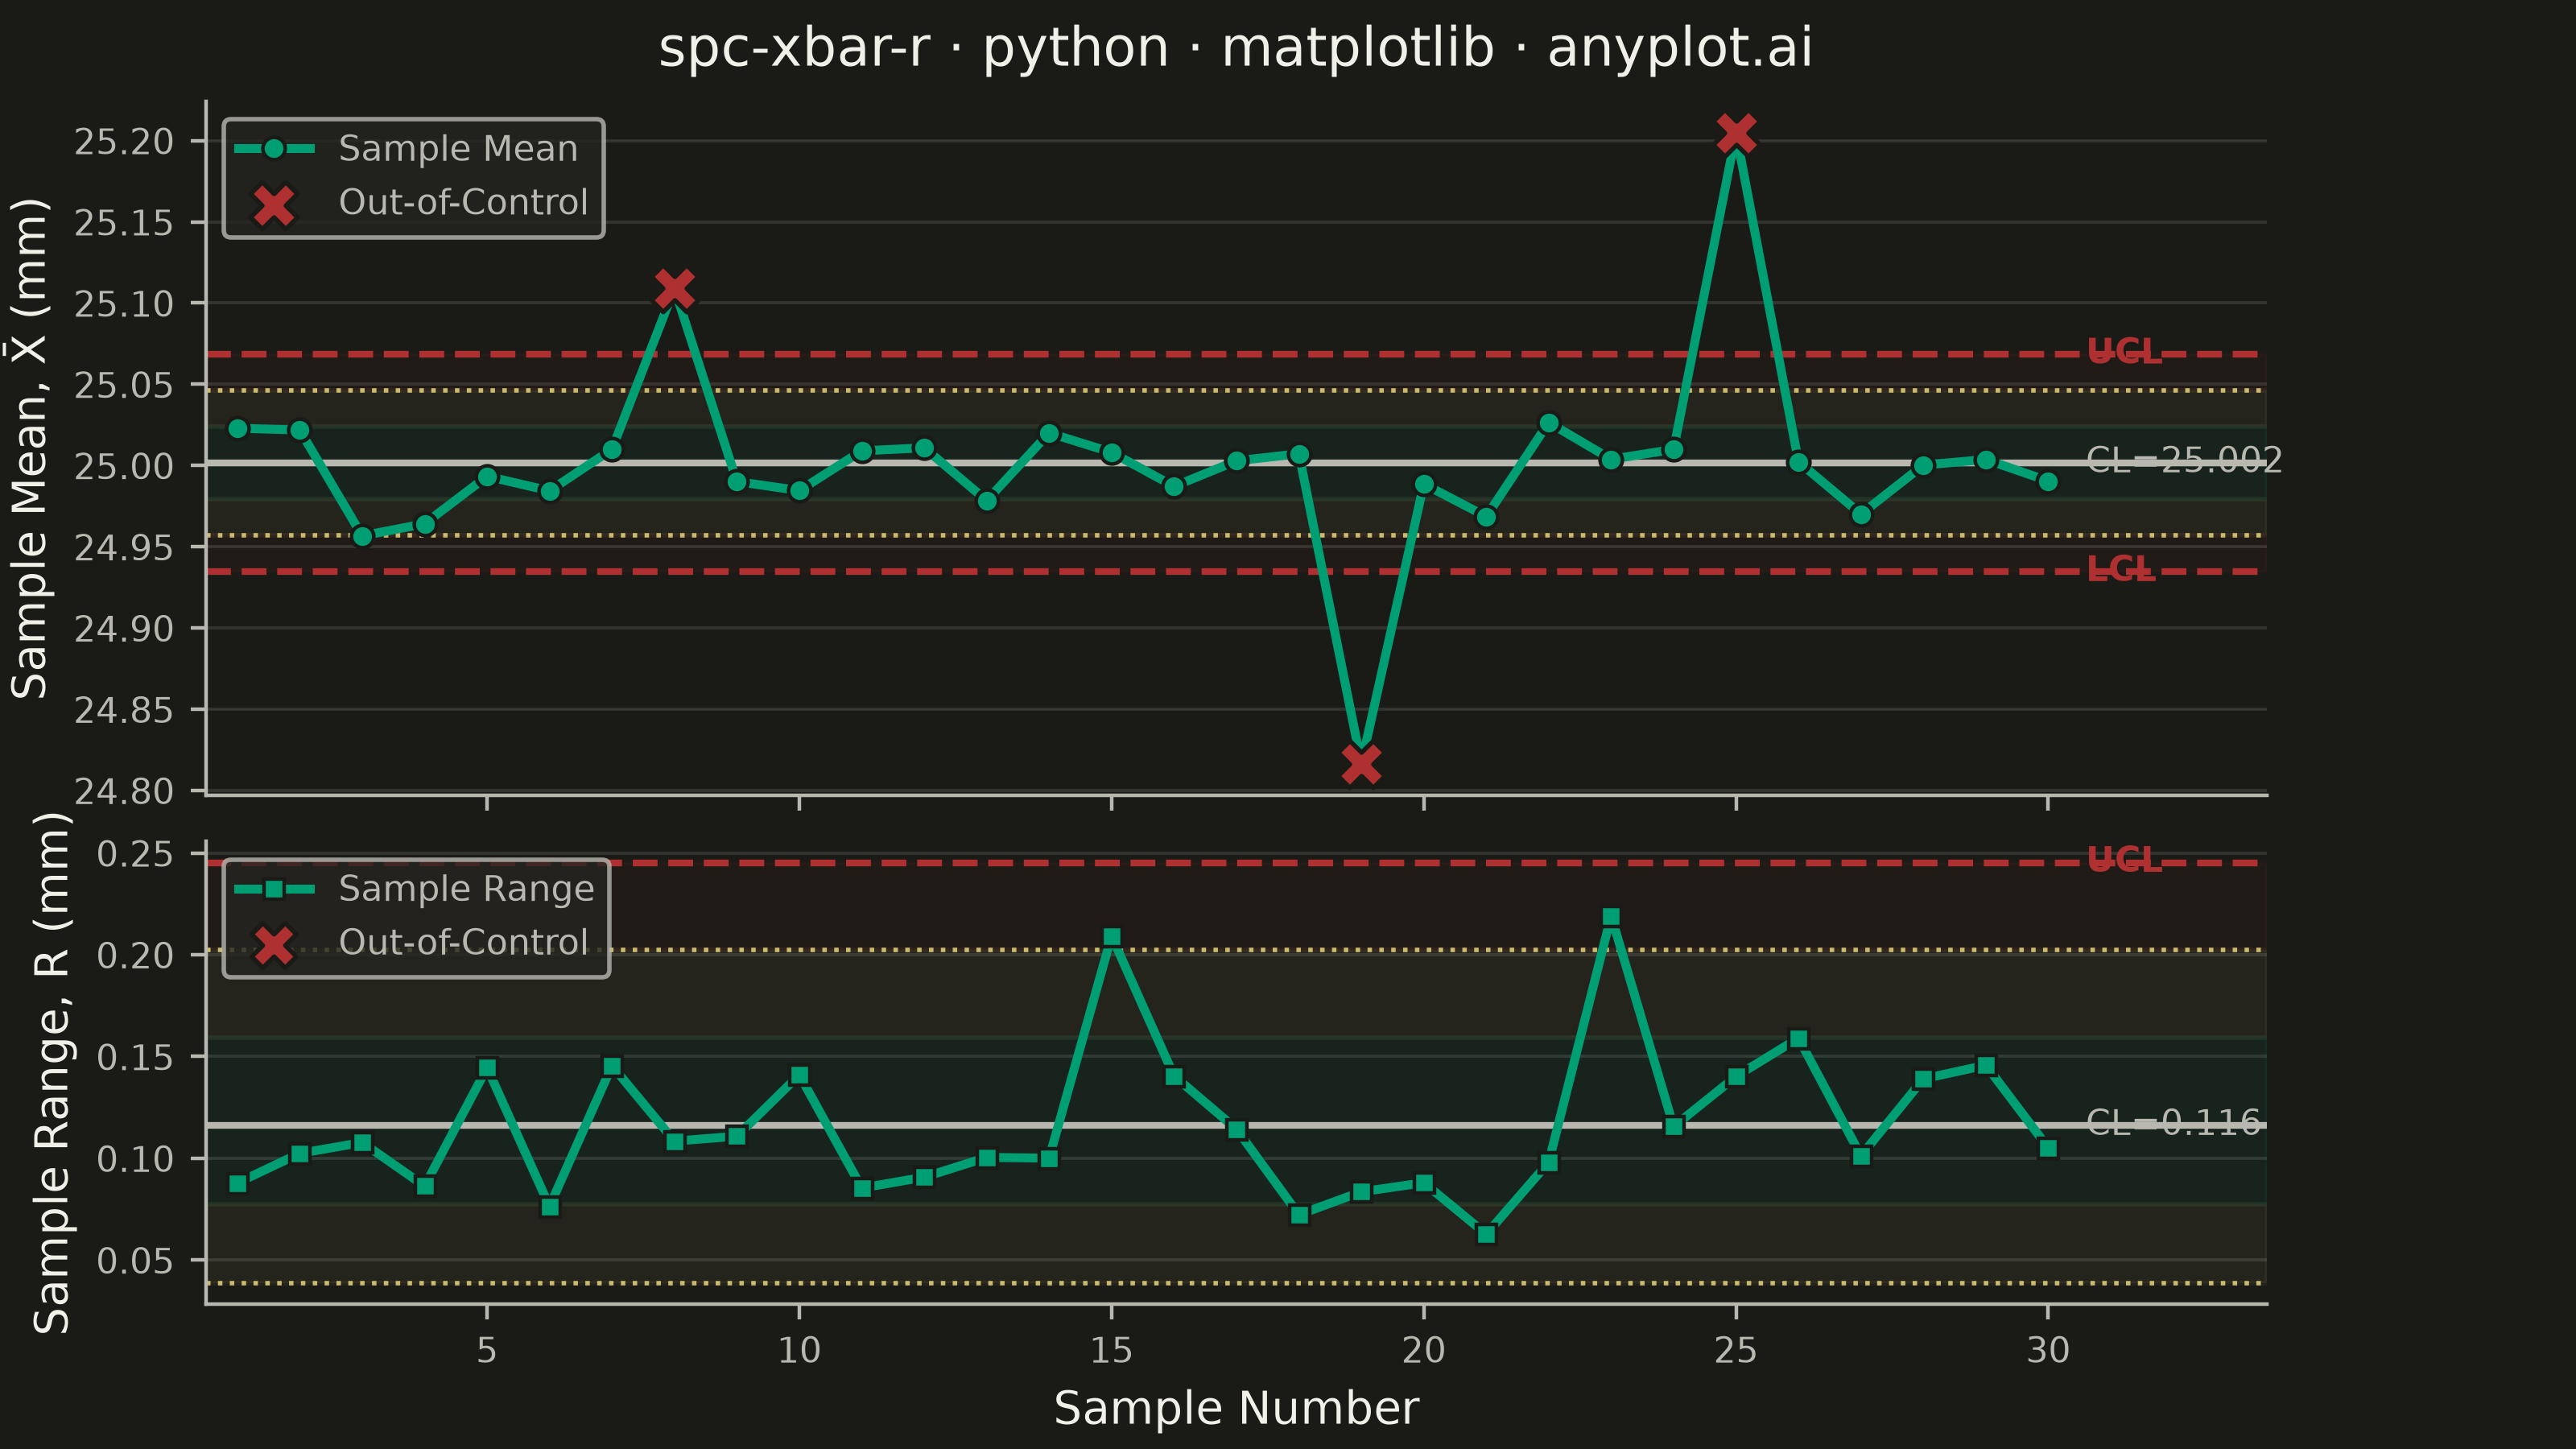
A Statistical Process Control (SPC) chart displaying sample means (X-bar) and ranges (R) plotted over time against control limits. The chart includes a center line representing the process mean, Upper Control Limit (UCL) and Lower Control Limit (LCL) at ±3 sigma, and optional warning limits at ±2 sigma. Out-of-control points are highlighted to signal process instability. This is a fundamental tool in manufacturing quality control and Six Sigma methodology for monitoring process stability.
Preview render from the Matplotlib implementation.