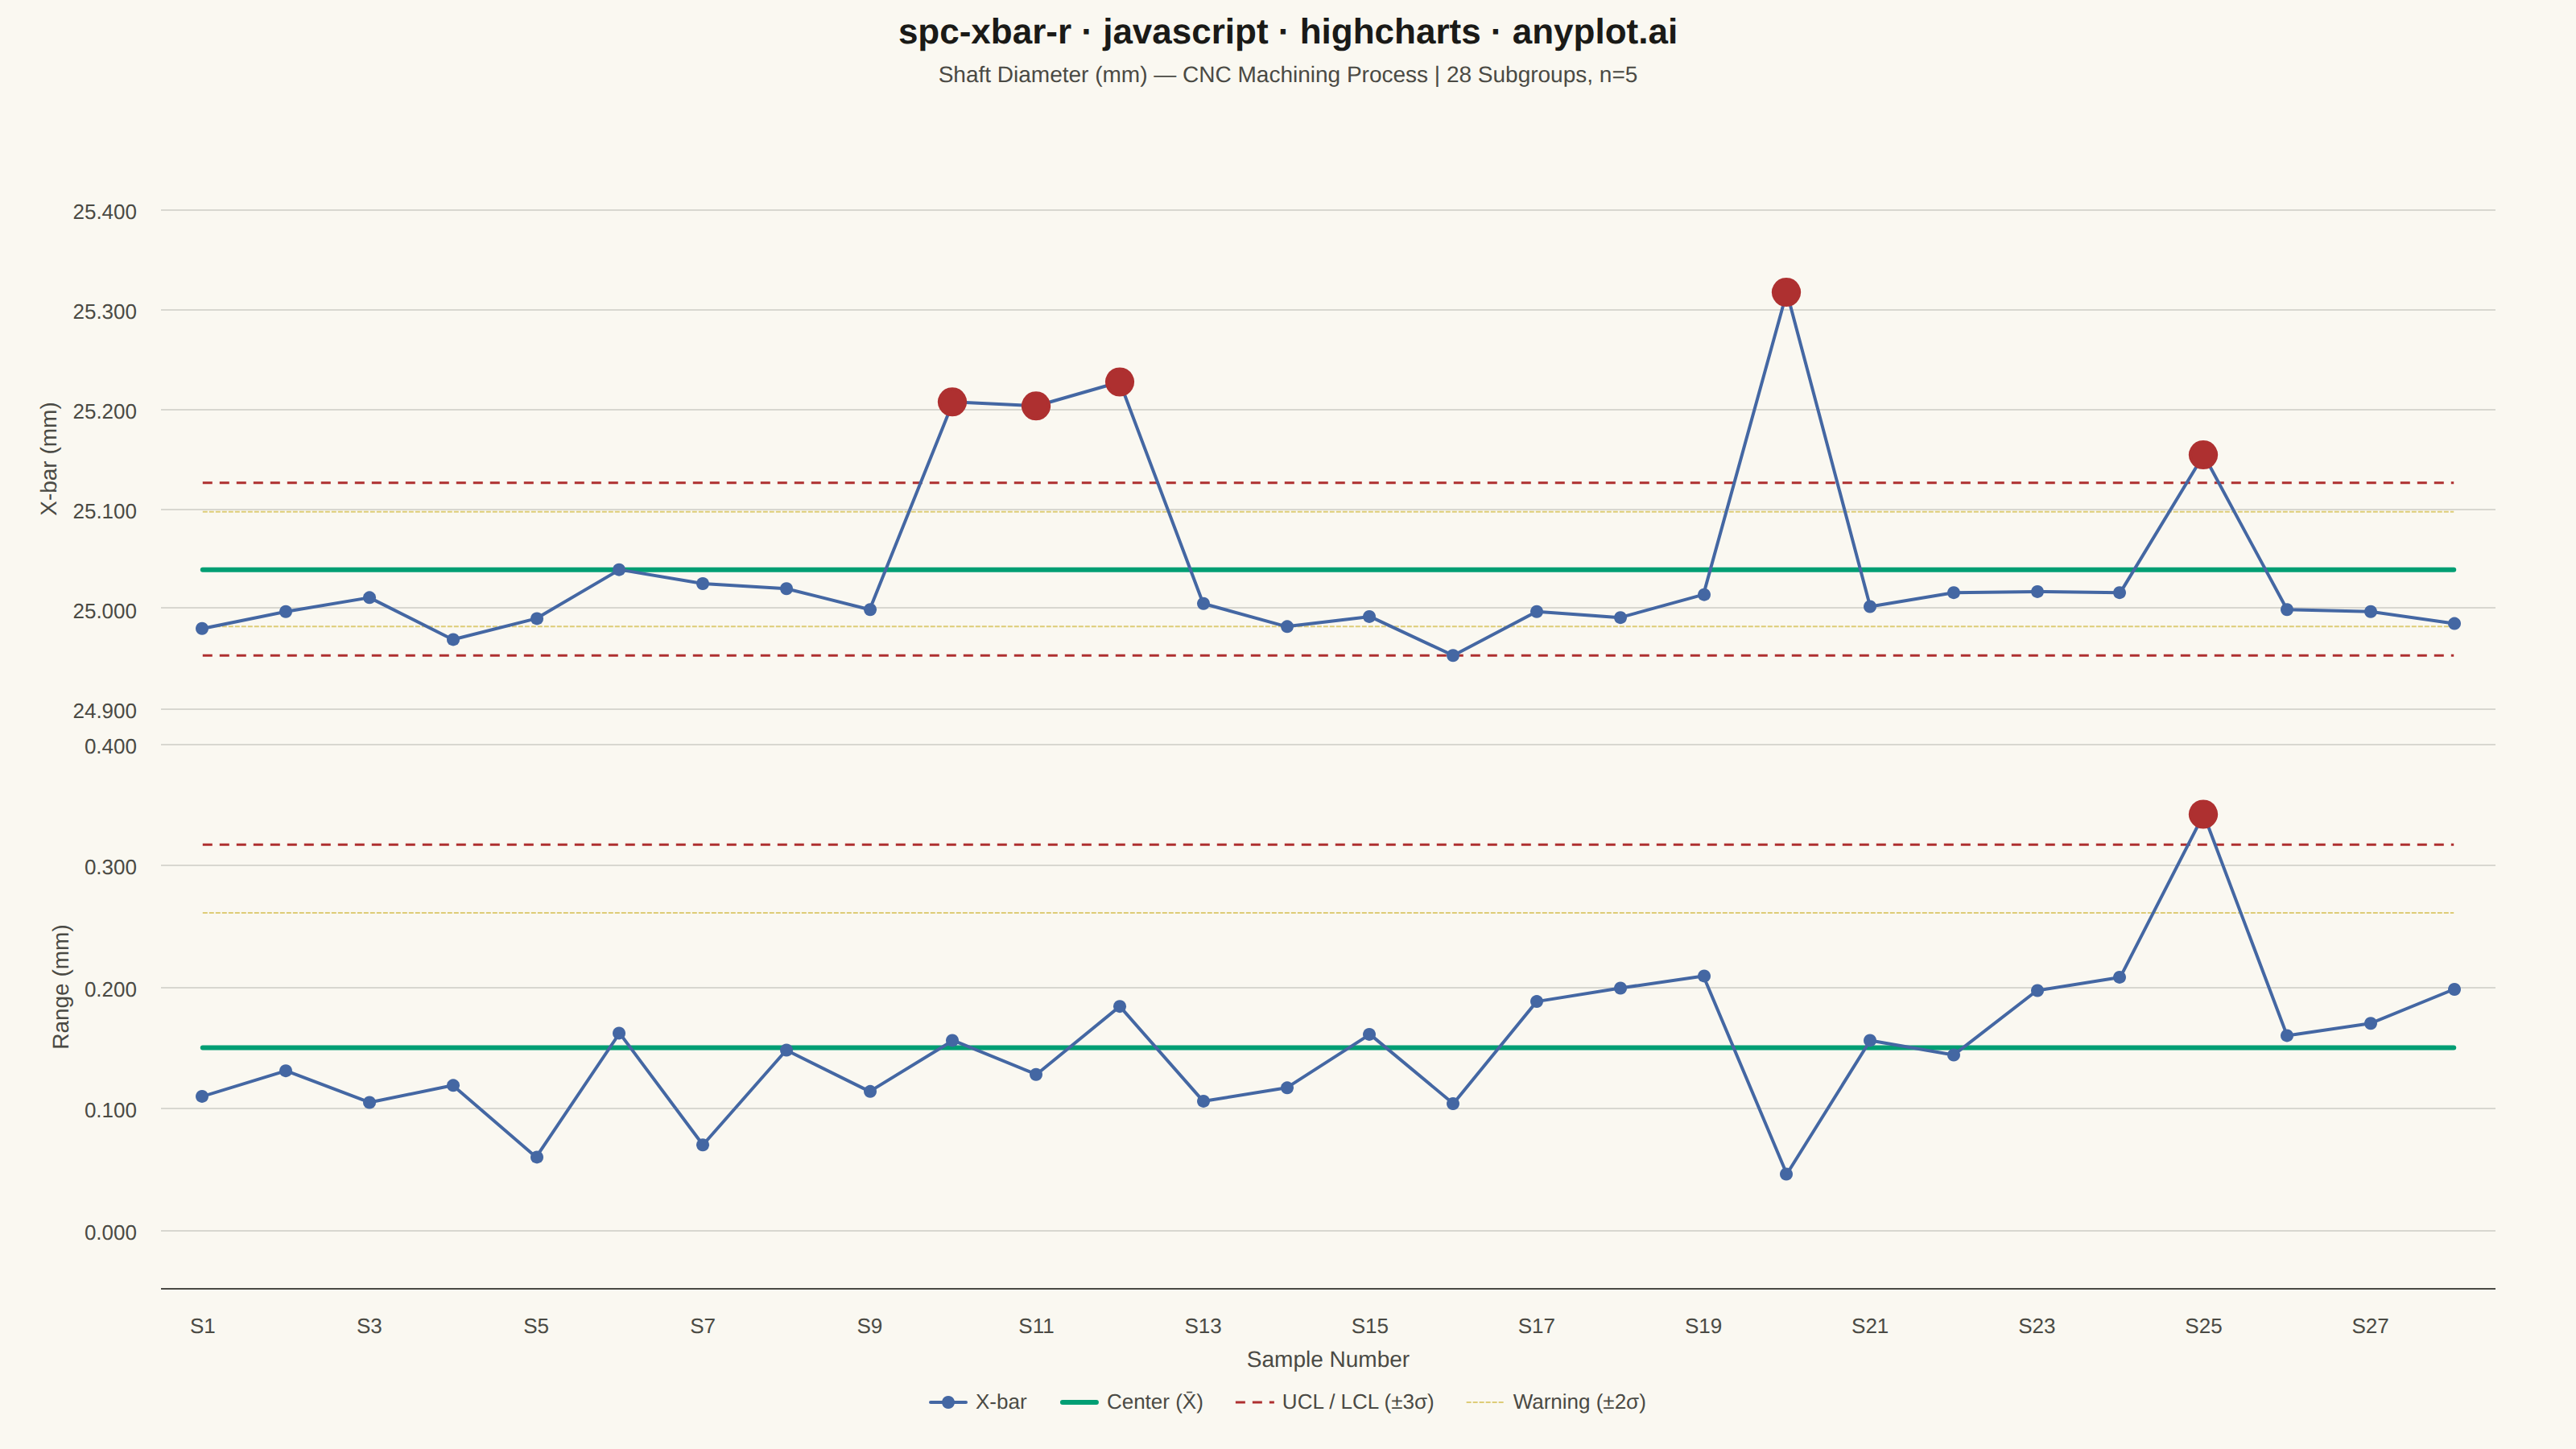
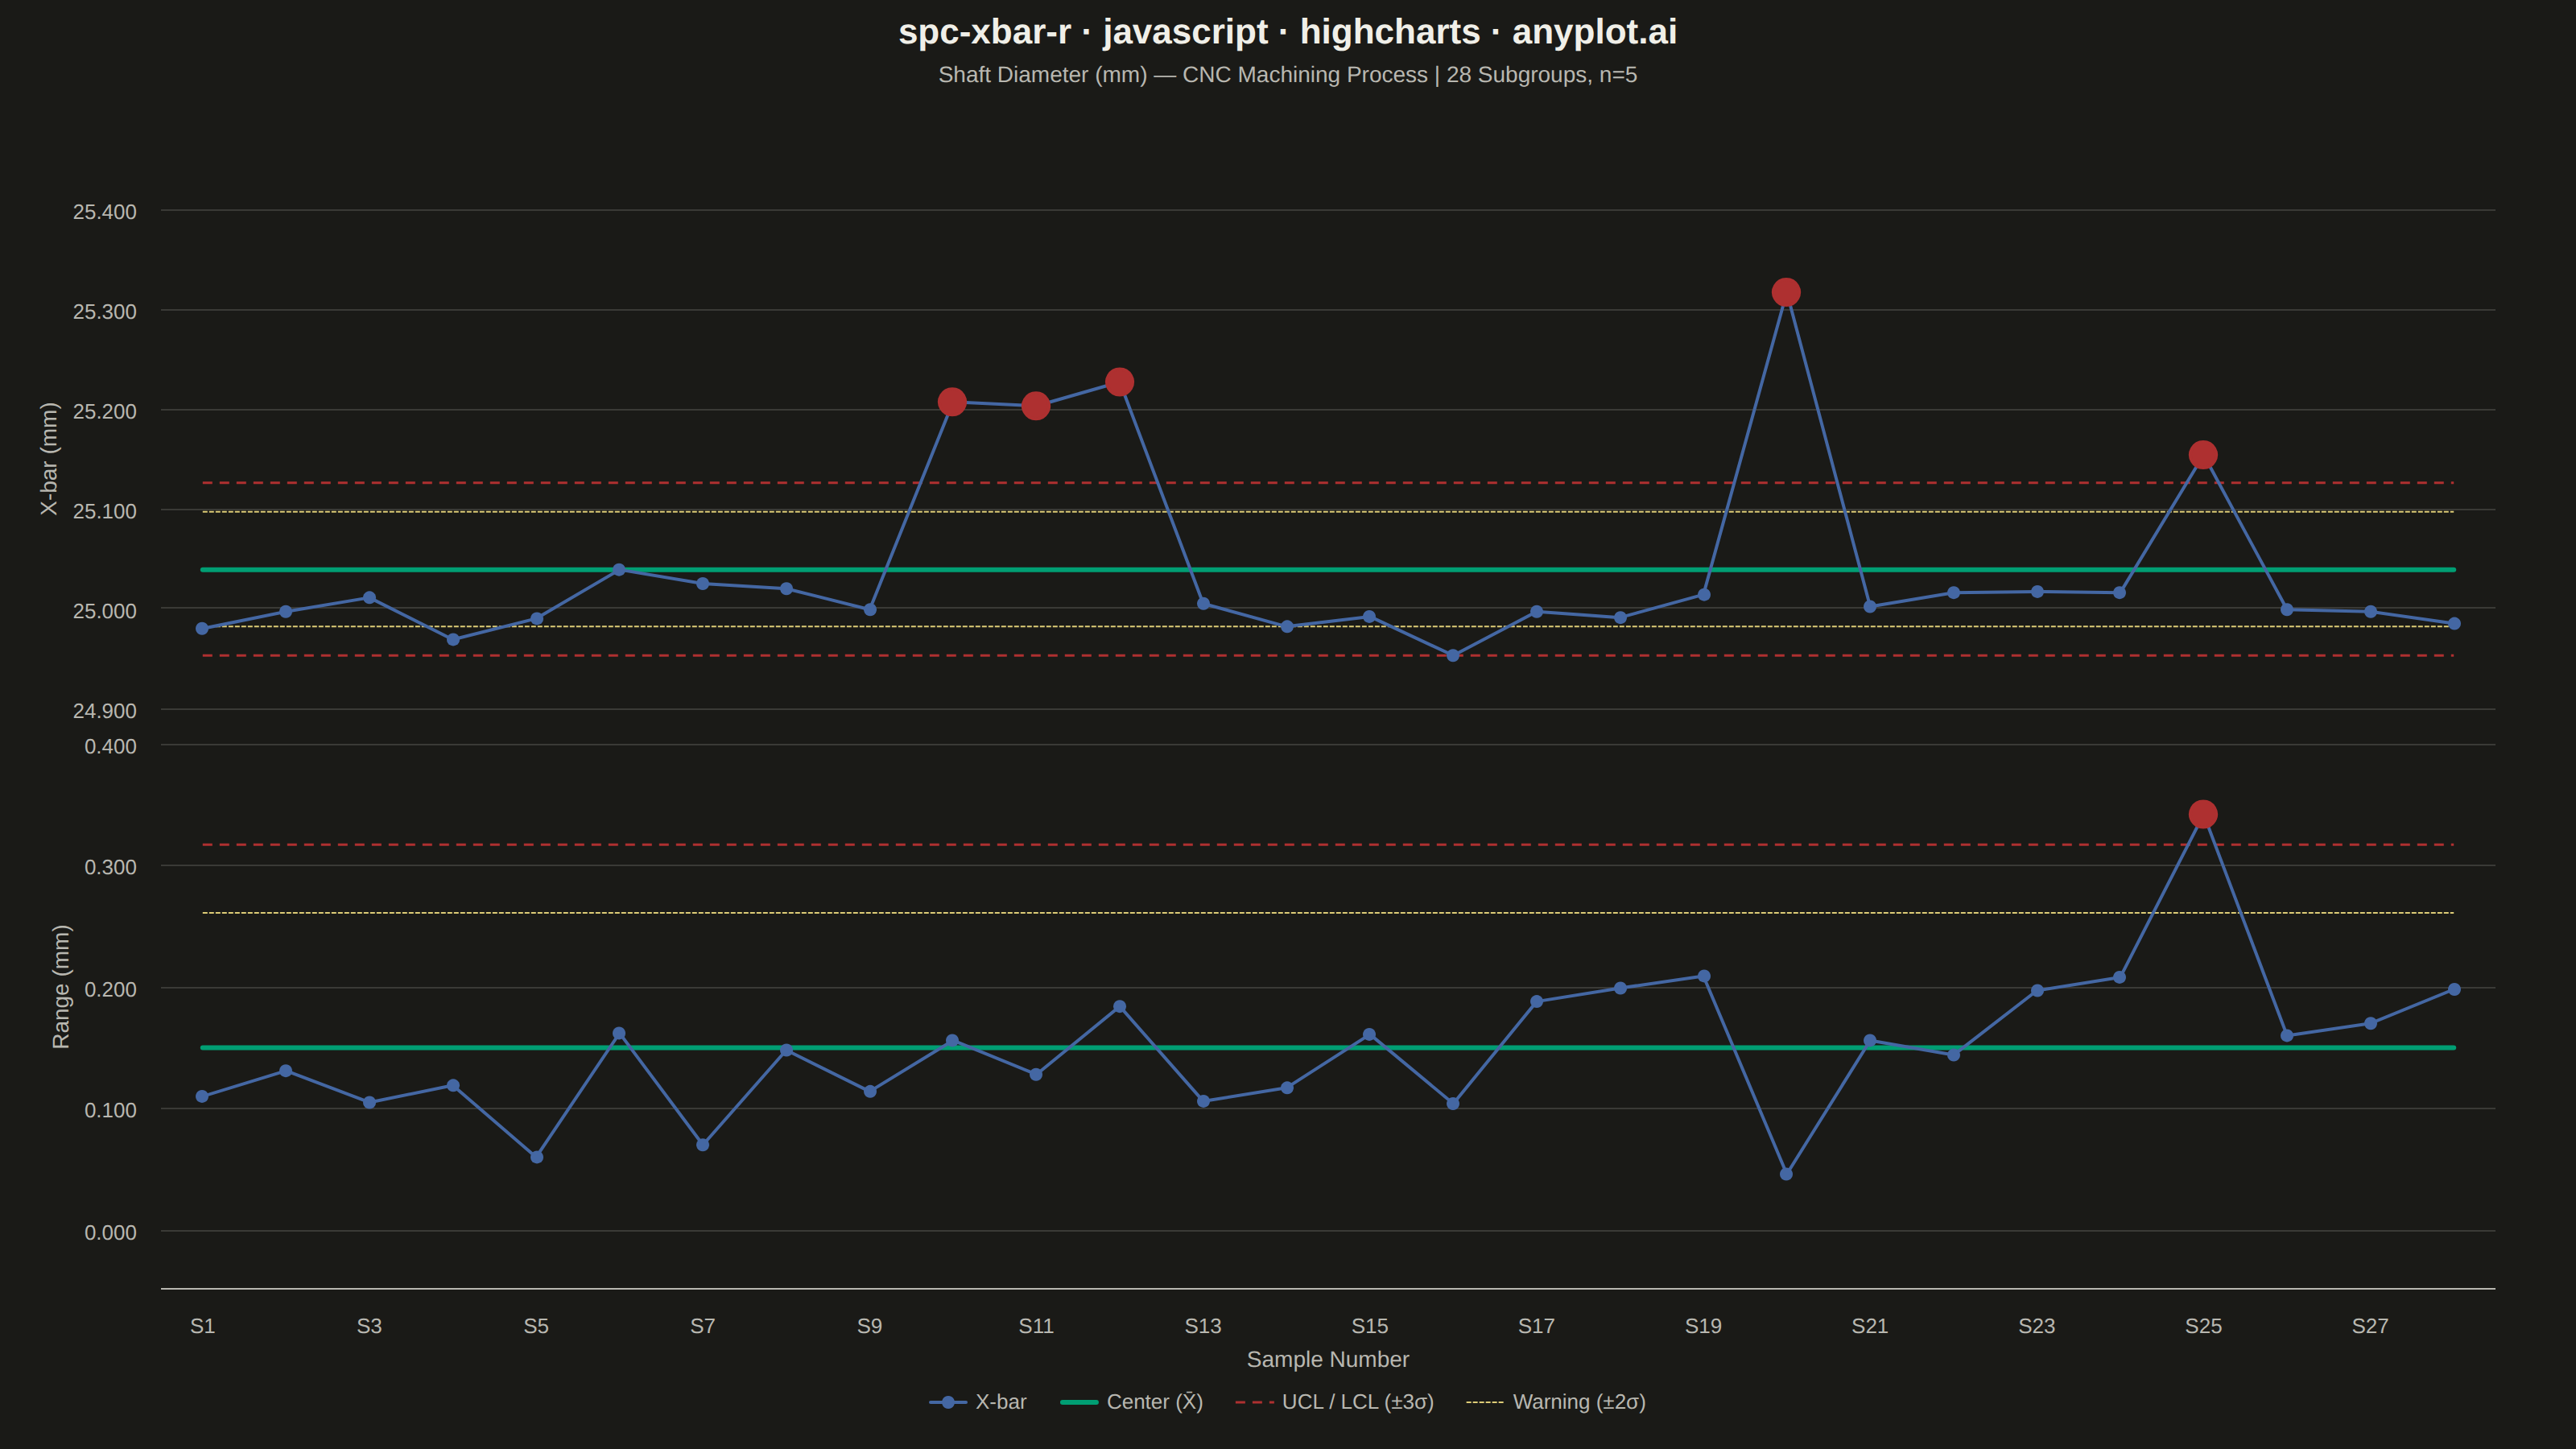
A Statistical Process Control (SPC) chart displaying sample means (X-bar) and ranges (R) plotted over time against control limits. The chart includes a center line representing the process mean, Upper Control Limit (UCL) and Lower Control Limit (LCL) at ±3 sigma, and optional warning limits at ±2 sigma. Out-of-control points are highlighted to signal process instability. This is a fundamental tool in manufacturing quality control and Six Sigma methodology for monitoring process stability.
// anyplot.ai
// spc-xbar-r: Statistical Process Control Chart (X-bar/R)
// Library: highcharts 12.6.0 | JavaScript 22.22.3
// Quality: 87/100 | Created: 2026-06-20
//# anyplot-orientation: landscape

const t = window.ANYPLOT_TOKENS;

// Deterministic LCG random number generator
let _seed = 42;
function lcgRand() {
  _seed = ((_seed * 1664525 + 1013904223) >>> 0);
  return _seed / 0x100000000;
}

// Standard normal via polar Box-Muller
let _spare = null;
function randN() {
  if (_spare !== null) { const s = _spare; _spare = null; return s; }
  let u, v, r;
  do { u = lcgRand() * 2 - 1; v = lcgRand() * 2 - 1; r = u * u + v * v; } while (r >= 1 || r === 0);
  const c = Math.sqrt(-2 * Math.log(r) / r);
  _spare = v * c;
  return u * c;
}

// Generate 28 subgroups of n=5 shaft diameter measurements (target 25.00mm, σ=0.06mm)
const N = 28;
const N_SUB = 5;
const TARGET = 25.0;
const SIGMA = 0.06;

const xbarVals = [], rVals = [];
for (let i = 0; i < N; i++) {
  const sub = [];
  // Sample 25 (i=24): tooling wear causes elevated variability → OOC range event
  const localSigma = (i === 24) ? SIGMA * 4 : SIGMA;
  for (let j = 0; j < N_SUB; j++) {
    // Inject upward shifts to create realistic OOC signals
    let shift = 0;
    if (i >= 9 && i <= 11) shift = 0.22;  // process drift (samples 10-12)
    if (i === 19) shift = 0.30;            // isolated spike (sample 20)
    sub.push(TARGET + shift + randN() * localSigma);
  }
  xbarVals.push(sub.reduce((a, b) => a + b, 0) / N_SUB);
  rVals.push(Math.max(...sub) - Math.min(...sub));
}

// Control chart constants for n=5: A2=0.577, D3=0, D4=2.115
const A2 = 0.577, D3 = 0, D4 = 2.115;
const xbb = xbarVals.reduce((a, b) => a + b, 0) / N;
const rb  = rVals.reduce((a, b) => a + b, 0) / N;

const xUCL = xbb + A2 * rb;
const xLCL = xbb - A2 * rb;
const xUWL = xbb + (2 / 3) * A2 * rb;
const xLWL = xbb - (2 / 3) * A2 * rb;
const rUCL = D4 * rb;
const rUWL = rb + (2 / 3) * (rUCL - rb);

const fix3 = v => Math.round(v * 1000) / 1000;
const flat  = (v, n) => Array(n).fill(fix3(v));
const cats  = Array.from({length: N}, (_, i) => `S${i + 1}`);

// Build X-bar series data with OOC point highlighting
const xbarData = xbarVals.map(v => {
  const ooc = v > xUCL || v < xLCL;
  return {
    y: fix3(v),
    marker: ooc
      ? { fillColor: '#AE3030', radius: 8, lineWidth: 2, lineColor: '#AE3030', symbol: 'circle' }
      : { symbol: 'circle', radius: 4, fillColor: t.palette[2] }
  };
});

// Build R series data with OOC point highlighting
const rData = rVals.map(v => {
  const ooc = v > rUCL;
  return {
    y: fix3(v),
    marker: ooc
      ? { fillColor: '#AE3030', radius: 8, lineWidth: 2, lineColor: '#AE3030', symbol: 'circle' }
      : { symbol: 'circle', radius: 4, fillColor: t.palette[2] }
  };
});

Highcharts.chart("container", {
  chart: {
    backgroundColor: "transparent",
    animation: false,
    style: { fontFamily: "inherit" },
    marginTop: 80,
    marginBottom: 100,
    marginLeft: 100,
    marginRight: 50
  },
  credits: { enabled: false },
  colors: t.palette,
  title: {
    text: "spc-xbar-r · javascript · highcharts · anyplot.ai",
    style: { color: t.ink, fontSize: "22px", fontWeight: "600" }
  },
  subtitle: {
    text: "Shaft Diameter (mm) — CNC Machining Process | 28 Subgroups, n=5",
    style: { color: t.inkSoft, fontSize: "14px" }
  },
  xAxis: {
    categories: cats,
    lineColor: t.inkSoft,
    tickColor: t.inkSoft,
    gridLineColor: t.grid,
    gridLineWidth: 0,
    labels: {
      style: { color: t.inkSoft, fontSize: "13px" },
      step: 2
    },
    title: {
      text: "Sample Number",
      style: { color: t.inkSoft, fontSize: "14px" }
    }
  },
  yAxis: [
    {
      title: {
        text: "X-bar (mm)",
        style: { color: t.inkSoft, fontSize: "14px" }
      },
      labels: {
        style: { color: t.inkSoft, fontSize: "13px" },
        formatter: function () { return this.value.toFixed(3); }
      },
      gridLineColor: t.grid,
      lineColor: t.inkSoft,
      tickColor: t.inkSoft,
      top: "7%",
      height: "43%",
      offset: 0
    },
    {
      title: {
        text: "Range (mm)",
        style: { color: t.inkSoft, fontSize: "14px" }
      },
      labels: {
        style: { color: t.inkSoft, fontSize: "13px" },
        formatter: function () { return this.value.toFixed(3); }
      },
      gridLineColor: t.grid,
      lineColor: t.inkSoft,
      tickColor: t.inkSoft,
      top: "53%",
      height: "42%",
      offset: 0,
      min: 0
    }
  ],
  legend: {
    enabled: true,
    layout: "horizontal",
    verticalAlign: "bottom",
    align: "center",
    itemStyle: { color: t.inkSoft, fontSize: "13px" },
    itemHoverStyle: { color: t.ink },
    symbolWidth: 24,
    margin: 16
  },
  tooltip: { enabled: false },
  plotOptions: {
    series: {
      animation: false,
      lineWidth: 2,
      states: { hover: { lineWidthPlus: 0 } }
    }
  },
  series: [
    // --- X-bar chart ---
    {
      name: "X-bar",
      type: "line",
      data: xbarData,
      color: t.palette[2],
      yAxis: 0,
      zIndex: 3,
      legendIndex: 0,
      enableMouseTracking: false
    },
    {
      name: "Center (X̄)",
      type: "line",
      data: flat(xbb, N),
      color: t.palette[0],
      lineWidth: 3,
      yAxis: 0,
      marker: { enabled: false },
      legendIndex: 1,
      enableMouseTracking: false
    },
    {
      name: "UCL / LCL (±3σ)",
      type: "line",
      data: flat(xUCL, N),
      color: '#AE3030',
      dashStyle: "Dash",
      lineWidth: 1.5,
      yAxis: 0,
      marker: { enabled: false },
      legendIndex: 2,
      enableMouseTracking: false
    },
    {
      name: "",
      type: "line",
      data: flat(xLCL, N),
      color: '#AE3030',
      dashStyle: "Dash",
      lineWidth: 1.5,
      yAxis: 0,
      marker: { enabled: false },
      showInLegend: false,
      enableMouseTracking: false
    },
    {
      name: "Warning (±2σ)",
      type: "line",
      data: flat(xUWL, N),
      color: '#DDCC77',
      dashStyle: "ShortDash",
      lineWidth: 1,
      yAxis: 0,
      marker: { enabled: false },
      legendIndex: 3,
      enableMouseTracking: false
    },
    {
      name: "",
      type: "line",
      data: flat(xLWL, N),
      color: '#DDCC77',
      dashStyle: "ShortDash",
      lineWidth: 1,
      yAxis: 0,
      marker: { enabled: false },
      showInLegend: false,
      enableMouseTracking: false
    },
    // --- R chart ---
    {
      name: "",
      type: "line",
      data: rData,
      color: t.palette[2],
      yAxis: 1,
      zIndex: 3,
      showInLegend: false,
      enableMouseTracking: false
    },
    {
      name: "",
      type: "line",
      data: flat(rb, N),
      color: t.palette[0],
      lineWidth: 3,
      yAxis: 1,
      marker: { enabled: false },
      showInLegend: false,
      enableMouseTracking: false
    },
    {
      name: "",
      type: "line",
      data: flat(rUCL, N),
      color: '#AE3030',
      dashStyle: "Dash",
      lineWidth: 1.5,
      yAxis: 1,
      marker: { enabled: false },
      showInLegend: false,
      enableMouseTracking: false
    },
    {
      name: "",
      type: "line",
      data: flat(rUWL, N),
      color: '#DDCC77',
      dashStyle: "ShortDash",
      lineWidth: 1,
      yAxis: 1,
      marker: { enabled: false },
      showInLegend: false,
      enableMouseTracking: false
    }
  ]
});
Runnable source as JSON, for any HTTP client: https://api.anyplot.ai/specs/spc-xbar-r/highcharts/code. Any spec id and library id listed in llms-full.txt fit the same URL shape; every URL below is complete and callable.
{
  "spec_id": "spc-xbar-r",
  "language": "javascript",
  "library": "highcharts",
  "page": "https://anyplot.ai/spc-xbar-r/javascript/highcharts",
  "hub": "https://anyplot.ai/spc-xbar-r",
  "code_json": "https://api.anyplot.ai/specs/spc-xbar-r/highcharts/code",
  "spec_json": "https://api.anyplot.ai/specs/spc-xbar-r",
  "render_light_png": "https://storage.googleapis.com/anyplot-images/plots/spc-xbar-r/javascript/highcharts/plot-light.png",
  "render_dark_png": "https://storage.googleapis.com/anyplot-images/plots/spc-xbar-r/javascript/highcharts/plot-dark.png",
  "interactive_light_html": "https://storage.googleapis.com/anyplot-images/plots/spc-xbar-r/javascript/highcharts/plot-light.html",
  "interactive_dark_html": "https://storage.googleapis.com/anyplot-images/plots/spc-xbar-r/javascript/highcharts/plot-dark.html",
  "quality_score": 87.0,
  "license": "MIT",
  "guide": "https://anyplot.ai/llms.txt"
}
Part of Statistical Process Control Chart (X-bar/R) on anyplot.ai.