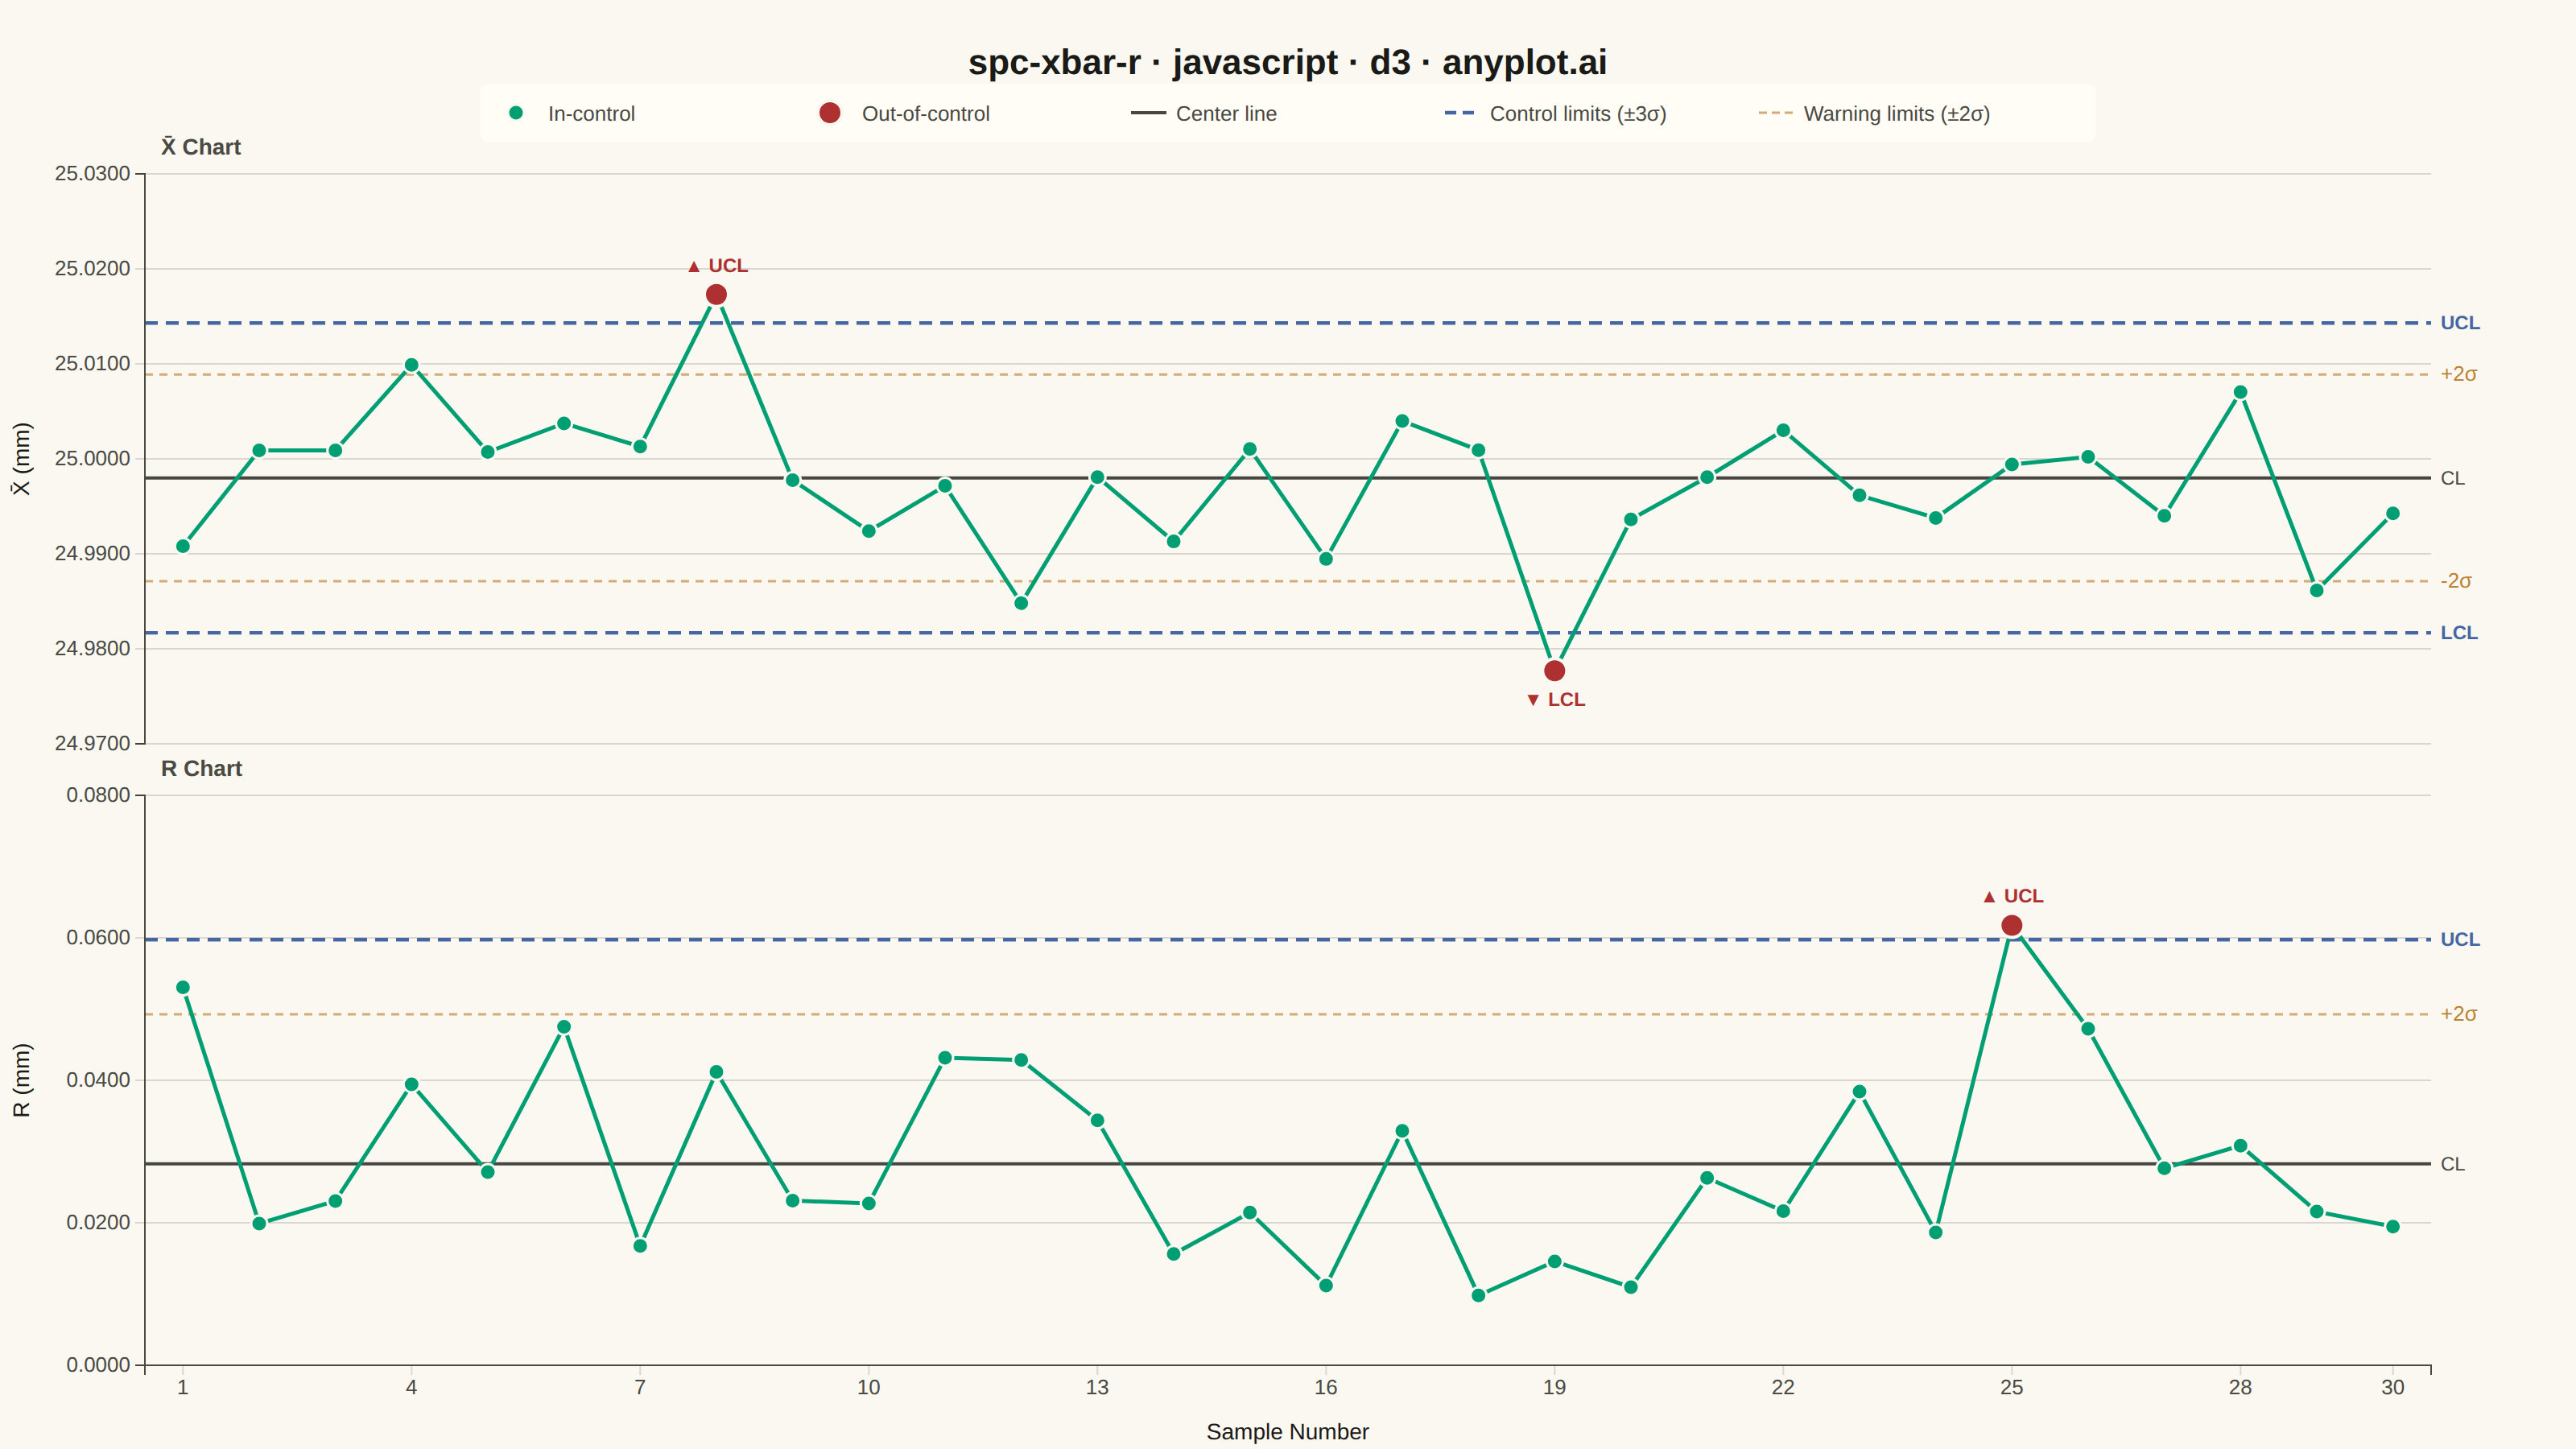
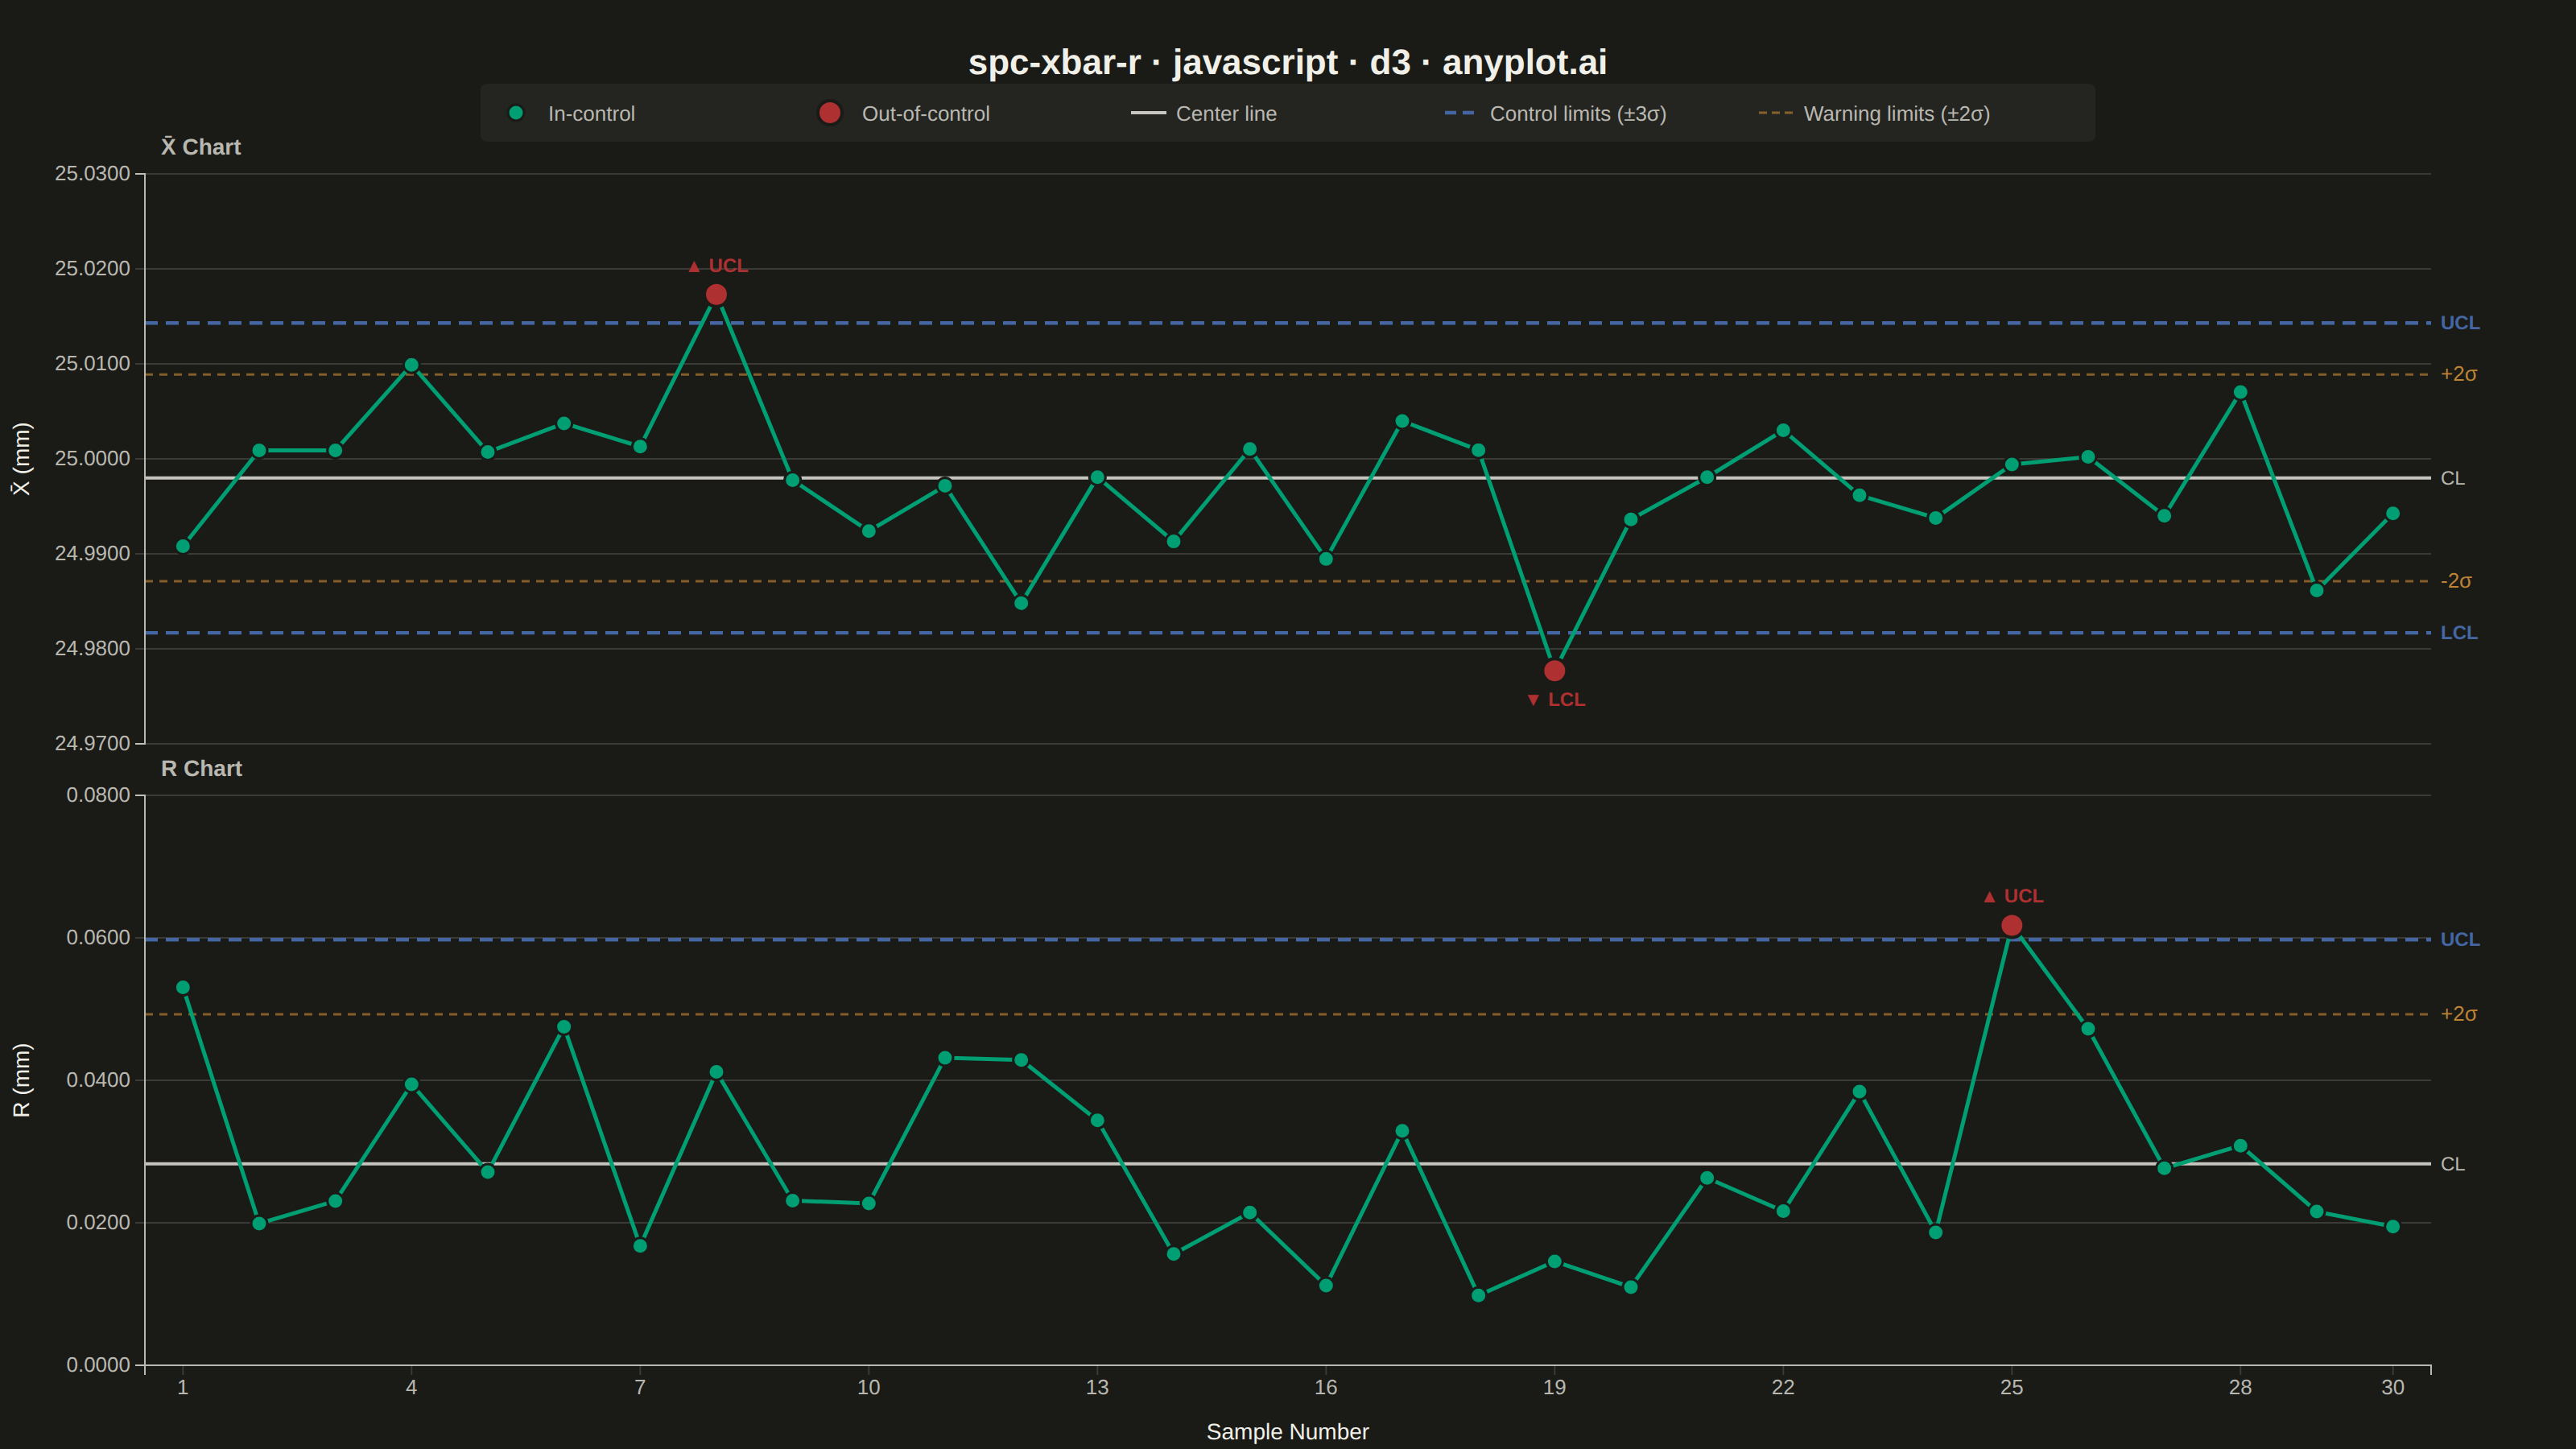
A Statistical Process Control (SPC) chart displaying sample means (X-bar) and ranges (R) plotted over time against control limits. The chart includes a center line representing the process mean, Upper Control Limit (UCL) and Lower Control Limit (LCL) at ±3 sigma, and optional warning limits at ±2 sigma. Out-of-control points are highlighted to signal process instability. This is a fundamental tool in manufacturing quality control and Six Sigma methodology for monitoring process stability.
// anyplot.ai
// spc-xbar-r: Statistical Process Control Chart (X-bar/R)
// Library: d3 7.9.0 | JavaScript 22.22.3
// Quality: 90/100 | Created: 2026-06-20

const t = window.ANYPLOT_TOKENS;
const { width, height } = window.ANYPLOT_SIZE;

// SPC constants for subgroup size n=5; D3=0 so LCL_R excluded
const A2 = 0.577, D4 = 2.114;

// Park-Miller LCG for deterministic, reproducible data
let _s = 42;
function rng() {
  _s = (_s * 16807) % 2147483647;
  return _s / 2147483647;
}
function randn() {
  return Math.sqrt(-2 * Math.log(rng())) * Math.cos(2 * Math.PI * rng());
}

// Generate 30 subgroups of n=5 shaft diameter measurements (mm)
const PROC_MEAN = 25.0, SIGMA_W = 0.012, N_SUB = 5, N_SAMP = 30;

const rawSamples = Array.from({ length: N_SAMP }, (_, i) => {
  const vals = Array.from({ length: N_SUB }, () => PROC_MEAN + SIGMA_W * randn());
  return {
    id: i + 1,
    mean: vals.reduce((a, b) => a + b) / N_SUB,
    range: Math.max(...vals) - Math.min(...vals),
  };
});

// Baseline control limits (computed from all in-control samples)
const xbarBar = rawSamples.reduce((a, d) => a + d.mean, 0) / N_SAMP;
const rBar    = rawSamples.reduce((a, d) => a + d.range, 0) / N_SAMP;
const xbarUCL = xbarBar + A2 * rBar;
const xbarLCL = xbarBar - A2 * rBar;
const xbarUWL = xbarBar + A2 * rBar * (2 / 3);
const xbarLWL = xbarBar - A2 * rBar * (2 / 3);
const rUCL    = D4 * rBar;
const rUWL    = rBar + (D4 - 1) * rBar * (2 / 3);

// Clone and inject 3 out-of-control signals
const samples = rawSamples.map(d => ({ ...d }));
samples[7].mean   = xbarUCL + 0.003;  // sample 8  — X̄ above UCL
samples[18].mean  = xbarLCL - 0.004;  // sample 19 — X̄ below LCL
samples[24].range = rUCL    + 0.002;  // sample 25 — R above UCL

samples.forEach(d => {
  d.xOOC = d.mean  > xbarUCL || d.mean  < xbarLCL;
  d.rOOC = d.range > rUCL;
});

// Layout — increased top margin for proper legend-to-panel breathing room
const margin = { top: 108, right: 90, bottom: 52, left: 90 };
const gap    = 32;
const panelH = Math.floor((height - margin.top - margin.bottom - gap) / 2);
const iw     = width - margin.left - margin.right;

// Imprint palette colors
const DATA_COLOR  = t.palette[0];  // #009E73 brand green — in-control data
const OOC_COLOR   = t.palette[4];  // #AE3030 matte red  — out-of-control
const LIMIT_COLOR = t.palette[2];  // #4467A3 blue       — UCL/LCL lines
const WARN_COLOR  = t.palette[3];  // #BD8233 ochre      — ±2σ warning limits

// SVG root
const svg = d3.select("#container").append("svg")
  .attr("width", width).attr("height", height);

// Chart title
svg.append("text")
  .attr("x", width / 2).attr("y", 46)
  .attr("text-anchor", "middle")
  .attr("fill", t.ink).style("font-size", "22px").style("font-weight", "600")
  .text("spc-xbar-r · javascript · d3 · anyplot.ai");

// Shared x-scale across both panels (discrete sample IDs)
const xScale = d3.scalePoint()
  .domain(samples.map(d => d.id))
  .range([0, iw])
  .padding(0.5);

// Horizontal legend row between title and panels
const legendItems = [
  { color: DATA_COLOR,  type: "circle",    label: "In-control" },
  { color: OOC_COLOR,   type: "circle-lg", label: "Out-of-control" },
  { color: t.ink,       type: "solid",     label: "Center line" },
  { color: LIMIT_COLOR, type: "dash",      label: "Control limits (±3σ)" },
  { color: WARN_COLOR,  type: "warn",      label: "Warning limits (±2σ)" },
];
const legStep  = 195;
const legStart = (width - legendItems.length * legStep) / 2;
const legY     = 70;

// Elevated background behind legend row
svg.append("rect")
  .attr("x", legStart - 14).attr("y", legY - 18)
  .attr("width", legendItems.length * legStep + 28).attr("height", 36)
  .attr("fill", t.elevatedBg).attr("rx", 4);

legendItems.forEach((item, i) => {
  const lx = legStart + i * legStep;
  if (item.type === "circle") {
    svg.append("circle").attr("cx", lx + 8).attr("cy", legY)
      .attr("r", 5).attr("fill", item.color).attr("stroke", t.pageBg).attr("stroke-width", 1.5);
  } else if (item.type === "circle-lg") {
    svg.append("circle").attr("cx", lx + 8).attr("cy", legY)
      .attr("r", 7.5).attr("fill", item.color).attr("stroke", t.pageBg).attr("stroke-width", 2);
  } else if (item.type === "solid") {
    svg.append("line").attr("x1", lx).attr("x2", lx + 22)
      .attr("y1", legY).attr("y2", legY)
      .attr("stroke", item.color).attr("stroke-width", 2).attr("opacity", 0.8);
  } else if (item.type === "dash") {
    svg.append("line").attr("x1", lx).attr("x2", lx + 22)
      .attr("y1", legY).attr("y2", legY)
      .attr("stroke", item.color).attr("stroke-width", 2.2).attr("stroke-dasharray", "7,4");
  } else if (item.type === "warn") {
    svg.append("line").attr("x1", lx).attr("x2", lx + 22)
      .attr("y1", legY).attr("y2", legY)
      .attr("stroke", item.color).attr("stroke-width", 1.5)
      .attr("stroke-dasharray", "5,3").attr("opacity", 0.65);
  }
  svg.append("text").attr("x", lx + 28).attr("y", legY + 5)
    .attr("fill", t.inkSoft).style("font-size", "13px").text(item.label);
});

// Draw a single SPC panel (X̄ or R)
function drawPanel(panelTop, yScale, getVal, isOOC, opts) {
  const g = svg.append("g")
    .attr("transform", `translate(${margin.left},${panelTop})`);

  // Y gridlines
  yScale.ticks(5).forEach(tick => {
    g.append("line")
      .attr("x1", 0).attr("x2", iw)
      .attr("y1", yScale(tick)).attr("y2", yScale(tick))
      .attr("stroke", t.grid).attr("stroke-width", 1);
  });

  // Upper warning limit
  if (opts.uwl !== undefined) {
    const wy = yScale(opts.uwl);
    g.append("line").attr("x1", 0).attr("x2", iw).attr("y1", wy).attr("y2", wy)
      .attr("stroke", WARN_COLOR).attr("stroke-width", 1.5)
      .attr("stroke-dasharray", "5,4").attr("opacity", 0.65);
    g.append("text").attr("x", iw + 6).attr("y", wy + 4)
      .attr("fill", WARN_COLOR).style("font-size", "13px").text("+2σ");
  }

  // Lower warning limit
  if (opts.lwl !== undefined) {
    const ly = yScale(opts.lwl);
    g.append("line").attr("x1", 0).attr("x2", iw).attr("y1", ly).attr("y2", ly)
      .attr("stroke", WARN_COLOR).attr("stroke-width", 1.5)
      .attr("stroke-dasharray", "5,4").attr("opacity", 0.65);
    g.append("text").attr("x", iw + 6).attr("y", ly + 4)
      .attr("fill", WARN_COLOR).style("font-size", "13px").text("-2σ");
  }

  // UCL
  const uy = yScale(opts.ucl);
  g.append("line").attr("x1", 0).attr("x2", iw).attr("y1", uy).attr("y2", uy)
    .attr("stroke", LIMIT_COLOR).attr("stroke-width", 2.2).attr("stroke-dasharray", "8,5");
  g.append("text").attr("x", iw + 6).attr("y", uy + 4)
    .attr("fill", LIMIT_COLOR).style("font-size", "12px").style("font-weight", "600").text("UCL");

  // LCL (X̄ chart only — R chart LCL = 0 for n=5, not plotted)
  if (opts.showLcl) {
    const lcy = yScale(opts.lcl);
    g.append("line").attr("x1", 0).attr("x2", iw).attr("y1", lcy).attr("y2", lcy)
      .attr("stroke", LIMIT_COLOR).attr("stroke-width", 2.2).attr("stroke-dasharray", "8,5");
    g.append("text").attr("x", iw + 6).attr("y", lcy + 4)
      .attr("fill", LIMIT_COLOR).style("font-size", "12px").style("font-weight", "600").text("LCL");
  }

  // Center line — increased opacity for legibility in dark theme
  const cy = yScale(opts.cl);
  g.append("line").attr("x1", 0).attr("x2", iw).attr("y1", cy).attr("y2", cy)
    .attr("stroke", t.ink).attr("stroke-width", 2).attr("opacity", 0.8);
  g.append("text").attr("x", iw + 6).attr("y", cy + 4)
    .attr("fill", t.inkSoft).style("font-size", "12px").text("CL");

  // Data line connecting all sample points
  g.append("path")
    .datum(samples)
    .attr("fill", "none").attr("stroke", DATA_COLOR).attr("stroke-width", 2.5)
    .attr("d", d3.line().x(d => xScale(d.id)).y(d => yScale(getVal(d))));

  // In-control points
  g.selectAll(".ic").data(samples.filter(d => !isOOC(d))).join("circle")
    .attr("class", "ic")
    .attr("cx", d => xScale(d.id)).attr("cy", d => yScale(getVal(d)))
    .attr("r", 5).attr("fill", DATA_COLOR)
    .attr("stroke", t.pageBg).attr("stroke-width", 1.5);

  // Out-of-control points (larger, red)
  g.selectAll(".oc").data(samples.filter(d => isOOC(d))).join("circle")
    .attr("class", "oc")
    .attr("cx", d => xScale(d.id)).attr("cy", d => yScale(getVal(d)))
    .attr("r", 7.5).attr("fill", OOC_COLOR)
    .attr("stroke", t.pageBg).attr("stroke-width", 2);

  // OOC event annotations — label each violation with which limit was breached
  samples.filter(d => isOOC(d)).forEach(d => {
    const px = xScale(d.id);
    const py = yScale(getVal(d));
    const above = getVal(d) > opts.cl;
    g.append("text")
      .attr("x", px).attr("y", above ? py - 14 : py + 22)
      .attr("text-anchor", "middle")
      .attr("fill", OOC_COLOR).style("font-size", "12px").style("font-weight", "700")
      .text(above ? "▲ UCL" : "▼ LCL");
  });

  // Y axis
  const ax = g.append("g").call(
    d3.axisLeft(yScale).ticks(5).tickFormat(d3.format(".4f"))
  );
  ax.selectAll("text").attr("fill", t.inkSoft).style("font-size", "13px");
  ax.selectAll("line").attr("stroke", t.grid);
  ax.select(".domain").attr("stroke", t.inkSoft);

  // Y axis label (rotated)
  g.append("text")
    .attr("transform", "rotate(-90)")
    .attr("x", -panelH / 2).attr("y", -72)
    .attr("text-anchor", "middle")
    .attr("fill", t.ink).style("font-size", "14px").style("font-weight", "500")
    .text(opts.yLabel);

  // Panel header label
  g.append("text")
    .attr("x", 10).attr("y", -12)
    .attr("fill", t.inkSoft).style("font-size", "14px").style("font-weight", "600")
    .text(opts.title);
}

// X̄ panel (top)
const xPad  = (xbarUCL - xbarLCL) * 0.35;
const yXbar = d3.scaleLinear()
  .domain([xbarLCL - xPad, xbarUCL + xPad]).nice()
  .range([panelH, 0]);

drawPanel(
  margin.top, yXbar,
  d => d.mean, d => d.xOOC,
  { cl: xbarBar, ucl: xbarUCL, lcl: xbarLCL, showLcl: true,
    uwl: xbarUWL, lwl: xbarLWL, yLabel: "X̄ (mm)", title: "X̄ Chart" }
);

// R panel (bottom)
const rPad      = rUCL * 0.28;
const rPanelTop = margin.top + panelH + gap;
const yR        = d3.scaleLinear()
  .domain([0, rUCL + rPad]).nice()
  .range([panelH, 0]);

drawPanel(
  rPanelTop, yR,
  d => d.range, d => d.rOOC,
  { cl: rBar, ucl: rUCL, lcl: 0, showLcl: false,
    uwl: rUWL, lwl: undefined, yLabel: "R (mm)", title: "R Chart" }
);

// Shared X axis at the bottom of the R panel
const xTickVals = samples.filter((_, i) => i % 3 === 0 || i === N_SAMP - 1).map(d => d.id);
const gXAxis = svg.append("g")
  .attr("transform", `translate(${margin.left},${rPanelTop + panelH})`);
const xAxisG = gXAxis.call(d3.axisBottom(xScale).tickValues(xTickVals));
xAxisG.selectAll("text").attr("fill", t.inkSoft).style("font-size", "13px");
xAxisG.selectAll("line").attr("stroke", t.grid);
xAxisG.select(".domain").attr("stroke", t.inkSoft);

// X axis label
svg.append("text")
  .attr("x", margin.left + iw / 2)
  .attr("y", rPanelTop + panelH + 46)
  .attr("text-anchor", "middle")
  .attr("fill", t.ink).style("font-size", "14px").style("font-weight", "500")
  .text("Sample Number");
Runnable source as JSON, for any HTTP client: https://api.anyplot.ai/specs/spc-xbar-r/d3/code. Any spec id and library id listed in llms-full.txt fit the same URL shape; every URL below is complete and callable.
{
  "spec_id": "spc-xbar-r",
  "language": "javascript",
  "library": "d3",
  "page": "https://anyplot.ai/spc-xbar-r/javascript/d3",
  "hub": "https://anyplot.ai/spc-xbar-r",
  "code_json": "https://api.anyplot.ai/specs/spc-xbar-r/d3/code",
  "spec_json": "https://api.anyplot.ai/specs/spc-xbar-r",
  "render_light_png": "https://storage.googleapis.com/anyplot-images/plots/spc-xbar-r/javascript/d3/plot-light.png",
  "render_dark_png": "https://storage.googleapis.com/anyplot-images/plots/spc-xbar-r/javascript/d3/plot-dark.png",
  "interactive_light_html": "https://storage.googleapis.com/anyplot-images/plots/spc-xbar-r/javascript/d3/plot-light.html",
  "interactive_dark_html": "https://storage.googleapis.com/anyplot-images/plots/spc-xbar-r/javascript/d3/plot-dark.html",
  "quality_score": 90.0,
  "license": "MIT",
  "guide": "https://anyplot.ai/llms.txt"
}
Part of Statistical Process Control Chart (X-bar/R) on anyplot.ai.