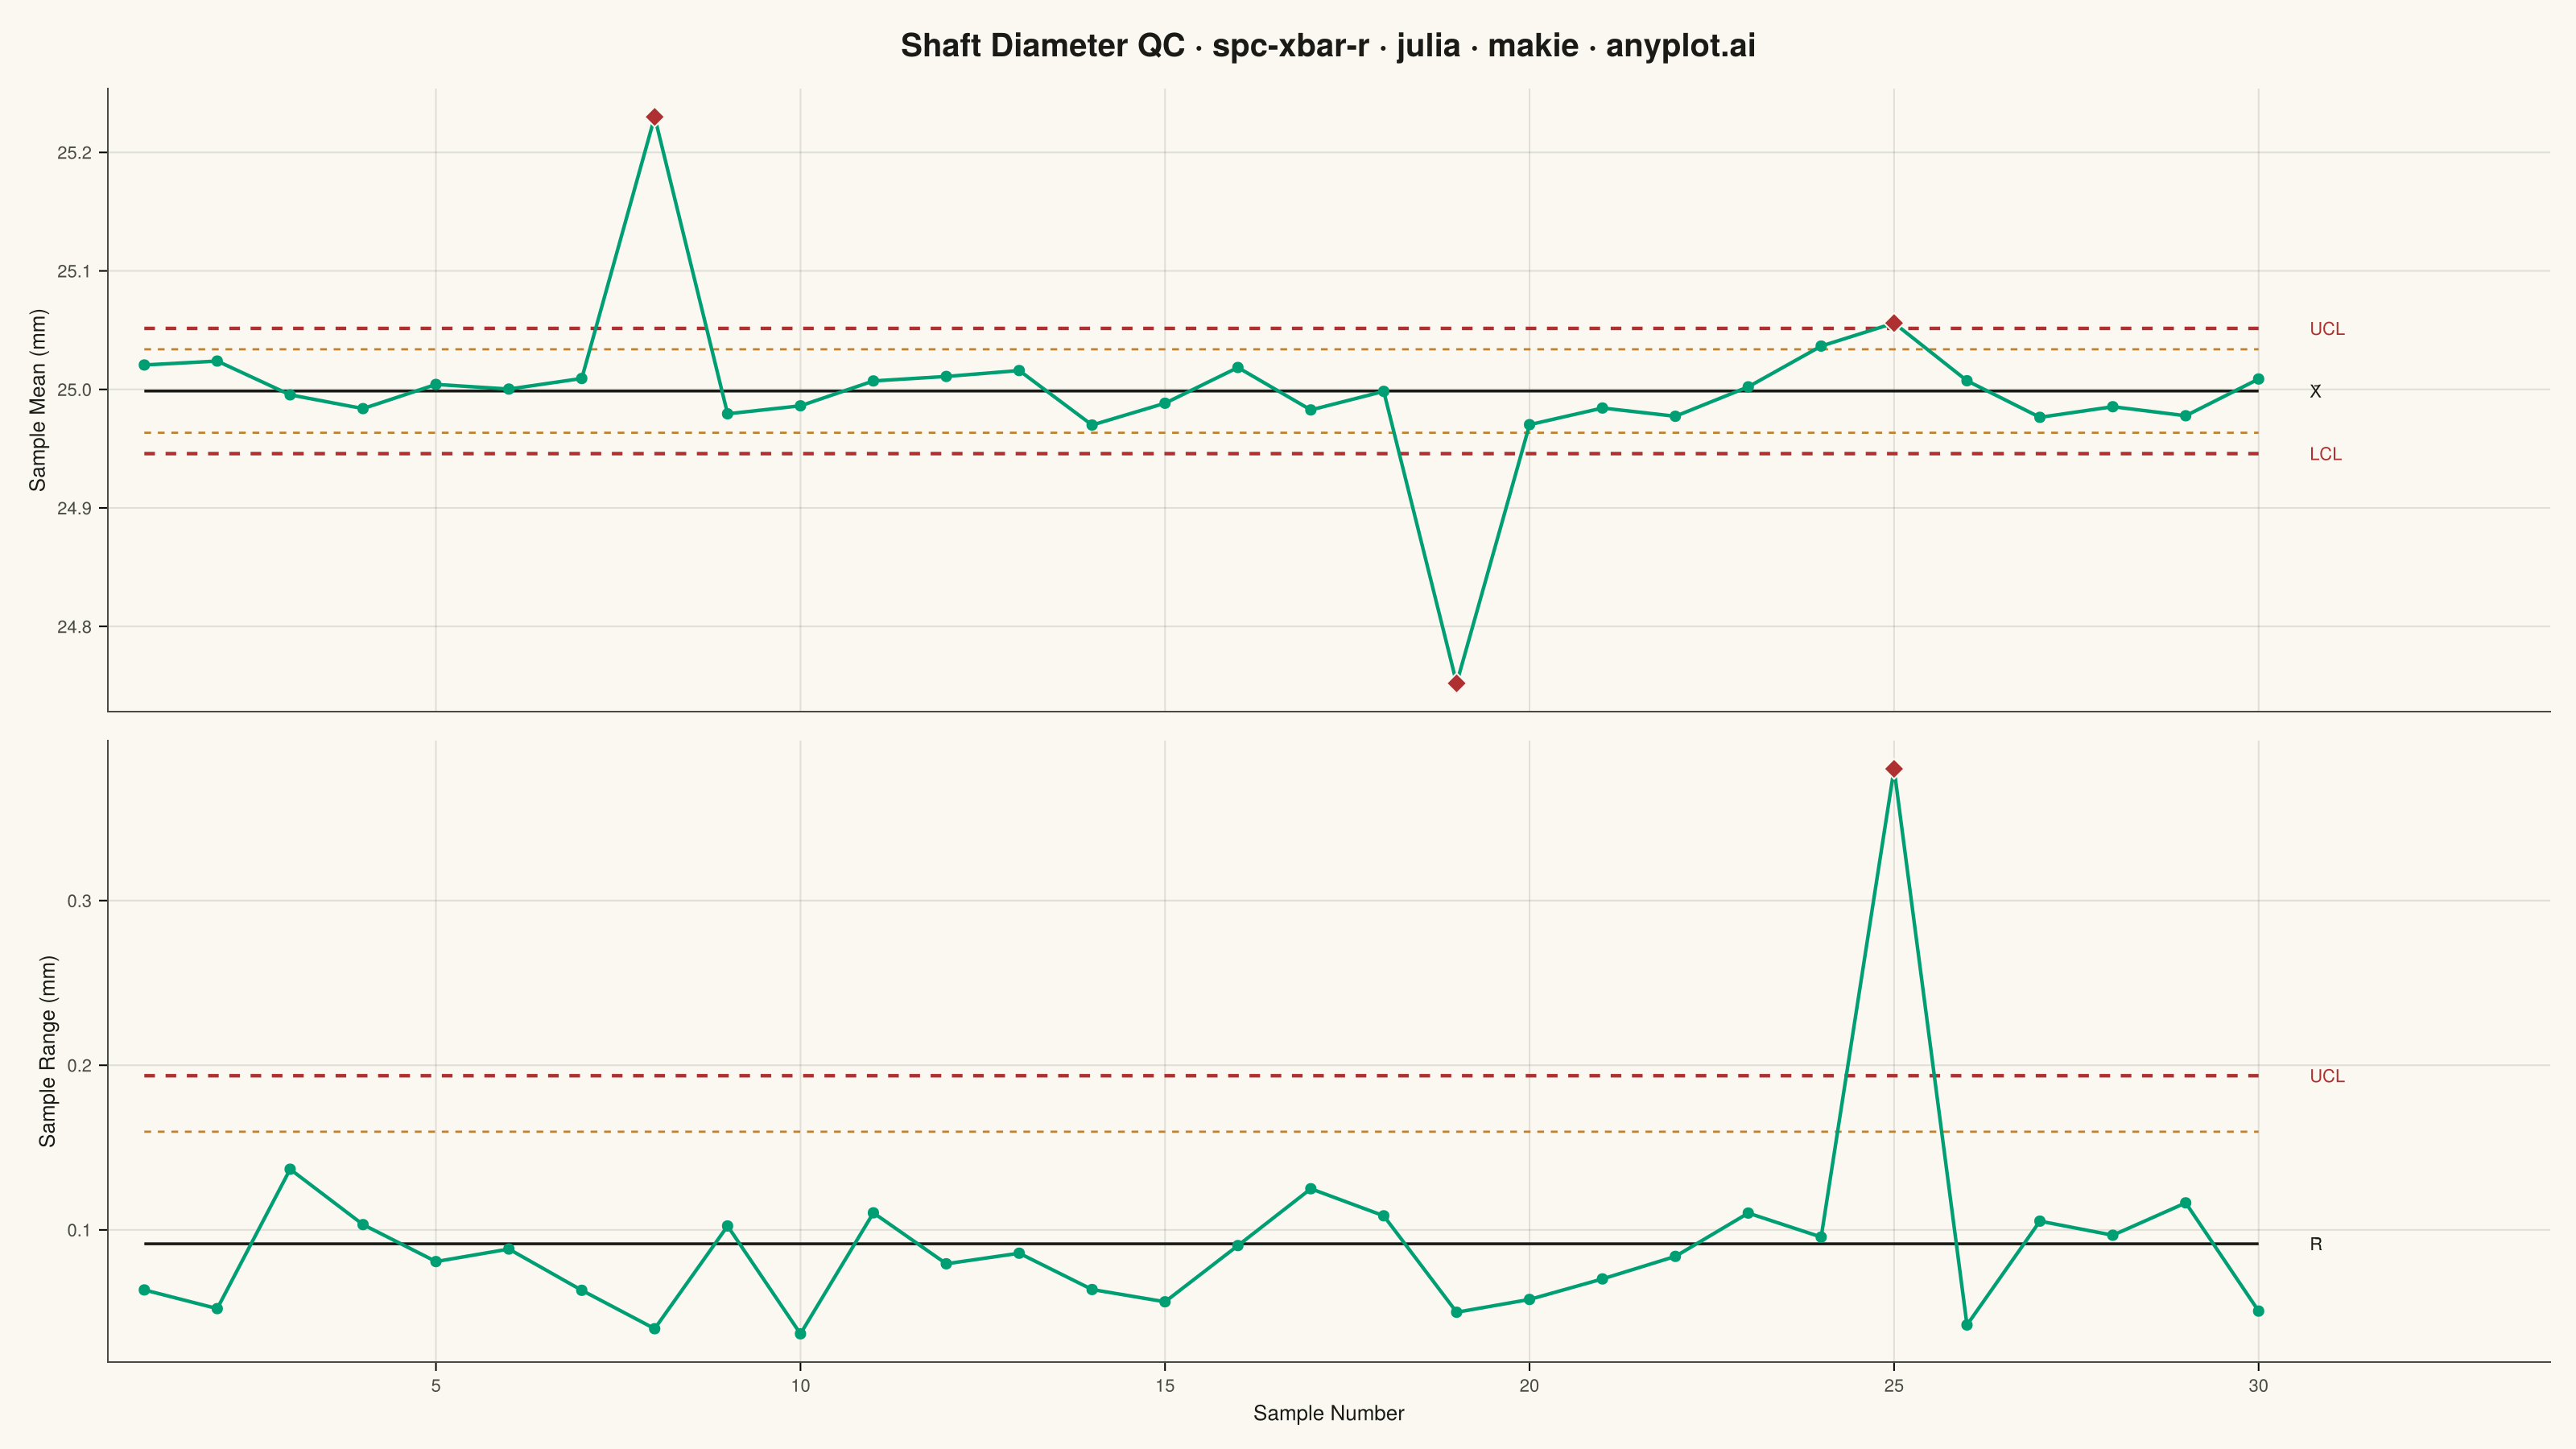
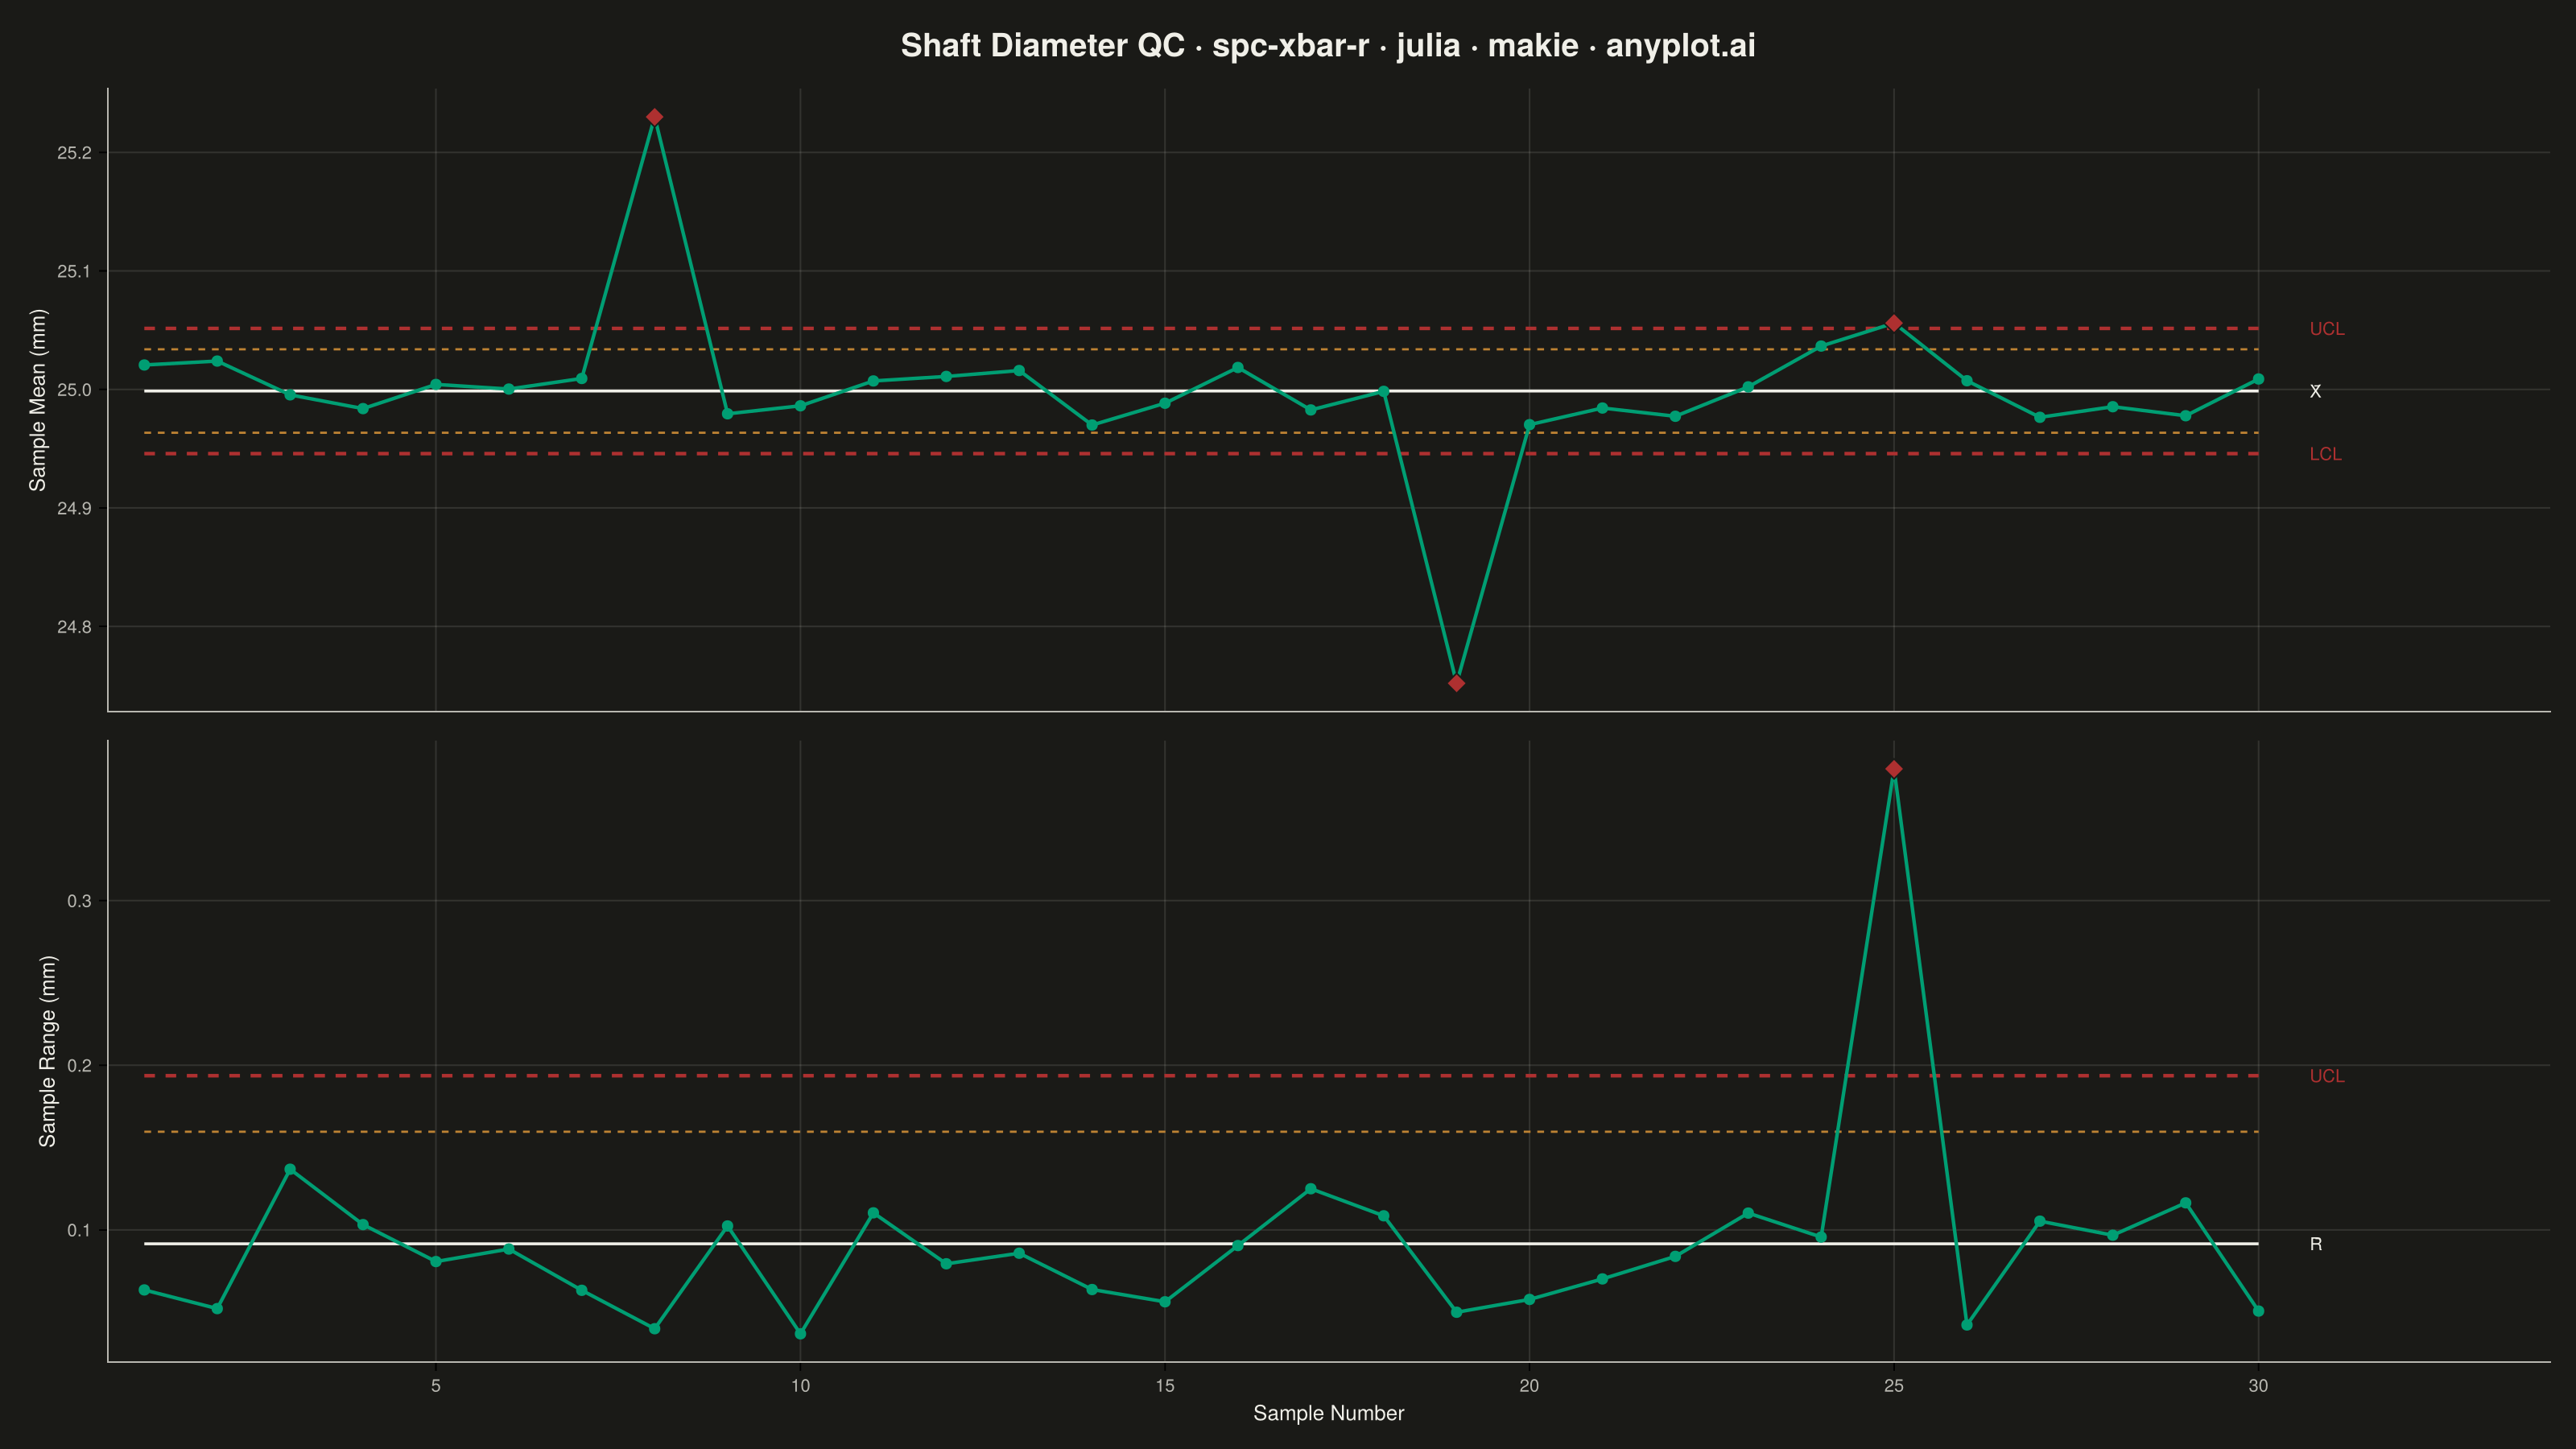
A Statistical Process Control (SPC) chart displaying sample means (X-bar) and ranges (R) plotted over time against control limits. The chart includes a center line representing the process mean, Upper Control Limit (UCL) and Lower Control Limit (LCL) at ±3 sigma, and optional warning limits at ±2 sigma. Out-of-control points are highlighted to signal process instability. This is a fundamental tool in manufacturing quality control and Six Sigma methodology for monitoring process stability.
# anyplot.ai
# spc-xbar-r: Statistical Process Control Chart (X-bar/R)
# Library: makie 0.22.10 | Julia 1.11.9
# Quality: 88/100 | Created: 2026-06-20

using CairoMakie
using Colors
using Random
using Statistics

Random.seed!(42)

# Theme tokens
const THEME       = get(ENV, "ANYPLOT_THEME", "light")
const PAGE_BG     = THEME == "light" ? colorant"#FAF8F1" : colorant"#1A1A17"
const ELEVATED_BG = THEME == "light" ? colorant"#FFFDF6" : colorant"#242420"
const INK         = THEME == "light" ? colorant"#1A1A17" : colorant"#F0EFE8"
const INK_SOFT    = THEME == "light" ? colorant"#4A4A44" : colorant"#B8B7B0"

const IMPRINT_PALETTE = [
    colorant"#009E73",   # 1 — brand green (first series)
    colorant"#C475FD",   # 2 — lavender
    colorant"#4467A3",   # 3 — blue
    colorant"#BD8233",   # 4 — ochre
    colorant"#AE3030",   # 5 — matte red (control limits / out-of-control)
    colorant"#2ABCCD",   # 6 — cyan
    colorant"#954477",   # 7 — rose
    colorant"#99B314",   # 8 — lime
]
const ANYPLOT_AMBER = colorant"#DDCC77"  # warning / caution semantic anchor

# SPC control chart constants for subgroup size n = 5
const n_sub = 5
const A2    = 0.577    # X-bar ±3σ factor
const D4    = 2.115    # R-chart UCL factor
const d2    = 2.326    # unbiasing constant (R-bar → σ estimate)

# Data: shaft diameter measurements (mm) — CNC machining, 30 subgroups × 5 parts
const n_samples = 30
measurements = 25.00 .+ 0.04 .* randn(n_samples, n_sub)

# Inject known out-of-control signals at fixed positions
measurements[8, :]  = [25.22, 25.24, 25.21, 25.23, 25.25]    # X-bar above UCL
measurements[19, :] = [24.74, 24.76, 24.73, 24.78, 24.75]    # X-bar below LCL
measurements[25, :] = [24.92, 25.28, 24.90, 25.24, 24.94]    # Wide range → R above UCL

# Subgroup statistics
sample_means  = [mean(measurements[i, :]) for i in 1:n_samples]
sample_ranges = [maximum(measurements[i, :]) - minimum(measurements[i, :]) for i in 1:n_samples]

x_bar_bar = mean(sample_means)
r_bar     = mean(sample_ranges)

# X-bar control limits (±3σ) and warning limits (±2σ)
ucl_xbar   = x_bar_bar + A2 * r_bar
lcl_xbar   = x_bar_bar - A2 * r_bar
sigma_xbar = r_bar / (d2 * sqrt(n_sub))
uwl_xbar   = x_bar_bar + 2.0 * sigma_xbar
lwl_xbar   = x_bar_bar - 2.0 * sigma_xbar

# R chart control limits (LCL=0 when D3=0 for n<7; only show UCL and warning)
ucl_r = D4 * r_bar
uwl_r = r_bar + (2.0 / 3.0) * (ucl_r - r_bar)

# Out-of-control point indices
ooc_xbar     = findall(m -> m > ucl_xbar || m < lcl_xbar, sample_means)
in_ctrl_xbar = findall(m -> lcl_xbar <= m <= ucl_xbar, sample_means)
ooc_r        = findall(r -> r > ucl_r, sample_ranges)
in_ctrl_r    = findall(r -> r <= ucl_r, sample_ranges)

xs      = collect(1:n_samples)
x_right = Float64(n_samples) + 0.7    # x-position for right-edge limit labels

# Title (length scaling: only shrink if > 67 chars)
title_str = "Shaft Diameter QC · spc-xbar-r · julia · makie · anyplot.ai"
n_chars   = length(title_str)
ratio     = n_chars > 67 ? 67.0 / n_chars : 1.0
title_fs  = max(14, round(Int, 20.0 * ratio))

grid_c = RGBAf(INK.r, INK.g, INK.b, 0.12f0)

# Figure — landscape 3200 × 1800 (resolution × px_per_unit = 2)
fig = Figure(
    size            = (1600, 900),
    fontsize        = 14,
    backgroundcolor = PAGE_BG,
)

Label(fig[0, 1],
    title_str;
    fontsize  = title_fs,
    color     = INK,
    font      = :bold,
    halign    = :center,
    tellwidth = false,
)

# X-bar Axis (top panel — x tick labels hidden; shared via linkxaxes!)
ax_xbar = Axis(fig[1, 1];
    backgroundcolor    = PAGE_BG,
    ylabel             = "Sample Mean (mm)",
    ylabelcolor        = INK,
    ylabelsize         = 14,
    xticklabelsvisible = false,
    xticksize          = 0,
    yticklabelcolor    = INK_SOFT,
    yticklabelsize     = 12,
    topspinevisible    = false,
    rightspinevisible  = false,
    leftspinecolor     = INK_SOFT,
    bottomspinecolor   = INK_SOFT,
    xgridcolor         = grid_c,
    ygridcolor         = grid_c,
    xminorgridvisible  = false,
    yminorgridvisible  = false,
    xticks             = collect(5:5:n_samples),
)

# R Axis (bottom panel — carries x-axis labels)
ax_r = Axis(fig[2, 1];
    backgroundcolor   = PAGE_BG,
    xlabel            = "Sample Number",
    xlabelcolor       = INK,
    xlabelsize        = 14,
    ylabel            = "Sample Range (mm)",
    ylabelcolor       = INK,
    ylabelsize        = 14,
    xticklabelcolor   = INK_SOFT,
    yticklabelcolor   = INK_SOFT,
    xticklabelsize    = 12,
    yticklabelsize    = 12,
    topspinevisible   = false,
    rightspinevisible = false,
    leftspinecolor    = INK_SOFT,
    bottomspinecolor  = INK_SOFT,
    xgridcolor        = grid_c,
    ygridcolor        = grid_c,
    xminorgridvisible = false,
    yminorgridvisible = false,
    xticks            = collect(5:5:n_samples),
)

linkxaxes!(ax_xbar, ax_r)
xlims!(ax_xbar, 0.5, n_samples + 4.0)
xlims!(ax_r, 0.5, n_samples + 4.0)

# --- X-bar chart ---
# Warning limits (±2σ) — amber dashed
lines!(ax_xbar, [1.0, Float64(n_samples)], [uwl_xbar, uwl_xbar];
    color=ANYPLOT_AMBER, linewidth=1.4, linestyle=:dash)
lines!(ax_xbar, [1.0, Float64(n_samples)], [lwl_xbar, lwl_xbar];
    color=ANYPLOT_AMBER, linewidth=1.4, linestyle=:dash)
# Control limits (±3σ) — red dashed
lines!(ax_xbar, [1.0, Float64(n_samples)], [ucl_xbar, ucl_xbar];
    color=IMPRINT_PALETTE[5], linewidth=2.2, linestyle=:dash)
lines!(ax_xbar, [1.0, Float64(n_samples)], [lcl_xbar, lcl_xbar];
    color=IMPRINT_PALETTE[5], linewidth=2.2, linestyle=:dash)
# Center line (X̄-bar) — solid ink
lines!(ax_xbar, [1.0, Float64(n_samples)], [x_bar_bar, x_bar_bar];
    color=INK, linewidth=1.8)
# Data line and markers
lines!(ax_xbar, xs, sample_means; color=IMPRINT_PALETTE[1], linewidth=2.2)
scatter!(ax_xbar, in_ctrl_xbar, sample_means[in_ctrl_xbar];
    color=IMPRINT_PALETTE[1], markersize=10, strokewidth=0)
if !isempty(ooc_xbar)
    scatter!(ax_xbar, ooc_xbar, sample_means[ooc_xbar];
        color=IMPRINT_PALETTE[5], markersize=14, marker=:diamond,
        strokewidth=1, strokecolor=PAGE_BG)
end
# Right-edge limit labels
text!(ax_xbar, x_right, ucl_xbar;
    text="UCL", fontsize=11, color=IMPRINT_PALETTE[5], align=(:left, :center))
text!(ax_xbar, x_right, x_bar_bar;
    text="X̄", fontsize=11, color=INK, align=(:left, :center))
text!(ax_xbar, x_right, lcl_xbar;
    text="LCL", fontsize=11, color=IMPRINT_PALETTE[5], align=(:left, :center))

# --- R chart ---
# Warning limit — amber dashed
lines!(ax_r, [1.0, Float64(n_samples)], [uwl_r, uwl_r];
    color=ANYPLOT_AMBER, linewidth=1.4, linestyle=:dash)
# UCL — red dashed
lines!(ax_r, [1.0, Float64(n_samples)], [ucl_r, ucl_r];
    color=IMPRINT_PALETTE[5], linewidth=2.2, linestyle=:dash)
# Center line (R̄) — solid ink
lines!(ax_r, [1.0, Float64(n_samples)], [r_bar, r_bar];
    color=INK, linewidth=1.8)
# Data line and markers
lines!(ax_r, xs, sample_ranges; color=IMPRINT_PALETTE[1], linewidth=2.2)
scatter!(ax_r, in_ctrl_r, sample_ranges[in_ctrl_r];
    color=IMPRINT_PALETTE[1], markersize=10, strokewidth=0)
if !isempty(ooc_r)
    scatter!(ax_r, ooc_r, sample_ranges[ooc_r];
        color=IMPRINT_PALETTE[5], markersize=14, marker=:diamond,
        strokewidth=1, strokecolor=PAGE_BG)
end
# Right-edge limit labels
text!(ax_r, x_right, ucl_r;
    text="UCL", fontsize=11, color=IMPRINT_PALETTE[5], align=(:left, :center))
text!(ax_r, x_right, r_bar;
    text="R̄", fontsize=11, color=INK, align=(:left, :center))

rowgap!(fig.layout, 1, 16)

save("plot-$(THEME).png", fig; px_per_unit=2)
Runnable source as JSON, for any HTTP client: https://api.anyplot.ai/specs/spc-xbar-r/makie/code. Any spec id and library id listed in llms-full.txt fit the same URL shape; every URL below is complete and callable.
{
  "spec_id": "spc-xbar-r",
  "language": "julia",
  "library": "makie",
  "page": "https://anyplot.ai/spc-xbar-r/julia/makie",
  "hub": "https://anyplot.ai/spc-xbar-r",
  "code_json": "https://api.anyplot.ai/specs/spc-xbar-r/makie/code",
  "spec_json": "https://api.anyplot.ai/specs/spc-xbar-r",
  "render_light_png": "https://storage.googleapis.com/anyplot-images/plots/spc-xbar-r/julia/makie/plot-light.png",
  "render_dark_png": "https://storage.googleapis.com/anyplot-images/plots/spc-xbar-r/julia/makie/plot-dark.png",
  "quality_score": 88.0,
  "license": "MIT",
  "guide": "https://anyplot.ai/llms.txt"
}
Part of Statistical Process Control Chart (X-bar/R) on anyplot.ai.