The same plot in 14 other libraries — JavaScript: D3.js, Apache ECharts, Highcharts, MUI X Charts; Python: Altair, Bokeh, lets-plot, Matplotlib, Plotly, plotnine, Pygal, Seaborn; R: ggplot2; Julia: Makie.jl. Compare all 15 side by side: Mel-Spectrogram for Audio Analysis in Python, R, Julia and JavaScript.
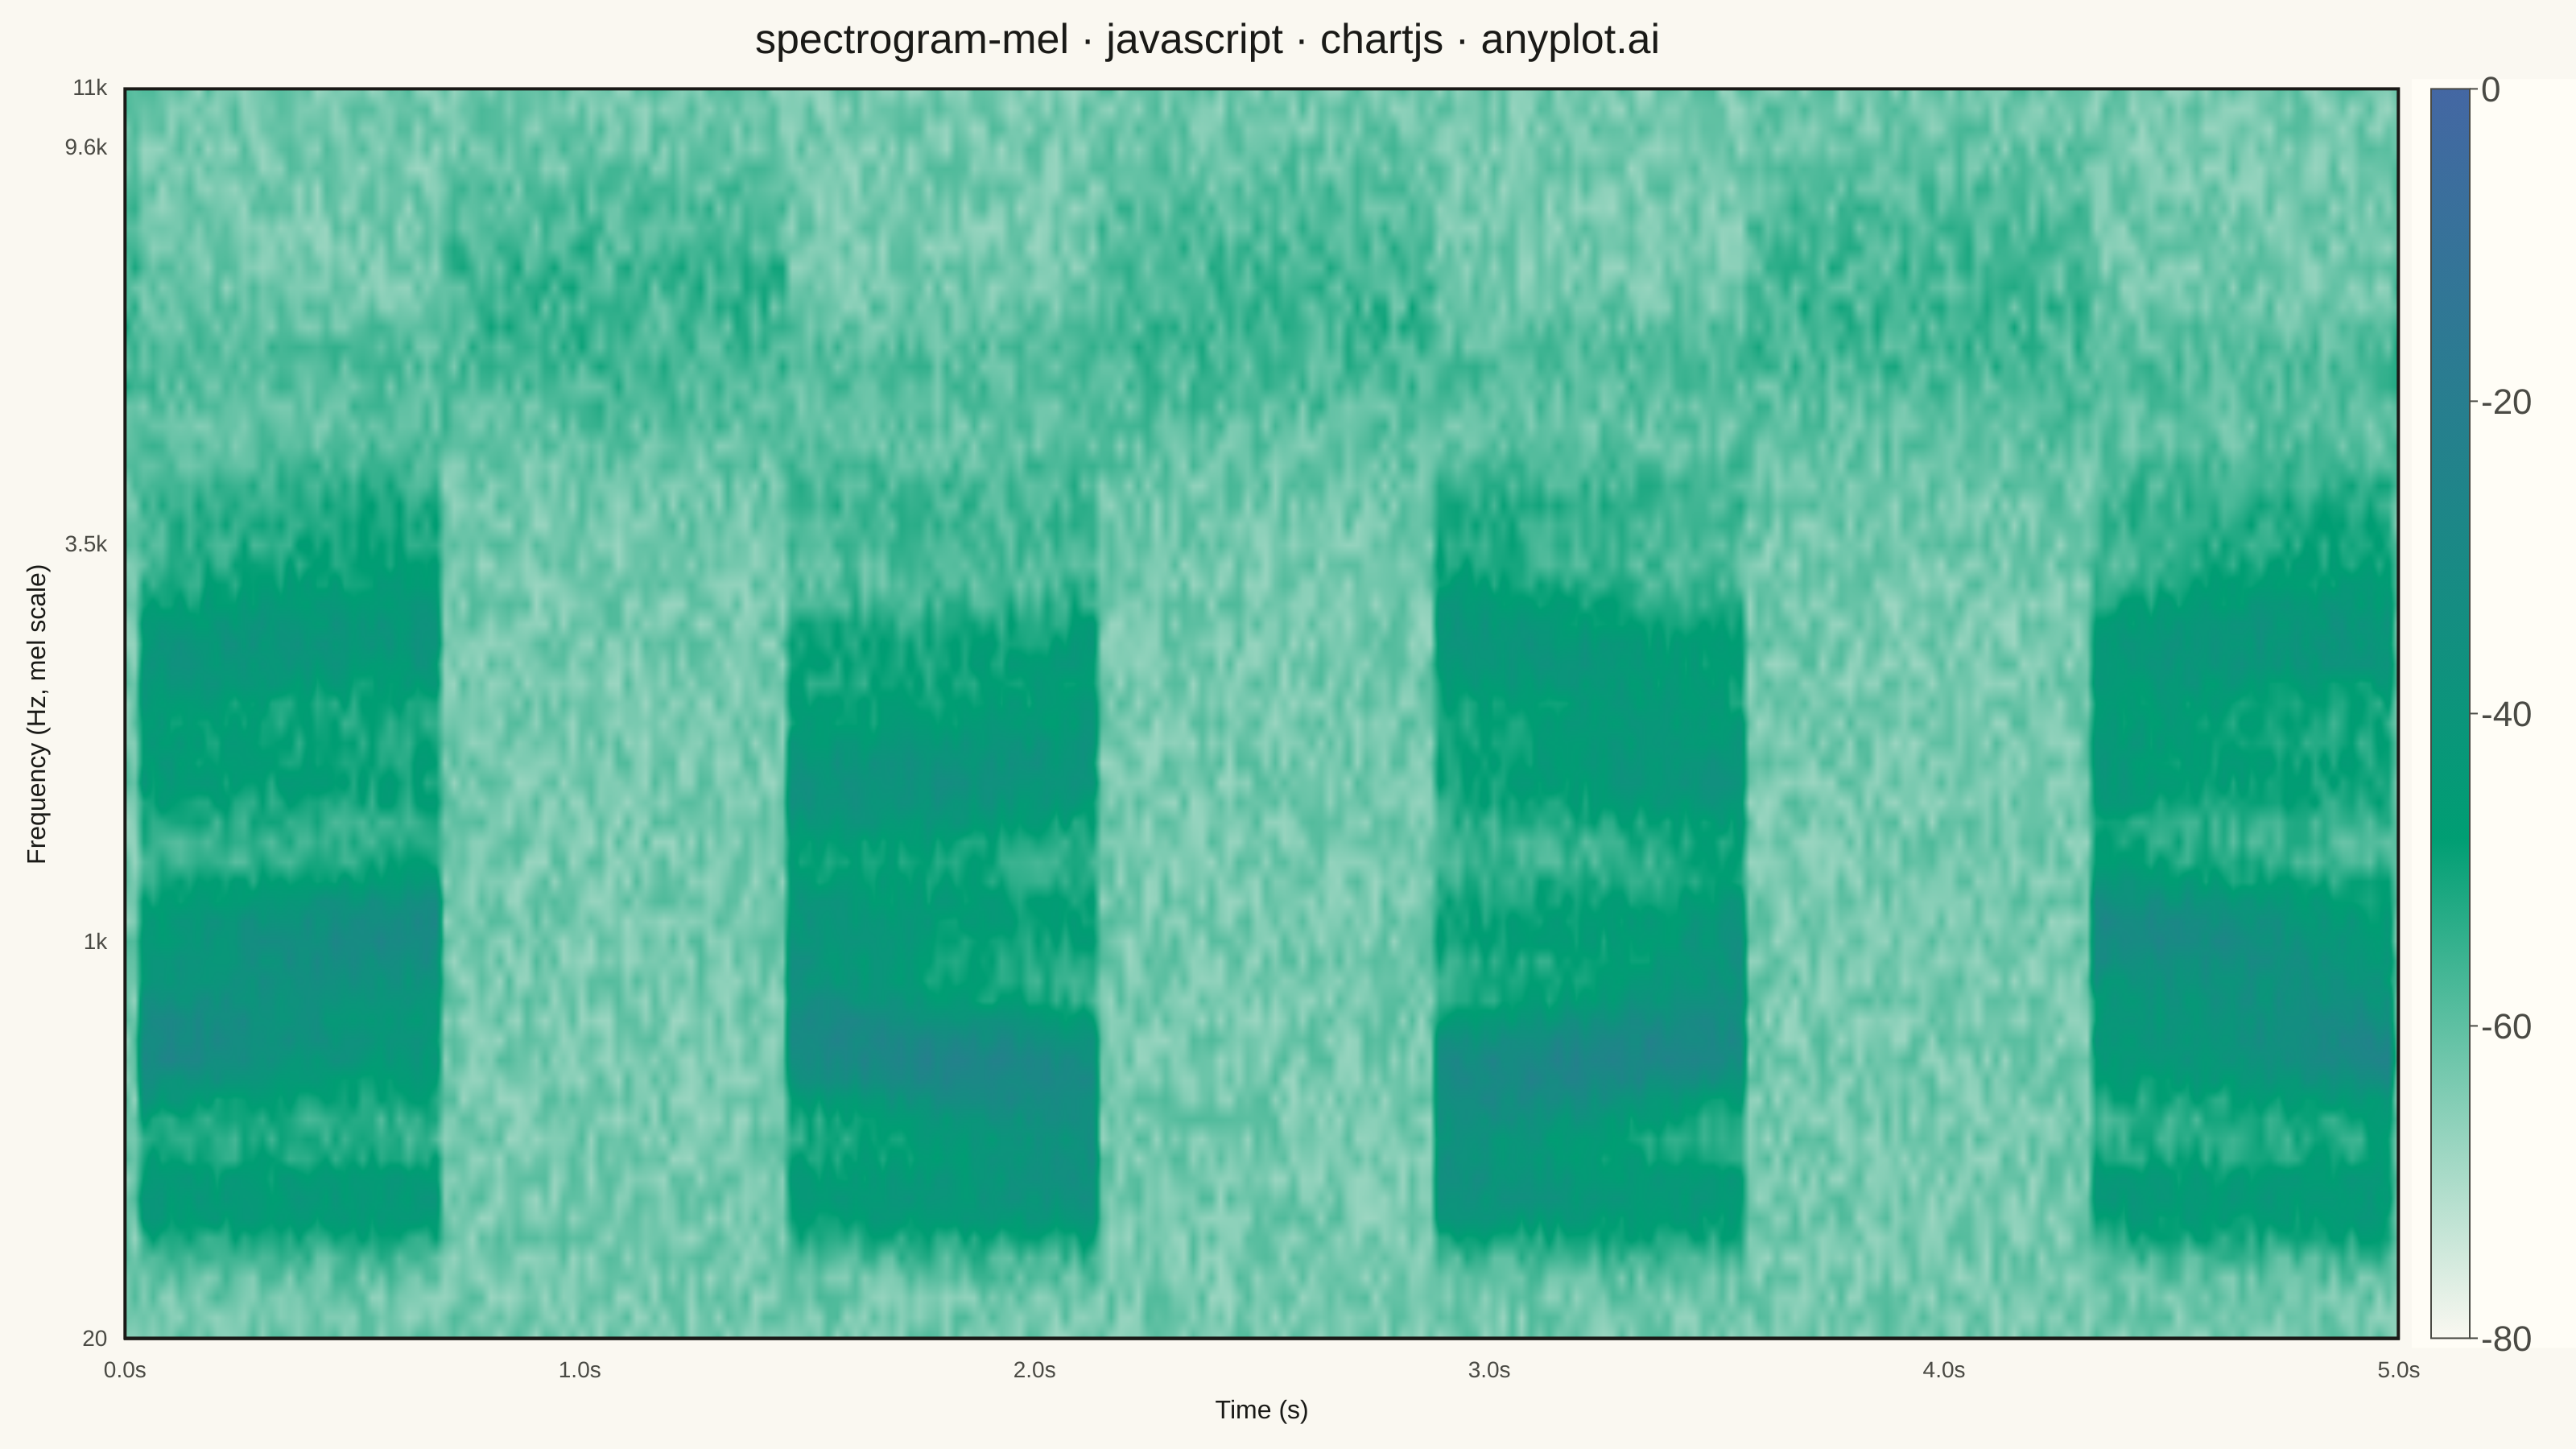
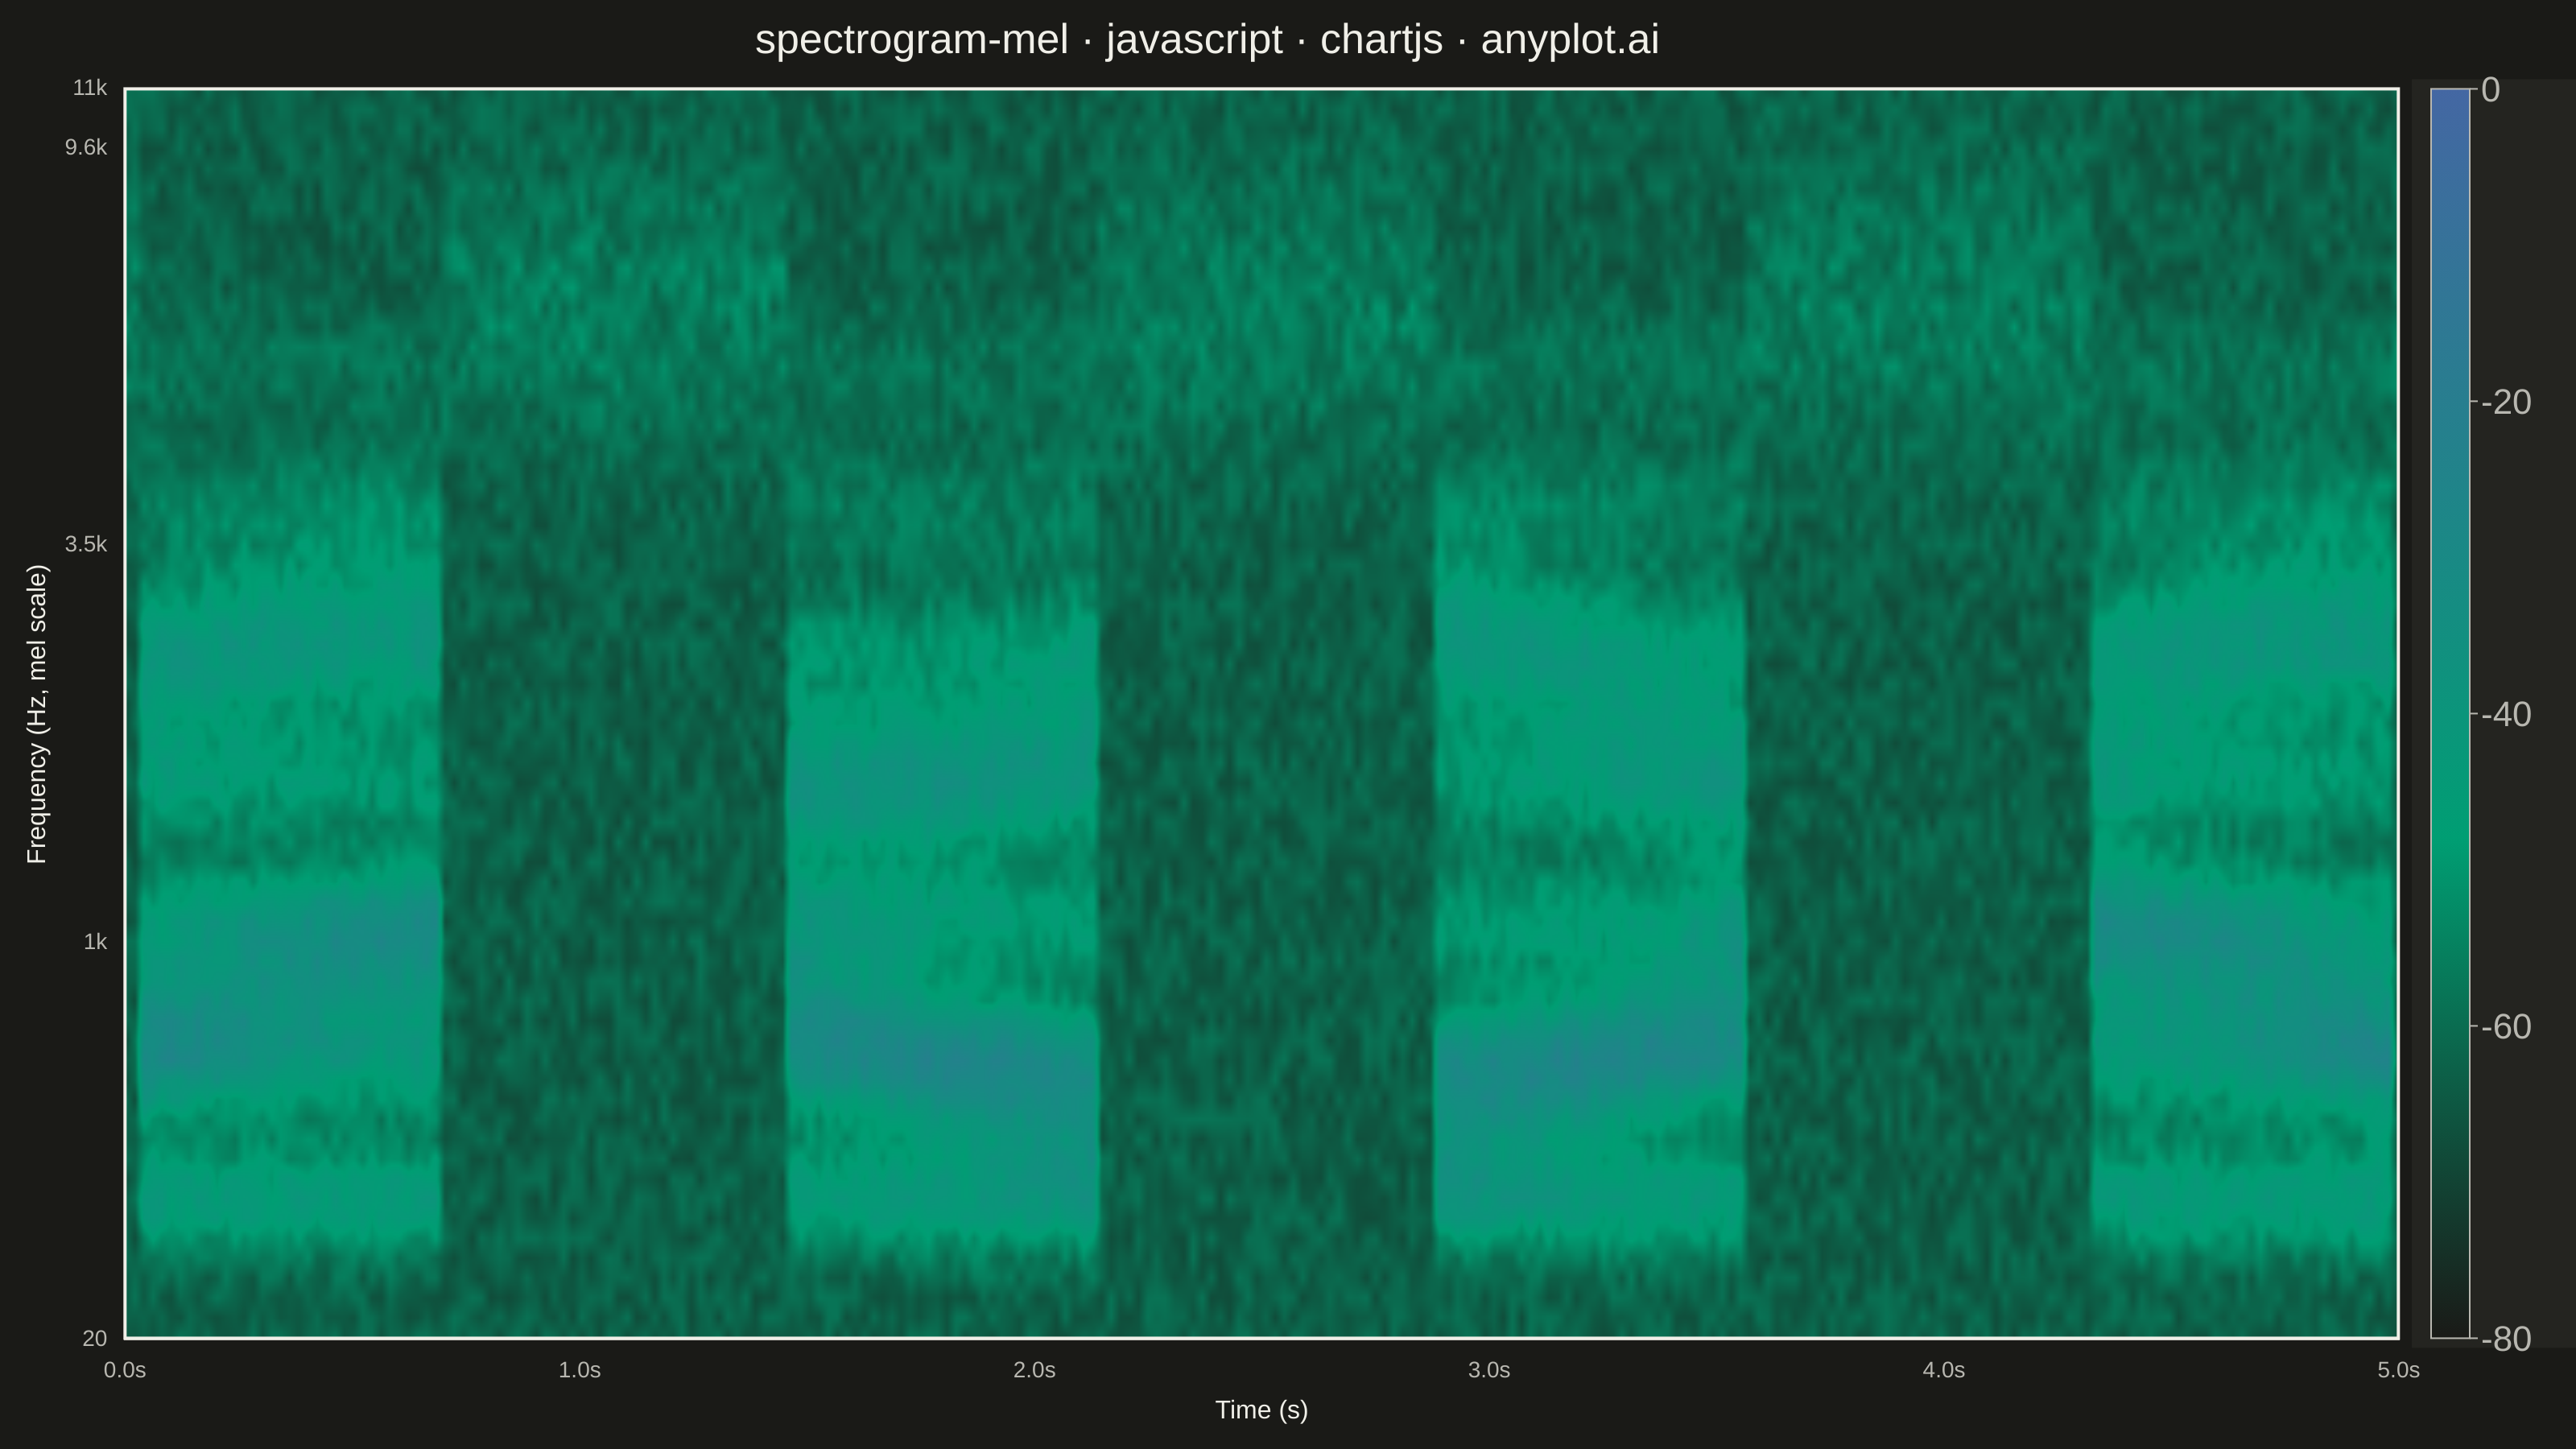
A mel-spectrogram displaying the power spectrum of an audio signal with the frequency axis warped to the mel scale, which approximates human auditory perception. Unlike a standard spectrogram with a linear frequency axis, the mel-spectrogram compresses higher frequencies and expands lower frequencies, making perceptually similar sounds visually closer together. This is the foundational input representation for modern audio machine learning pipelines including speech recognition, speaker identification, and music information retrieval.
// anyplot.ai
// spectrogram-mel: Mel-Spectrogram for Audio Analysis
// Library: chartjs 4.4.7 | JavaScript 22.22.3
// Quality: 91/100 | Created: 2026-06-03
//# anyplot-orientation: landscape

const t = window.ANYPLOT_TOKENS;

// --- Configuration ---------------------------------------------------------
const N_MELS = 64;
const N_FRAMES = 250;
const DURATION = 5.0;
const SAMPLE_RATE = 22050;
const DB_MIN = -80;
const DB_MAX = 0;

// Mel scale constants: filter banks span 20 Hz to Nyquist
const MEL_MIN_VAL = 2595 * Math.log10(1 + 20 / 700);
const MEL_MAX_VAL = 2595 * Math.log10(1 + (SAMPLE_RATE / 2) / 700);

function melToHz(mel) {
  return 700 * (Math.pow(10, mel / 2595) - 1);
}
function hzToMelBand(hz) {
  const mel = 2595 * Math.log10(1 + hz / 700);
  return ((mel - MEL_MIN_VAL) / (MEL_MAX_VAL - MEL_MIN_VAL)) * (N_MELS - 1);
}

// --- Deterministic PRNG (LCG) ---------------------------------------------
function makeLcg(seed) {
  let s = seed >>> 0;
  return () => {
    s = (Math.imul(s, 1664525) + 1013904223) >>> 0;
    return s / 4294967296;
  };
}

// --- Synthetic speech-like mel-spectrogram (voiced + unvoiced segments) ---
function generateSpec() {
  const rand = makeLcg(42);
  const data = new Float32Array(N_MELS * N_FRAMES);

  for (let f = 0; f < N_FRAMES; f++) {
    const tNorm = f / N_FRAMES;
    const isVoiced = Math.sin(tNorm * Math.PI * 7) > 0.1;
    const formant1 = 15 + 5 * Math.sin(tNorm * 2 * Math.PI * 1.5);
    const formant2 = 32 + 4 * Math.sin(tNorm * 2 * Math.PI * 2.3);

    for (let m = 0; m < N_MELS; m++) {
      let db = -68 + rand() * 10;

      if (isVoiced) {
        // Fundamental frequency harmonics
        for (let h = 1; h <= 7; h++) {
          const hBand = 7 * h;
          if (hBand < N_MELS) {
            db += (22 - h * 2.5) * Math.exp(-((m - hBand) ** 2) / 8);
          }
        }
        // Formant resonances (F1, F2)
        db += 20 * Math.exp(-((m - formant1) ** 2) / 18);
        db += 14 * Math.exp(-((m - formant2) ** 2) / 30);
      } else {
        // Unvoiced fricative: broadband energy in upper mel bands
        db += 10 * Math.exp(-((m - 52) ** 2) / 45) * (0.4 + rand() * 0.6);
      }

      data[m * N_FRAMES + f] = Math.max(DB_MIN, Math.min(DB_MAX, db));
    }
  }
  return data;
}

const specData = generateSpec();

// --- Color mapping: imprint_seq (pageBg → seq[0] → seq[1]) ---------------
// Pre-parse hex stops once so dbToColor avoids repeated string parsing in the pixel loop
const _p = (h) => [parseInt(h.slice(1,3),16), parseInt(h.slice(3,5),16), parseInt(h.slice(5,7),16)];
const BG = _p(t.pageBg), C0 = _p(t.seq[0]), C1 = _p(t.seq[1]);
function dbToColor(db) {
  const n = (db - DB_MIN) / (DB_MAX - DB_MIN);
  let r, g, b, s;
  if (n < 0.4) {
    s = n / 0.4;
    r = BG[0] + s*(C0[0]-BG[0]); g = BG[1] + s*(C0[1]-BG[1]); b = BG[2] + s*(C0[2]-BG[2]);
  } else {
    s = (n - 0.4) / 0.6;
    r = C0[0] + s*(C1[0]-C0[0]); g = C0[1] + s*(C1[1]-C0[1]); b = C0[2] + s*(C1[2]-C0[2]);
  }
  return [Math.round(r), Math.round(g), Math.round(b)];
}

// --- Custom plugin: spectrogram raster + colorbar -------------------------
const spectrogramPlugin = {
  id: 'spectrogram',
  afterDraw(chart) {
    const ctx = chart.ctx;
    const { left, top, right, bottom } = chart.chartArea;
    const W = Math.floor(right - left);
    const H = Math.floor(bottom - top);

    // Render spectrogram pixels to an offscreen canvas
    const off = document.createElement('canvas');
    off.width = W;
    off.height = H;
    const offCtx = off.getContext('2d');
    const imgData = offCtx.createImageData(W, H);
    const px = imgData.data;

    for (let py = 0; py < H; py++) {
      const mFrac = (1 - py / (H - 1)) * (N_MELS - 1);
      const m0 = Math.floor(mFrac);
      const m1 = Math.min(m0 + 1, N_MELS - 1);
      const dm = mFrac - m0;

      for (let pxX = 0; pxX < W; pxX++) {
        const fFrac = (pxX / (W - 1)) * (N_FRAMES - 1);
        const f0 = Math.floor(fFrac);
        const f1 = Math.min(f0 + 1, N_FRAMES - 1);
        const df = fFrac - f0;

        // Bilinear interpolation for smooth rendering
        const db =
          specData[m0 * N_FRAMES + f0] * (1 - dm) * (1 - df) +
          specData[m0 * N_FRAMES + f1] * (1 - dm) * df +
          specData[m1 * N_FRAMES + f0] * dm * (1 - df) +
          specData[m1 * N_FRAMES + f1] * dm * df;

        const [r, g, b] = dbToColor(db);
        const i = (py * W + pxX) * 4;
        px[i] = r; px[i + 1] = g; px[i + 2] = b; px[i + 3] = 255;
      }
    }
    offCtx.putImageData(imgData, 0, 0);

    // Blit spectrogram into chart area with clip guard
    ctx.save();
    ctx.beginPath();
    ctx.rect(left, top, W, H);
    ctx.clip();
    ctx.drawImage(off, left, top);
    ctx.restore();

    // Redraw chart border over spectrogram — thicker for visual weight
    ctx.strokeStyle = t.ink;
    ctx.lineWidth = 2;
    ctx.strokeRect(left, top, W, H);

    // --- Colorbar ---------------------------------------------------------
    const cbX = right + 20;
    const cbW = 24;
    const cbH = H;
    const fs = Math.max(11, Math.round(H / 36));

    // Elevated background separating the colorbar column from the plot
    ctx.fillStyle = t.elevatedBg;
    ctx.fillRect(right + 8, top - 6, 108, cbH + 12);

    const grad = ctx.createLinearGradient(0, top, 0, top + cbH);
    grad.addColorStop(0, t.seq[1]);
    grad.addColorStop(0.6, t.seq[0]);
    grad.addColorStop(1, t.pageBg);
    ctx.fillStyle = grad;
    ctx.fillRect(cbX, top, cbW, cbH);
    ctx.strokeStyle = t.inkSoft;
    ctx.lineWidth = 1;
    ctx.strokeRect(cbX, top, cbW, cbH);

    // Colorbar tick marks and dB labels
    ctx.fillStyle = t.inkSoft;
    ctx.font = `${fs}px sans-serif`;
    ctx.textAlign = 'left';
    const dbLabels = [0, -20, -40, -60, -80];
    for (const db of dbLabels) {
      const yPos = top + ((DB_MAX - db) / (DB_MAX - DB_MIN)) * cbH;
      ctx.beginPath();
      ctx.moveTo(cbX + cbW, yPos);
      ctx.lineTo(cbX + cbW + 5, yPos);
      ctx.strokeStyle = t.inkSoft;
      ctx.lineWidth = 1;
      ctx.stroke();
      ctx.fillText(`${db}`, cbX + cbW + 7, yPos + fs * 0.35);
    }

    // Rotated "Power (dB)" label
    ctx.fillStyle = t.ink;
    ctx.font = `bold ${fs}px sans-serif`;
    ctx.save();
    ctx.translate(cbX + cbW + fs * 5.5, top + cbH / 2);
    ctx.rotate(-Math.PI / 2);
    ctx.textAlign = 'center';
    ctx.fillText('Power (dB)', 0, 0);
    ctx.restore();
  },
};

// --- Title ----------------------------------------------------------------
const titleText = 'spectrogram-mel · javascript · chartjs · anyplot.ai';
const titleSize = 26;

// --- Mount ----------------------------------------------------------------
const canvas = document.createElement('canvas');
document.getElementById('container').appendChild(canvas);

// --- Chart ----------------------------------------------------------------
new Chart(canvas, {
  type: 'scatter',
  data: { datasets: [{ data: [] }] },
  plugins: [spectrogramPlugin],
  options: {
    responsive: true,
    maintainAspectRatio: false,
    animation: false,
    layout: {
      padding: { right: 110, top: 10, bottom: 10, left: 10 },
    },
    plugins: {
      title: {
        display: true,
        text: titleText,
        color: t.ink,
        font: { size: titleSize, weight: '500' },
        padding: { bottom: 14 },
      },
      legend: { display: false },
    },
    scales: {
      x: {
        type: 'linear',
        min: 0,
        max: DURATION,
        ticks: {
          color: t.inkSoft,
          font: { size: 14 },
          callback: (v) => v.toFixed(1) + 's',
          maxTicksLimit: 7,
        },
        grid: { display: false },
        title: {
          display: true,
          text: 'Time (s)',
          color: t.ink,
          font: { size: 16 },
        },
        border: { color: t.inkSoft },
      },
      y: {
        type: 'linear',
        min: 0,
        max: N_MELS - 1,
        ticks: {
          color: t.inkSoft,
          font: { size: 14 },
          maxTicksLimit: 7,
          callback: (v) => {
            const mel = MEL_MIN_VAL + (v / (N_MELS - 1)) * (MEL_MAX_VAL - MEL_MIN_VAL);
            const hz = Math.round(melToHz(mel));
            return hz >= 1000 ? (Math.round(hz / 100) / 10) + 'k' : `${hz}`;
          },
        },
        grid: { display: false },
        title: {
          display: true,
          text: 'Frequency (Hz, mel scale)',
          color: t.ink,
          font: { size: 16 },
        },
        border: { color: t.inkSoft },
      },
    },
  },
});
Runnable source as JSON, for any HTTP client: https://api.anyplot.ai/specs/spectrogram-mel/chartjs/code. Any spec id and library id listed in llms-full.txt fit the same URL shape; every URL below is complete and callable.
{
  "spec_id": "spectrogram-mel",
  "language": "javascript",
  "library": "chartjs",
  "page": "https://anyplot.ai/spectrogram-mel/javascript/chartjs",
  "hub": "https://anyplot.ai/spectrogram-mel",
  "code_json": "https://api.anyplot.ai/specs/spectrogram-mel/chartjs/code",
  "spec_json": "https://api.anyplot.ai/specs/spectrogram-mel",
  "render_light_png": "https://storage.googleapis.com/anyplot-images/plots/spectrogram-mel/javascript/chartjs/plot-light.png",
  "render_dark_png": "https://storage.googleapis.com/anyplot-images/plots/spectrogram-mel/javascript/chartjs/plot-dark.png",
  "interactive_light_html": "https://storage.googleapis.com/anyplot-images/plots/spectrogram-mel/javascript/chartjs/plot-light.html",
  "interactive_dark_html": "https://storage.googleapis.com/anyplot-images/plots/spectrogram-mel/javascript/chartjs/plot-dark.html",
  "quality_score": 91.0,
  "license": "MIT",
  "guide": "https://anyplot.ai/llms.txt"
}
Part of Mel-Spectrogram for Audio Analysis on anyplot.ai.