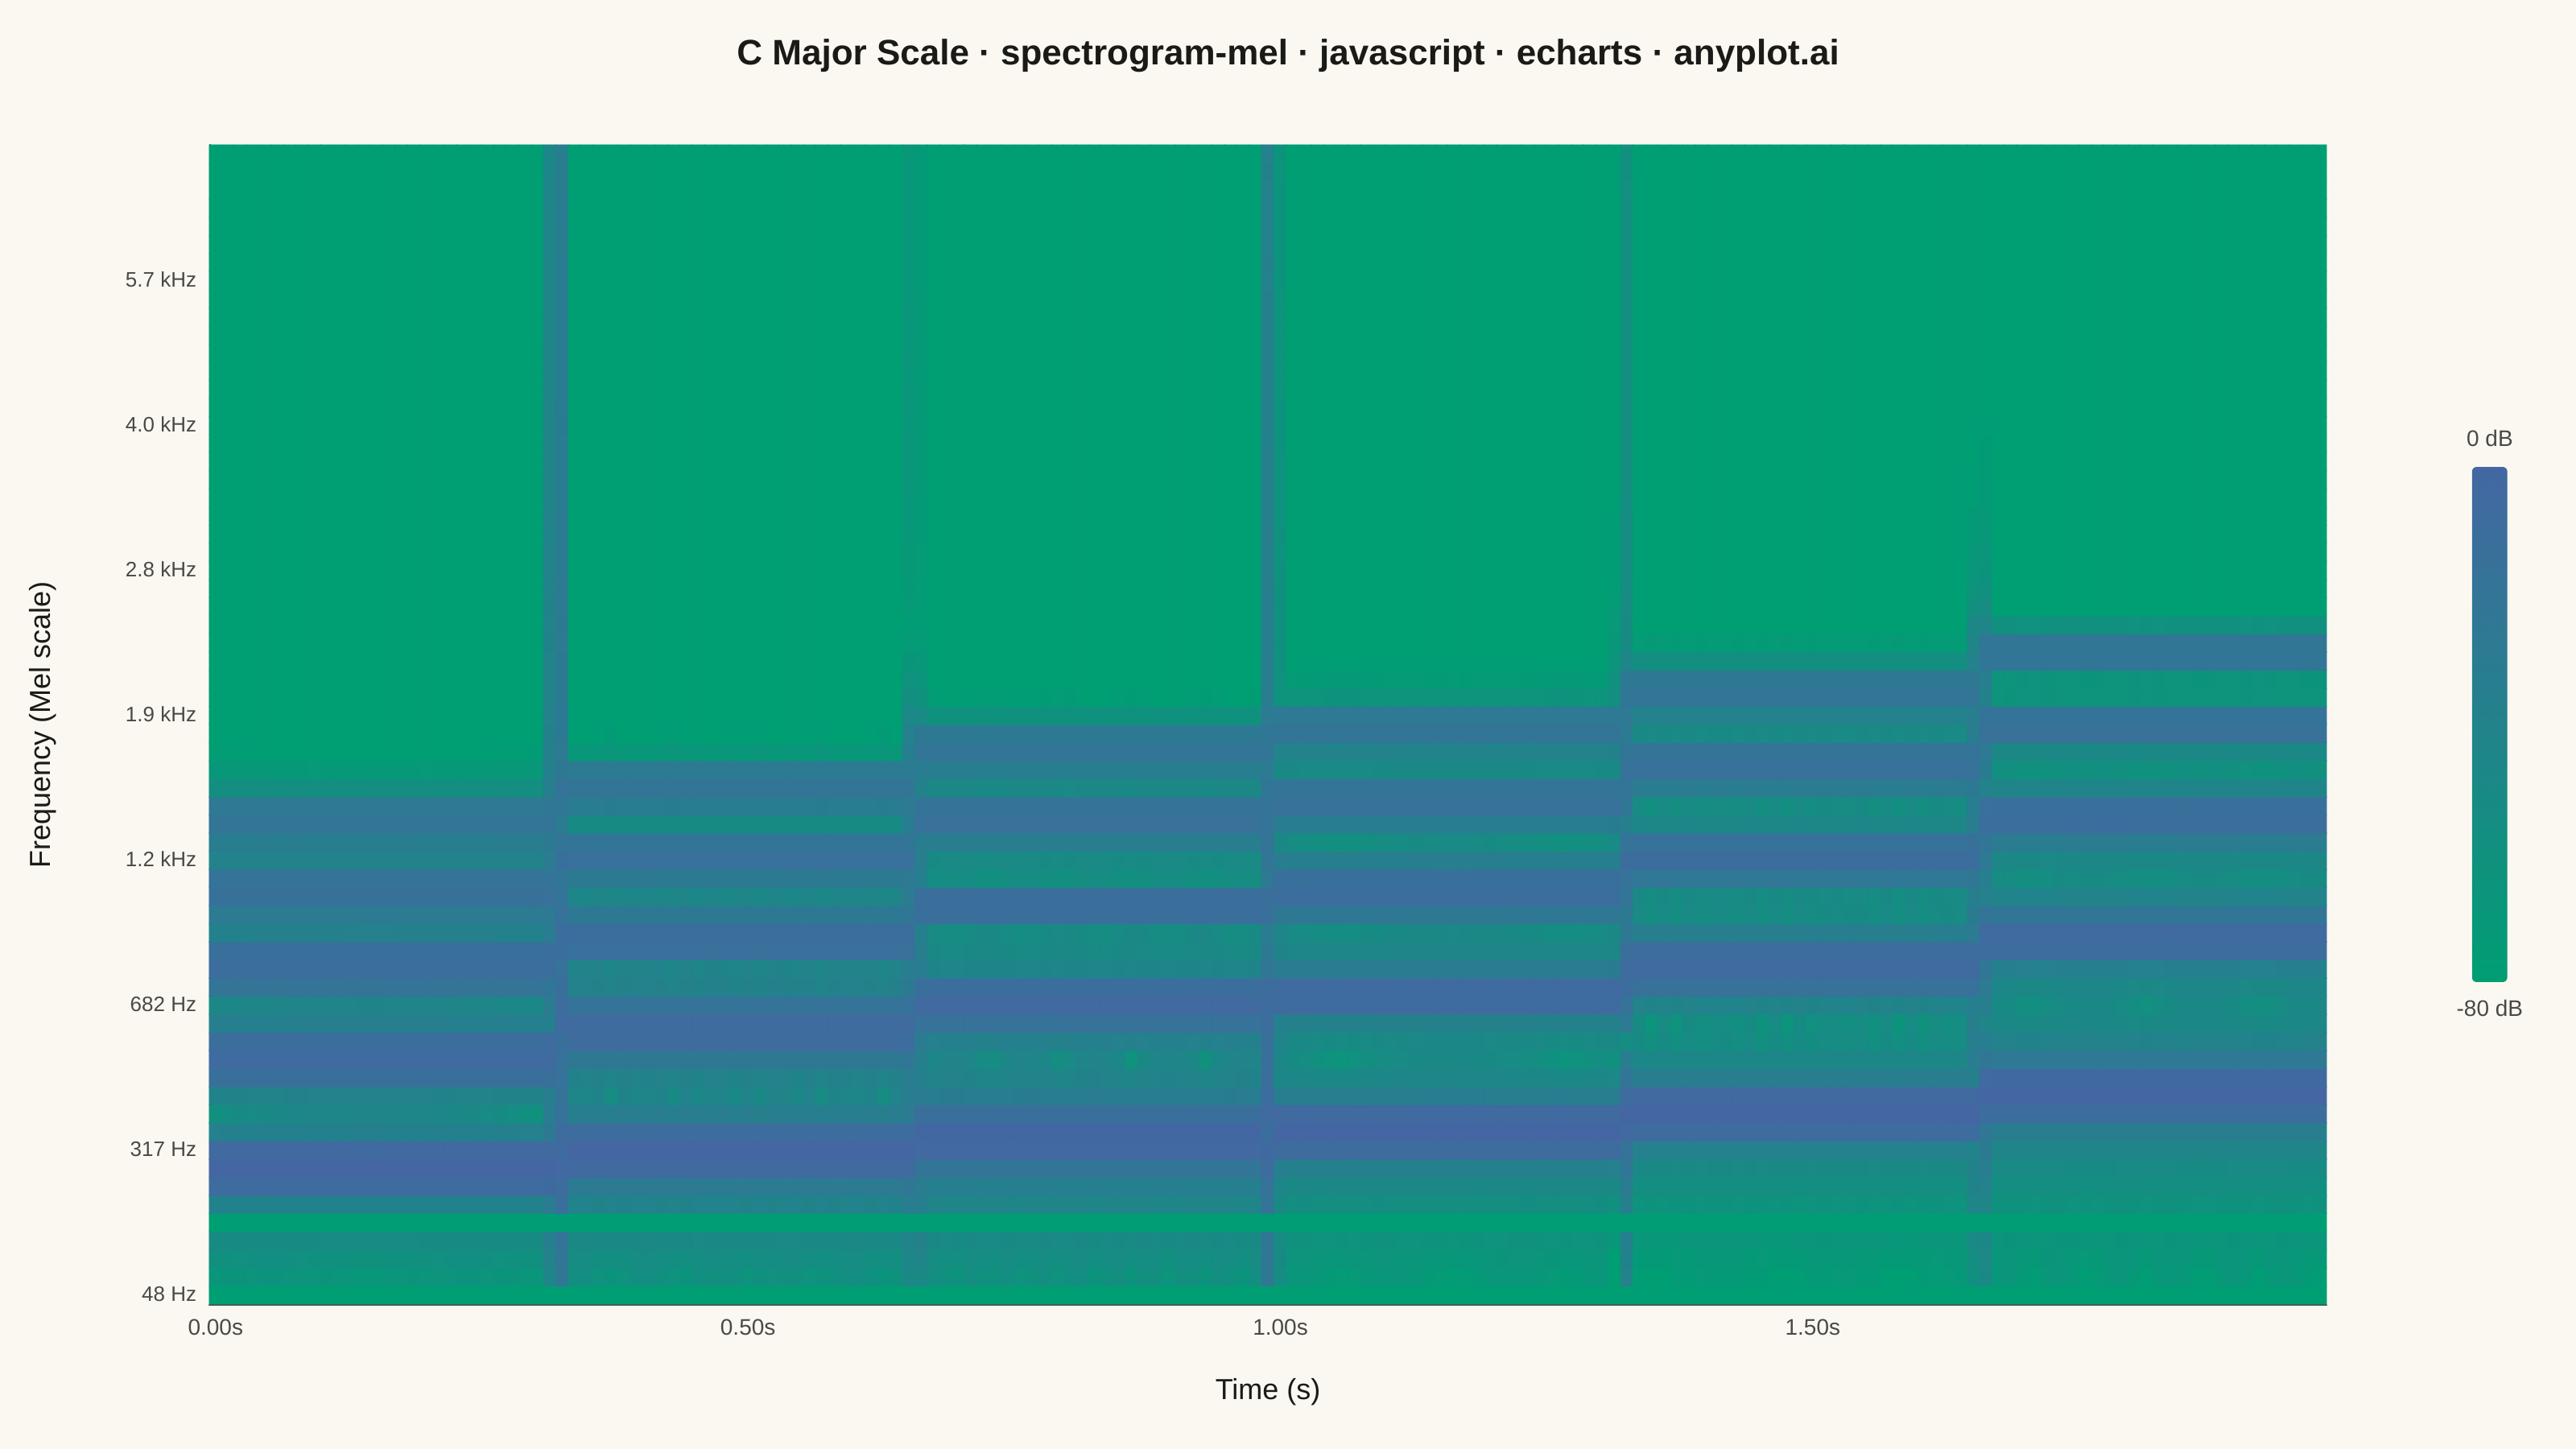
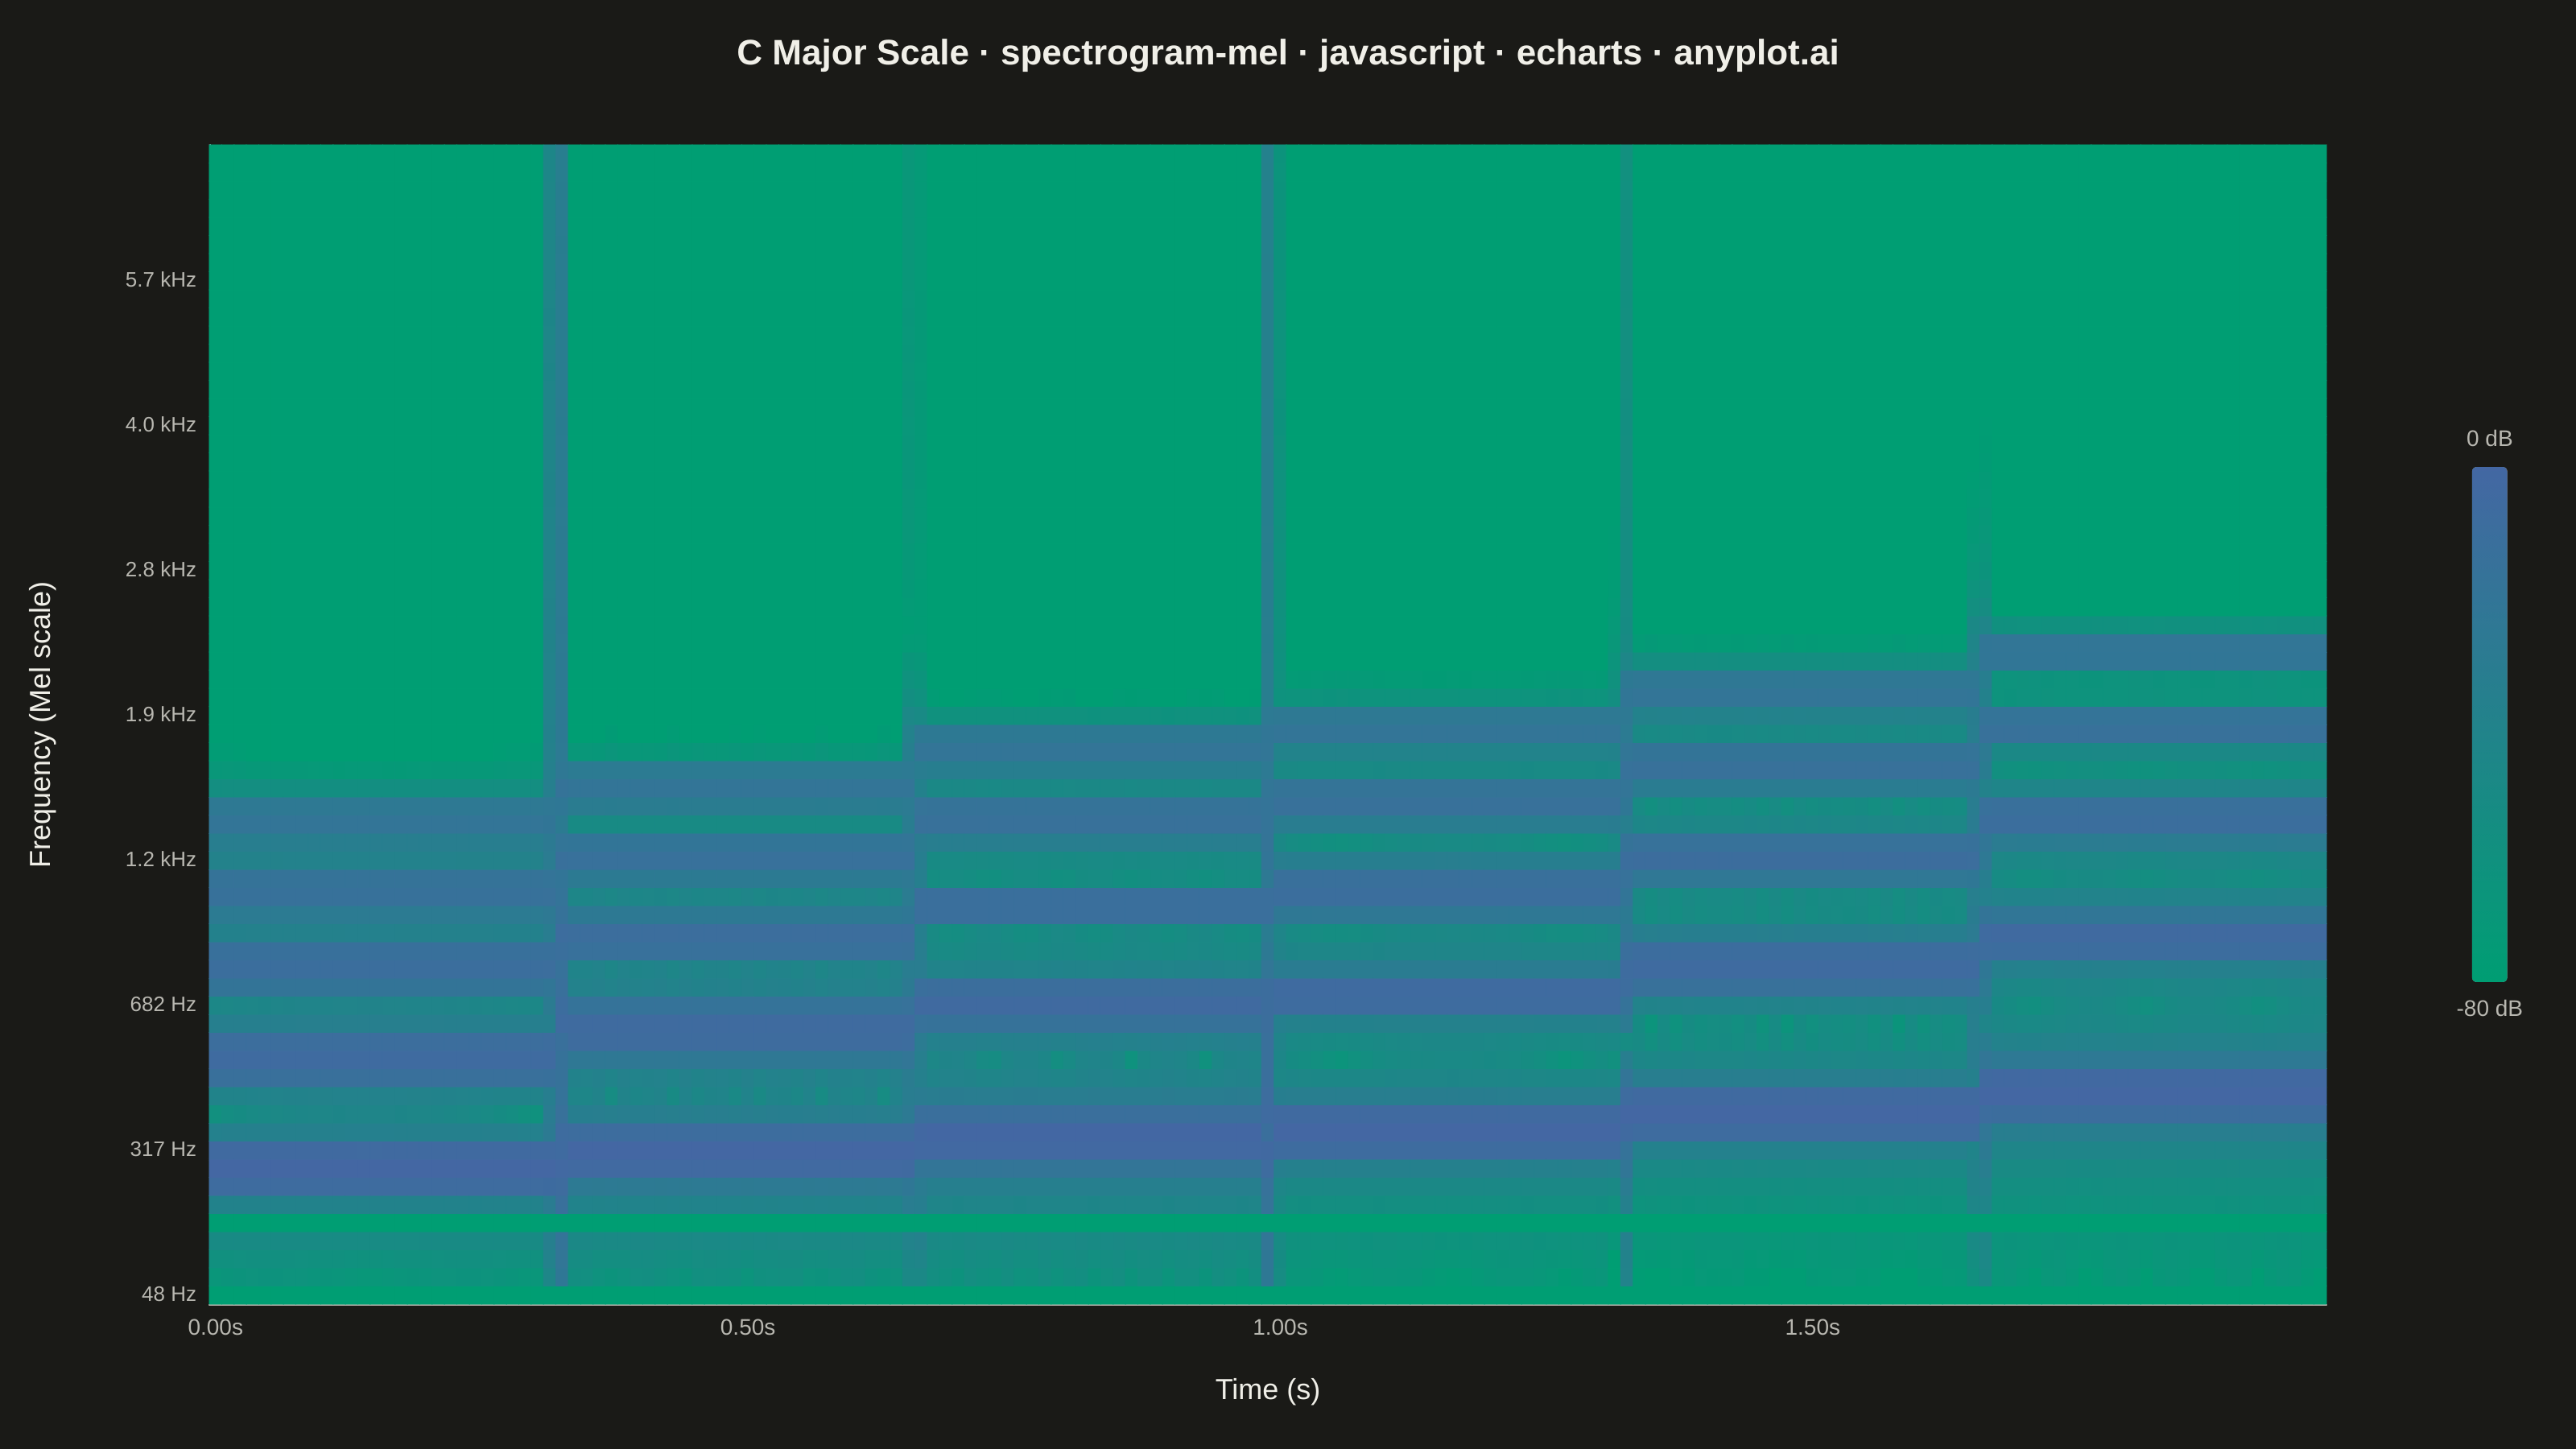
The same plot in 14 other libraries — JavaScript: Chart.js, D3.js, Highcharts, MUI X Charts; Python: Altair, Bokeh, lets-plot, Matplotlib, Plotly, plotnine, Pygal, Seaborn; R: ggplot2; Julia: Makie.jl. Compare all 15 side by side: Mel-Spectrogram for Audio Analysis in Python, R, Julia and JavaScript.
A mel-spectrogram displaying the power spectrum of an audio signal with the frequency axis warped to the mel scale, which approximates human auditory perception. Unlike a standard spectrogram with a linear frequency axis, the mel-spectrogram compresses higher frequencies and expands lower frequencies, making perceptually similar sounds visually closer together. This is the foundational input representation for modern audio machine learning pipelines including speech recognition, speaker identification, and music information retrieval.
// anyplot.ai
// spectrogram-mel: Mel-Spectrogram for Audio Analysis
// Library: echarts 5.5.1 | JavaScript 22.22.3
// Quality: 90/100 | Created: 2026-06-03

const t = window.ANYPLOT_TOKENS;

// --- Signal parameters -------------------------------------------------------
const SR = 22050;           // sample rate Hz
const DURATION = 2.0;       // seconds
const N_SAMPLES = Math.floor(SR * DURATION);
const N_FFT = 512;          // FFT size (power of 2)
const HOP = 256;            // hop length
const N_MELS = 64;          // mel frequency bins
const F_MIN = 20;           // Hz
const F_MAX = 8000;         // Hz
const DB_MIN = -80;         // dB floor for display

// --- Synthesize C-major ascending scale (C4→A4) with harmonics ---------------
// Each note is 1/6 of the total duration; each has a fundamental + 4 harmonics
const signal = new Float64Array(N_SAMPLES);
const notes = [261.63, 293.66, 329.63, 349.23, 392.00, 440.00]; // C4 D4 E4 F4 G4 A4
const noteDur = DURATION / notes.length;
const harmonicAmp = [0.55, 0.30, 0.17, 0.10, 0.05];

for (let i = 0; i < N_SAMPLES; i++) {
  const t_s = i / SR;
  const f0 = notes[Math.min(Math.floor(t_s / noteDur), notes.length - 1)];
  let v = 0;
  for (let h = 0; h < harmonicAmp.length; h++) {
    v += harmonicAmp[h] * Math.sin(2 * Math.PI * (h + 1) * f0 * t_s);
  }
  signal[i] = v;
}

// --- Hann window -------------------------------------------------------------
const hann = new Float64Array(N_FFT);
for (let i = 0; i < N_FFT; i++) {
  hann[i] = 0.5 * (1 - Math.cos(2 * Math.PI * i / (N_FFT - 1)));
}

// --- Radix-2 Cooley-Tukey FFT (in-place, DIF) --------------------------------
function fft(re, im) {
  const n = re.length;
  for (let i = 1, j = 0; i < n; i++) {
    let bit = n >> 1;
    for (; j & bit; bit >>= 1) j ^= bit;
    j ^= bit;
    if (i < j) {
      let tmp = re[i]; re[i] = re[j]; re[j] = tmp;
      tmp = im[i]; im[i] = im[j]; im[j] = tmp;
    }
  }
  for (let len = 2; len <= n; len <<= 1) {
    const ang = -2 * Math.PI / len;
    const wc = Math.cos(ang), ws = Math.sin(ang);
    const half = len >> 1;
    for (let i = 0; i < n; i += len) {
      let wr = 1, wi = 0;
      for (let k = 0; k < half; k++) {
        const ur = re[i + k], ui = im[i + k];
        const vr = re[i + k + half] * wr - im[i + k + half] * wi;
        const vi = re[i + k + half] * wi + im[i + k + half] * wr;
        re[i + k] = ur + vr; im[i + k] = ui + vi;
        re[i + k + half] = ur - vr; im[i + k + half] = ui - vi;
        const nwr = wr * wc - wi * ws;
        wi = wr * ws + wi * wc;
        wr = nwr;
      }
    }
  }
}

// --- Mel filter banks --------------------------------------------------------
const hzToMel = hz => 2595 * Math.log10(1 + hz / 700);
const melToHz = mel => 700 * (Math.pow(10, mel / 2595) - 1);

const melMin = hzToMel(F_MIN);
const melMax = hzToMel(F_MAX);
const N_BINS = Math.floor(N_FFT / 2) + 1;

// N_MELS+2 equally-spaced mel edge points (lower edge, N_MELS peaks, upper edge)
const melEdgeHz = Array.from({ length: N_MELS + 2 }, (_, i) =>
  melToHz(melMin + (melMax - melMin) * i / (N_MELS + 1))
);
const edgeBins = melEdgeHz.map(hz => Math.floor((N_FFT + 1) * hz / SR));

// Sparse triangular filters: only (bin, weight) pairs where weight > 0
const filters = Array.from({ length: N_MELS }, (_, m) => {
  const b0 = edgeBins[m], b1 = edgeBins[m + 1], b2 = edgeBins[m + 2];
  const entries = [];
  for (let k = b0; k < b1; k++) if (b1 > b0) entries.push([k, (k - b0) / (b1 - b0)]);
  for (let k = b1; k <= b2; k++) if (b2 > b1) entries.push([k, (b2 - k) / (b2 - b1)]);
  return entries;
});

// Center Hz of each mel bin (for y-axis labels)
const melCenterHz = Array.from({ length: N_MELS }, (_, m) => melEdgeHz[m + 1]);

// --- Compute STFT then mel spectrogram ---------------------------------------
const n_frames = Math.floor((N_SAMPLES - N_FFT) / HOP) + 1;
const re = new Float64Array(N_FFT);
const im = new Float64Array(N_FFT);
const power = new Float64Array(N_BINS);
const melFrame = new Float64Array(N_MELS);
const melSpec = [];  // array of Float64Array snapshots

for (let fr = 0; fr < n_frames; fr++) {
  const start = fr * HOP;
  for (let i = 0; i < N_FFT; i++) {
    re[i] = (start + i < N_SAMPLES ? signal[start + i] : 0) * hann[i];
    im[i] = 0;
  }
  fft(re, im);
  for (let k = 0; k < N_BINS; k++) power[k] = re[k] * re[k] + im[k] * im[k];
  for (let m = 0; m < N_MELS; m++) {
    let s = 0;
    for (const [k, w] of filters[m]) s += w * power[k];
    melFrame[m] = Math.max(s, 1e-20);
  }
  melSpec.push(melFrame.slice());
}

// Convert to dB relative to peak power across all frames and bins
let maxPow = 0;
for (const fr of melSpec) for (const v of fr) if (v > maxPow) maxPow = v;
const specDb = melSpec.map(fr =>
  Array.from(fr, v => Math.max(10 * Math.log10(v / maxPow), DB_MIN))
);

// --- Build ECharts heatmap data [frame_idx, mel_idx, dB] --------------------
const data = [];
for (let fr = 0; fr < n_frames; fr++) {
  for (let m = 0; m < N_MELS; m++) {
    data.push([fr, m, parseFloat(specDb[fr][m].toFixed(1))]);
  }
}

// --- Axis labels -------------------------------------------------------------
// X-axis: time in seconds (show ~5 labels, ~0.5 s apart)
const timeLabels = Array.from({ length: n_frames }, (_, i) => (i * HOP / SR).toFixed(2));
const xInterval = Math.round(0.5 * SR / HOP) - 1;  // frames per 0.5 s minus 1

// Y-axis: center frequency of each mel bin in Hz / kHz
const freqLabels = melCenterHz.map(hz =>
  hz < 1000 ? Math.round(hz) + ' Hz' : (hz / 1000).toFixed(1) + ' kHz'
);
const yInterval = Math.ceil(N_MELS / 8) - 1;  // show ~8 frequency labels

// --- Title size (scale for length > 67 chars) --------------------------------
const titleText = 'C Major Scale · spectrogram-mel · javascript · echarts · anyplot.ai';
const titleSize = Math.max(15, Math.round(22 * Math.min(1, 67 / titleText.length)));

// --- Render ------------------------------------------------------------------
const chart = echarts.init(document.getElementById('container'));

chart.setOption({
  animation: false,
  backgroundColor: 'transparent',

  title: {
    text: titleText,
    left: 'center',
    top: 18,
    textStyle: { color: t.ink, fontSize: titleSize, fontWeight: 'bold' },
  },

  grid: { left: 130, right: 155, top: 90, bottom: 90 },

  xAxis: {
    type: 'category',
    data: timeLabels,
    name: 'Time (s)',
    nameLocation: 'middle',
    nameGap: 45,
    nameTextStyle: { color: t.ink, fontSize: 18 },
    axisLabel: {
      color: t.inkSoft,
      fontSize: 14,
      interval: xInterval,
      formatter: v => v + 's',
    },
    axisLine: { lineStyle: { color: t.inkSoft } },
    axisTick: { show: false },
    splitLine: { show: false },
  },

  yAxis: {
    type: 'category',
    data: freqLabels,
    name: 'Frequency (Mel scale)',
    nameLocation: 'middle',
    nameGap: 95,
    nameTextStyle: { color: t.ink, fontSize: 18 },
    axisLabel: {
      color: t.inkSoft,
      fontSize: 13,
      interval: yInterval,
    },
    axisLine: { lineStyle: { color: t.inkSoft } },
    axisTick: { show: false },
    splitLine: { show: false },
  },

  // Imprint sequential colormap: brand green → blue (low → high energy)
  visualMap: {
    min: DB_MIN,
    max: 0,
    calculable: false,
    orient: 'vertical',
    right: 28,
    top: 'middle',
    itemWidth: 22,
    itemHeight: 320,
    text: ['0 dB', DB_MIN + ' dB'],
    textStyle: { color: t.inkSoft, fontSize: 14 },
    inRange: { color: t.seq },
    backgroundColor: 'transparent',
    borderWidth: 0,
  },

  series: [{
    type: 'heatmap',
    data: data,
    emphasis: { disabled: true },
    label: { show: false },
  }],

  tooltip: { show: false },
});
Runnable source as JSON, for any HTTP client: https://api.anyplot.ai/specs/spectrogram-mel/echarts/code. Any spec id and library id listed in llms-full.txt fit the same URL shape; every URL below is complete and callable.
{
  "spec_id": "spectrogram-mel",
  "language": "javascript",
  "library": "echarts",
  "page": "https://anyplot.ai/spectrogram-mel/javascript/echarts",
  "hub": "https://anyplot.ai/spectrogram-mel",
  "code_json": "https://api.anyplot.ai/specs/spectrogram-mel/echarts/code",
  "spec_json": "https://api.anyplot.ai/specs/spectrogram-mel",
  "render_light_png": "https://storage.googleapis.com/anyplot-images/plots/spectrogram-mel/javascript/echarts/plot-light.png",
  "render_dark_png": "https://storage.googleapis.com/anyplot-images/plots/spectrogram-mel/javascript/echarts/plot-dark.png",
  "interactive_light_html": "https://storage.googleapis.com/anyplot-images/plots/spectrogram-mel/javascript/echarts/plot-light.html",
  "interactive_dark_html": "https://storage.googleapis.com/anyplot-images/plots/spectrogram-mel/javascript/echarts/plot-dark.html",
  "quality_score": 90.0,
  "license": "MIT",
  "guide": "https://anyplot.ai/llms.txt"
}
Part of Mel-Spectrogram for Audio Analysis on anyplot.ai.