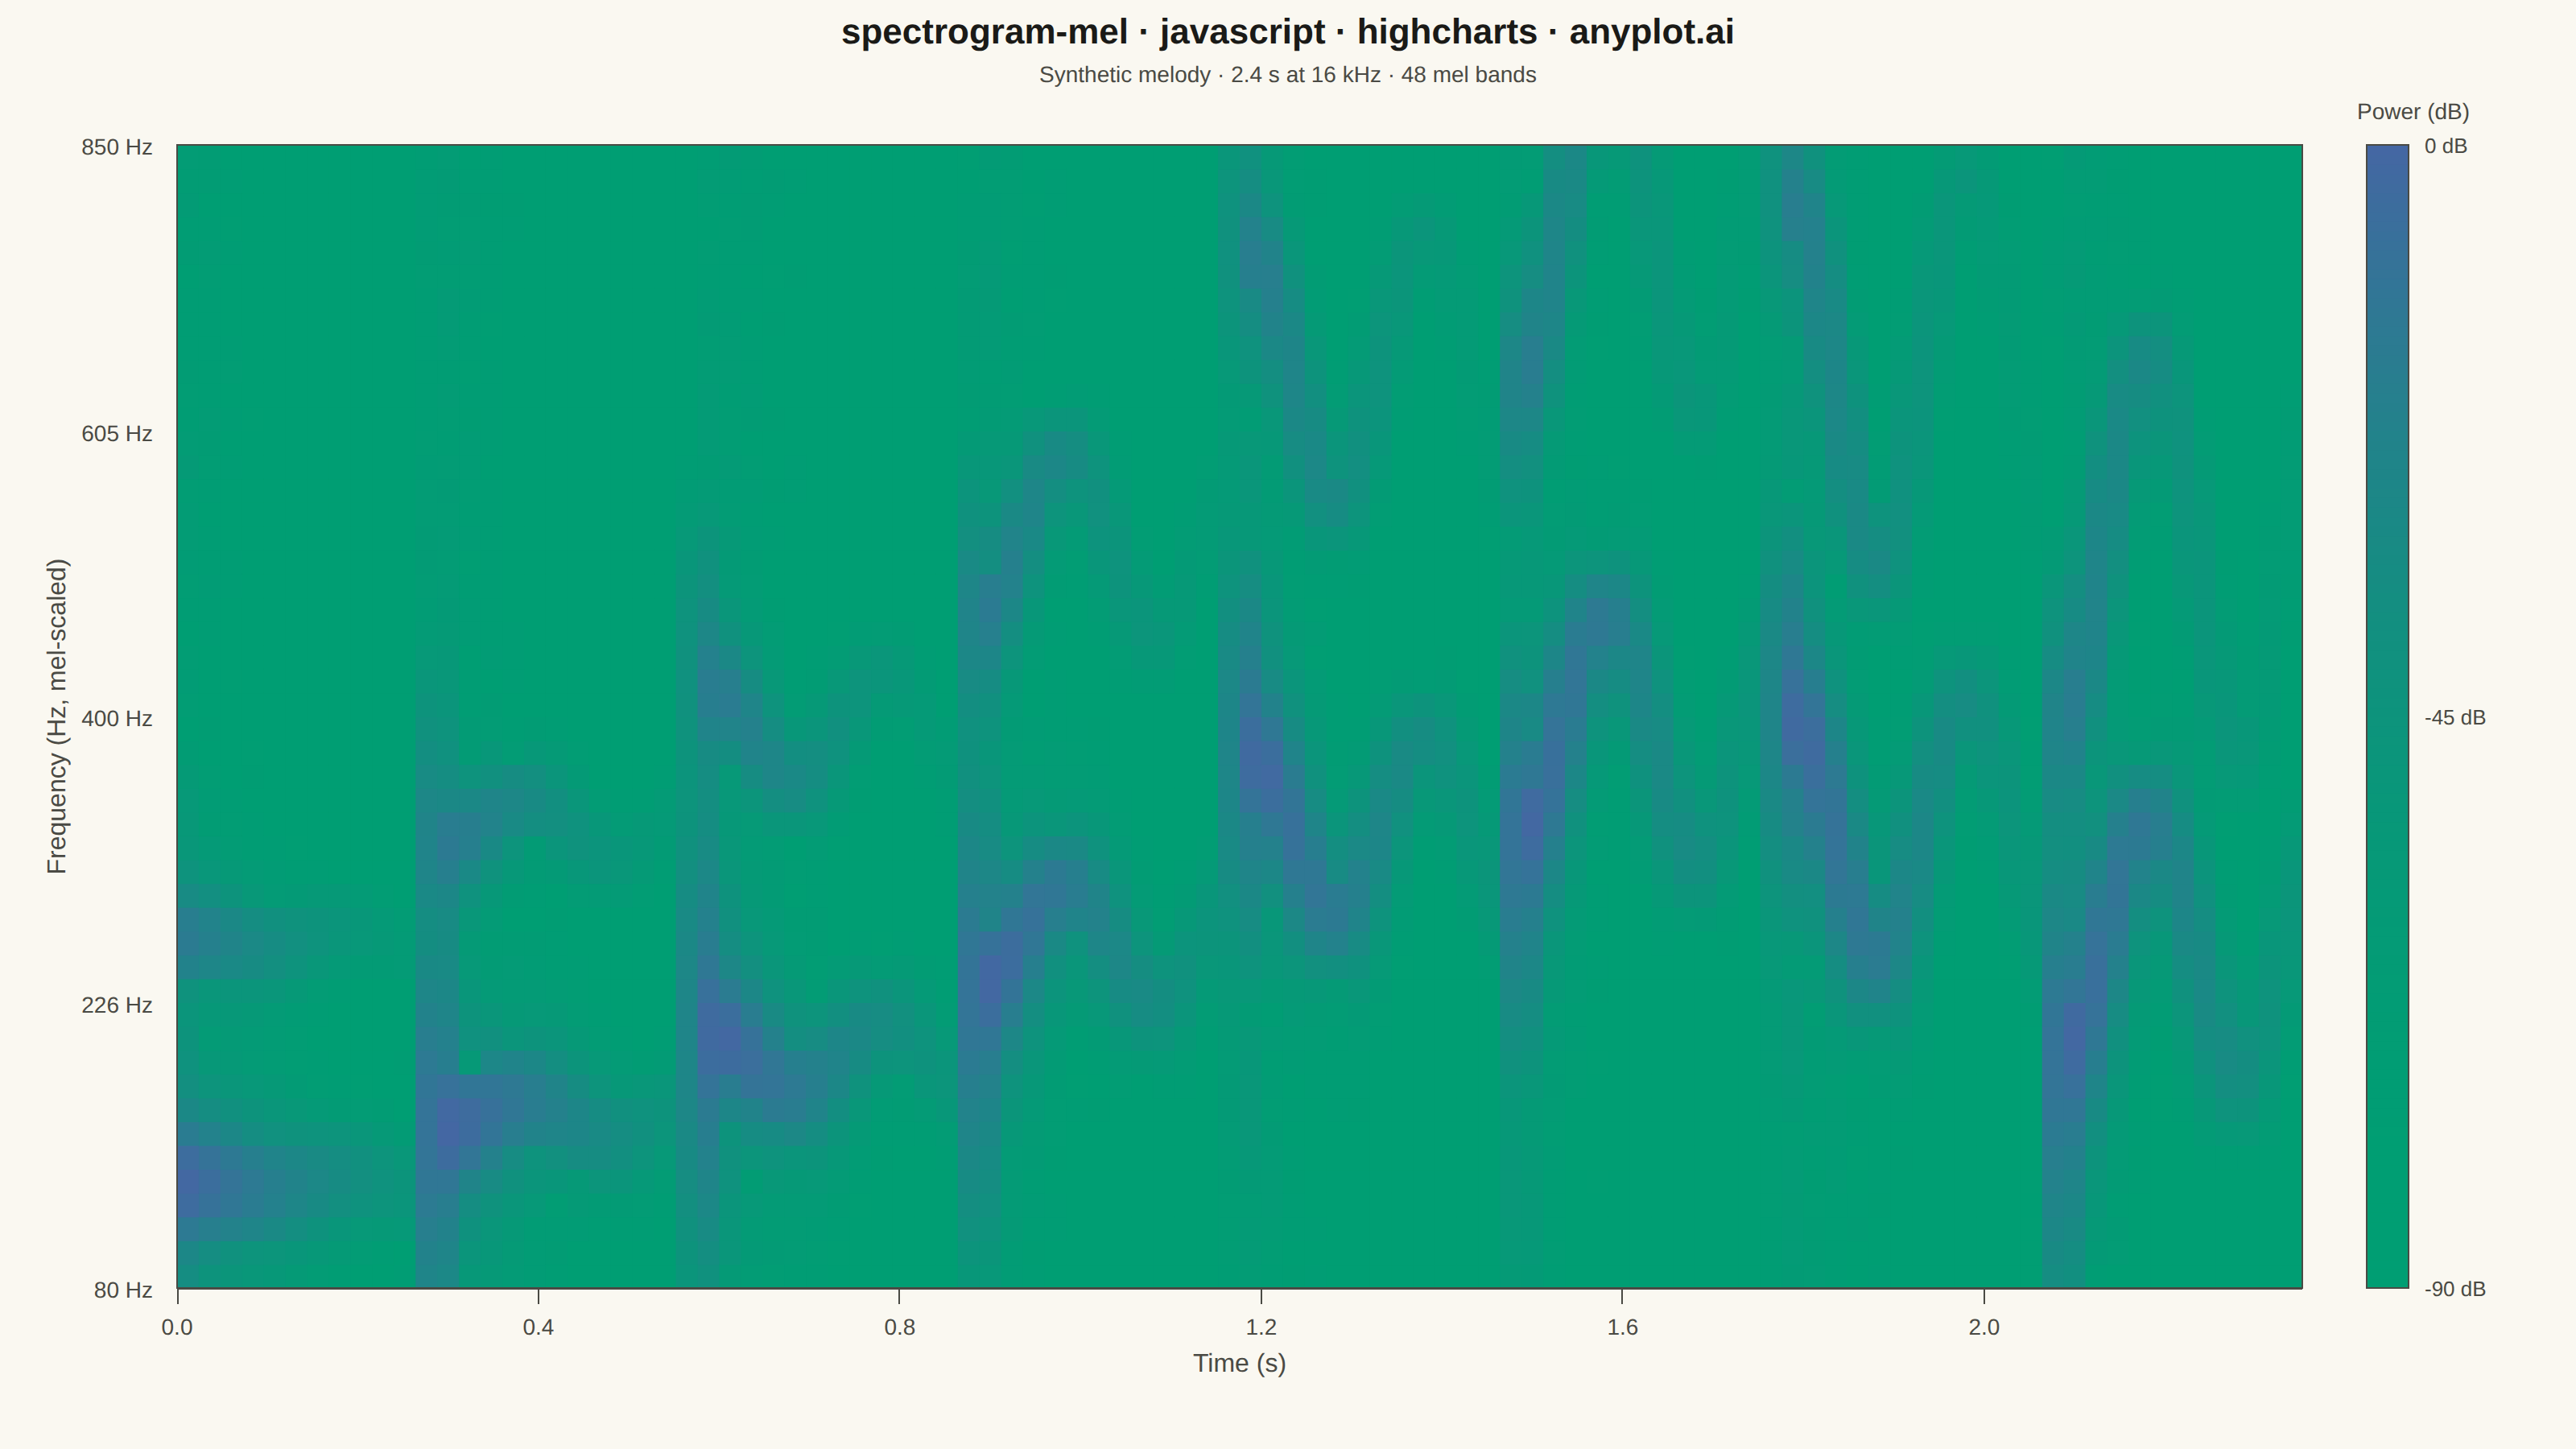
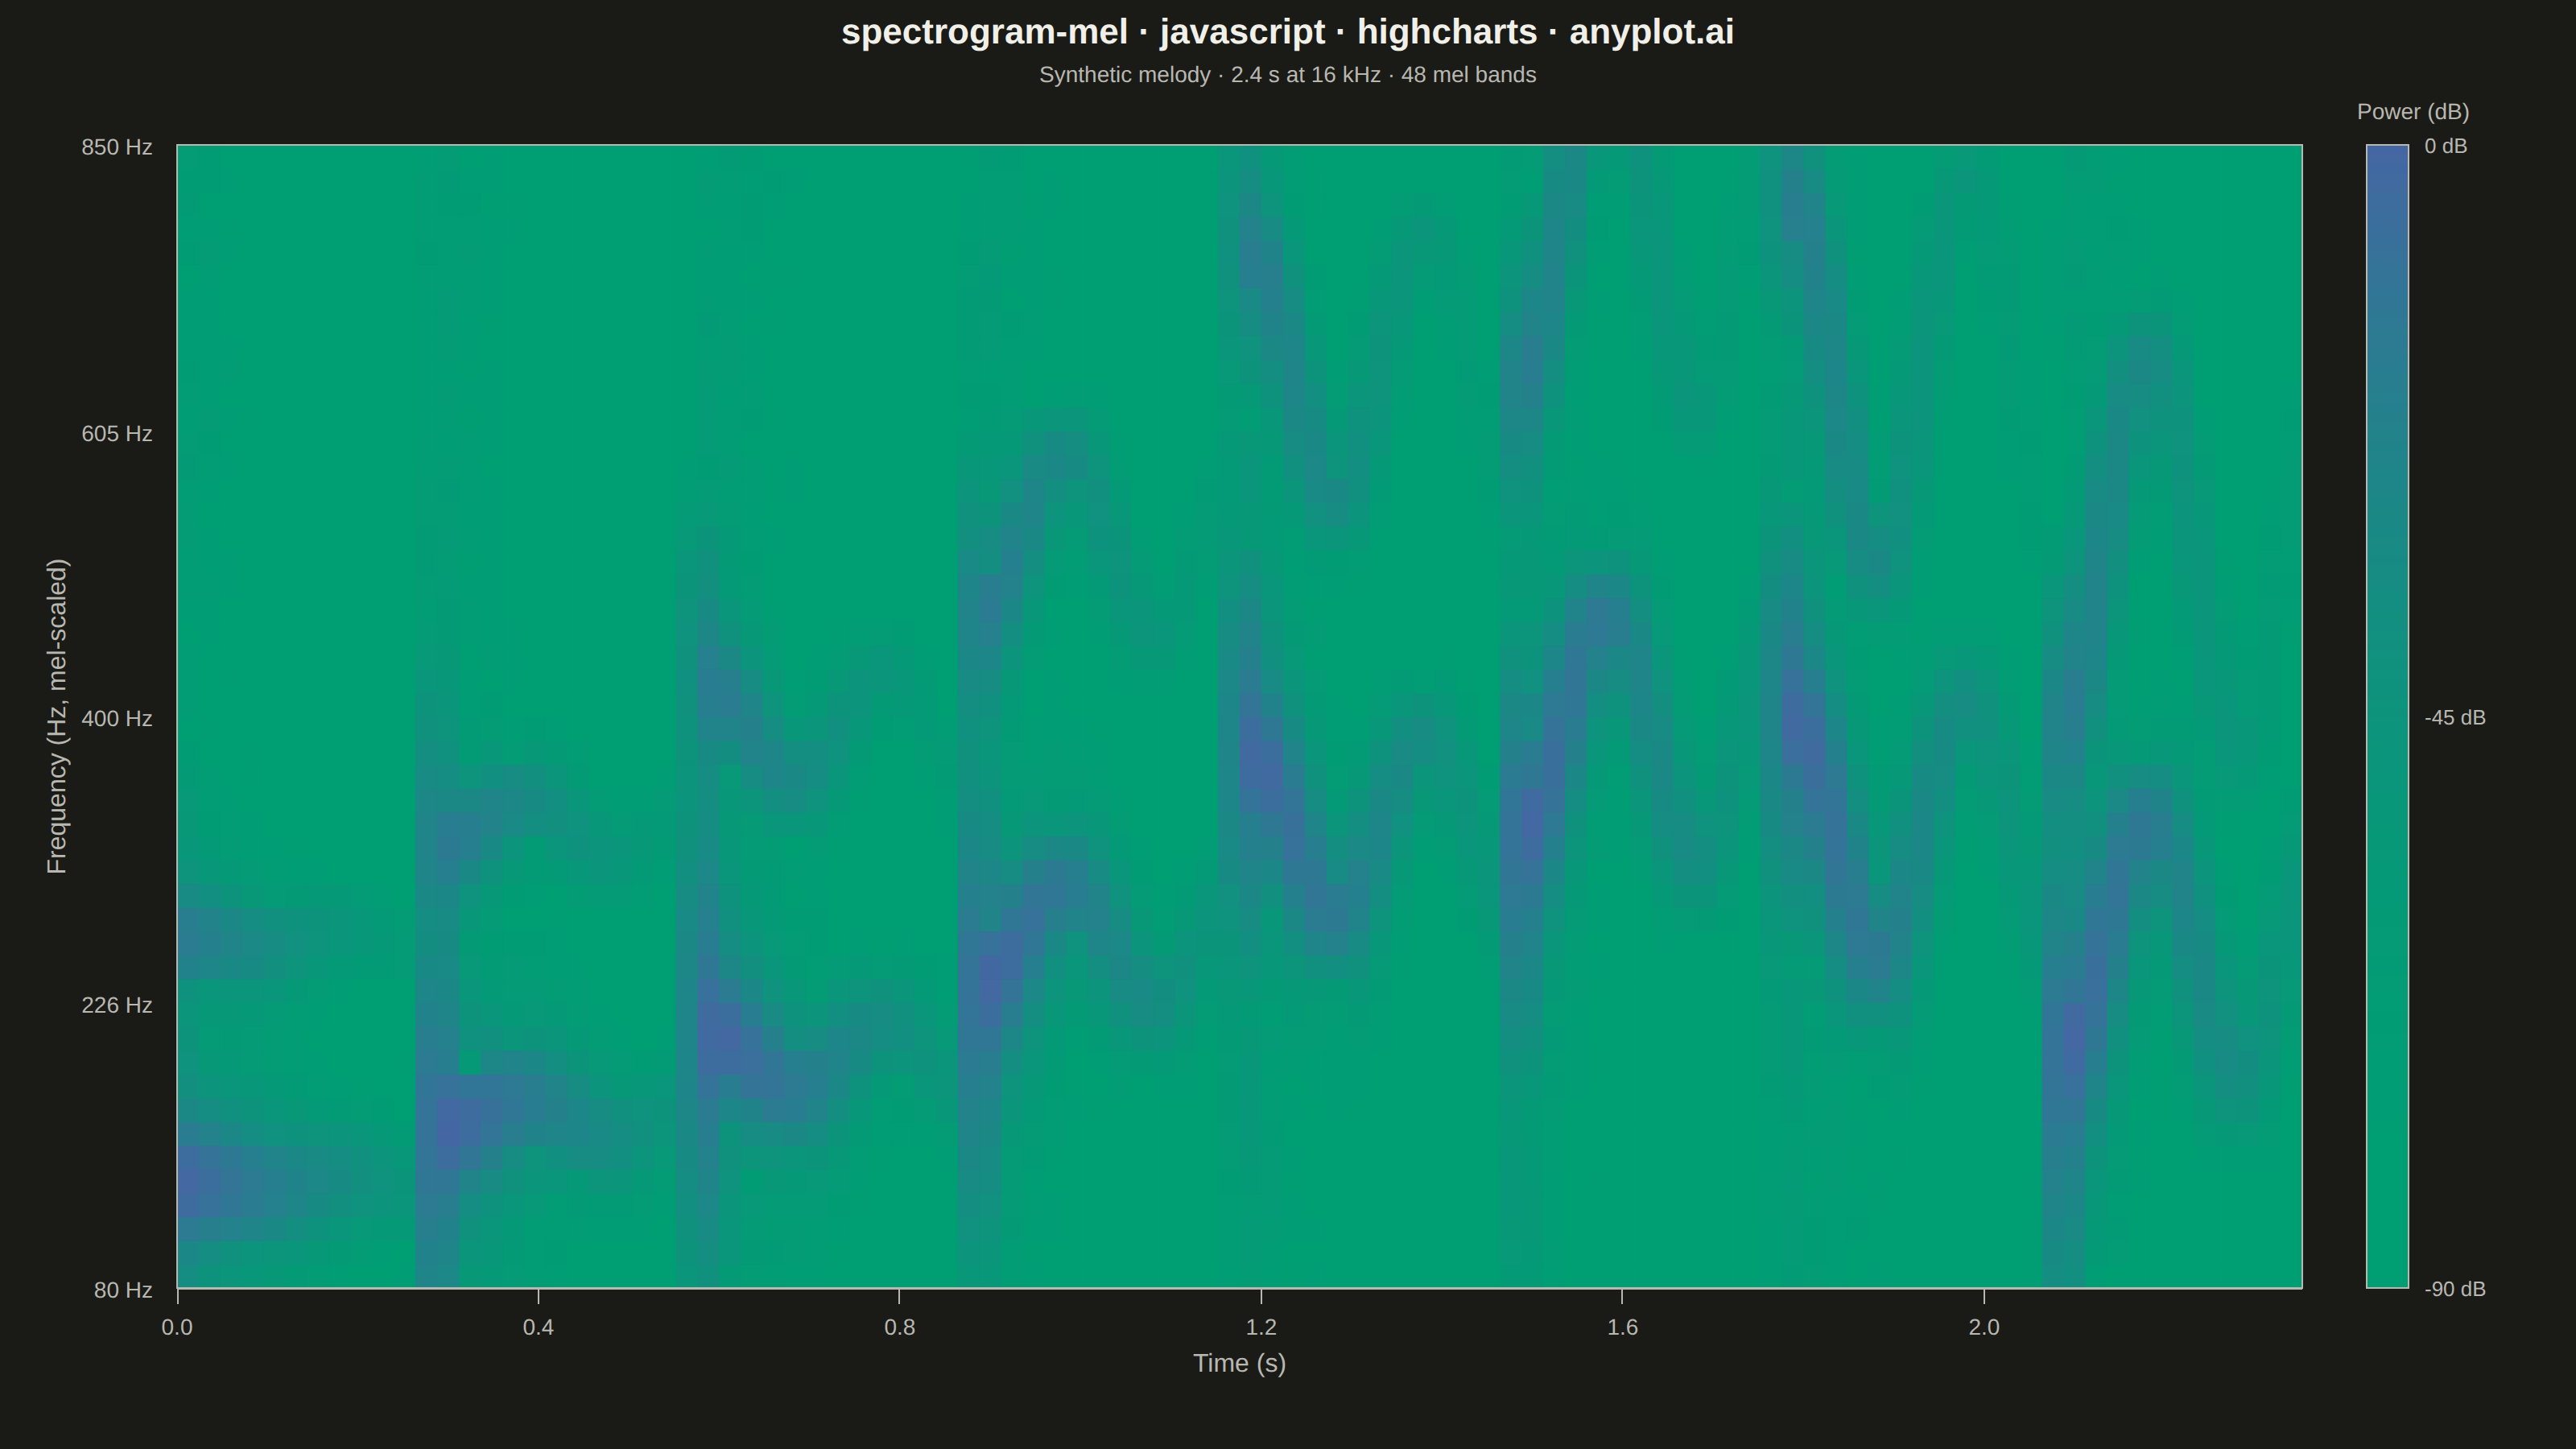
The same plot in 14 other libraries — JavaScript: Chart.js, D3.js, Apache ECharts, MUI X Charts; Python: Altair, Bokeh, lets-plot, Matplotlib, Plotly, plotnine, Pygal, Seaborn; R: ggplot2; Julia: Makie.jl. Compare all 15 side by side: Mel-Spectrogram for Audio Analysis in Python, R, Julia and JavaScript.
A mel-spectrogram displaying the power spectrum of an audio signal with the frequency axis warped to the mel scale, which approximates human auditory perception. Unlike a standard spectrogram with a linear frequency axis, the mel-spectrogram compresses higher frequencies and expands lower frequencies, making perceptually similar sounds visually closer together. This is the foundational input representation for modern audio machine learning pipelines including speech recognition, speaker identification, and music information retrieval.
// anyplot.ai
// spectrogram-mel: Mel-Spectrogram for Audio Analysis
// Library: highcharts 12.6.0 | JavaScript 22.23.2
// Quality: 82/100 | Created: 2026-08-24

const t = window.ANYPLOT_TOKENS;

// --- Synthetic audio (deterministic LCG, no Math.random) --------------------
const SAMPLE_RATE = 16000;
// Rising-then-falling run (C3 E3 G3 C4 E4 G4 E4 C4) so the fundamental sweeps
// visibly across the mel bins instead of hovering in a single narrow band.
const NOTES_HZ = [130.81, 164.81, 196.0, 261.63, 329.63, 392.0, 329.63, 261.63];
const NOTE_DURATION = 0.3;
const DURATION = NOTES_HZ.length * NOTE_DURATION;
const N_SAMPLES = Math.round(SAMPLE_RATE * DURATION);

let lcgState = 42;
function lcgNext() {
  lcgState = (lcgState * 1664525 + 1013904223) >>> 0;
  return lcgState / 4294967296;
}

const audio = new Float64Array(N_SAMPLES);
for (let n = 0; n < N_SAMPLES; n++) {
  const time = n / SAMPLE_RATE;
  const noteIdx = Math.min(NOTES_HZ.length - 1, Math.floor(time / NOTE_DURATION));
  const timeInNote = time - noteIdx * NOTE_DURATION;
  const vibrato = 1 + 0.004 * Math.sin(2 * Math.PI * 5 * time);
  const f0 = NOTES_HZ[noteIdx] * vibrato;
  // Raised-cosine (not linear) attack: a linear ramp has a corner in its
  // derivative that splatters broadband energy across every mel bin at each
  // onset, which was the real source of the "noisy across the full
  // frequency range" texture — a smooth S-curve confines the onset's energy
  // to the note's own partials instead of the whole spectrum.
  const attack = timeInNote < 0.01 ? 0.5 - 0.5 * Math.cos((Math.PI * timeInNote) / 0.01) : 1;
  // Fast pluck-like decay so each note's onset and the silence between notes
  // both stay visible instead of blurring into one continuous tone; steep
  // enough that consecutive notes don't smear together in the mel grid.
  const envelope = attack * Math.exp(-22 * timeInNote);
  // Fundamental plus a much quieter overtone: with only 48 mel bins packed
  // into a narrow 80-850 Hz span, a loud second partial competes visually
  // with the fundamental and reads as noise, so keep the overtone faint and
  // let one dominant band trace the melody clearly.
  const tone = Math.sin(2 * Math.PI * f0 * time) + 0.18 * Math.sin(2 * Math.PI * 2 * f0 * time);
  const breathNoise = (lcgNext() - 0.5) * 0.006 * envelope;
  audio[n] = 0.3 * envelope * tone + breathNoise;
}

// --- Mel-scale frequency centers --------------------------------------------
const N_MELS = 48;
const FMIN_HZ = 80;
// Capped well below Nyquist so the fundamental + its faint overtone (up to
// 392 Hz x 2 = 784 Hz) span most of the mel axis, leaving only a thin margin
// of true noise floor above instead of a wide dead band.
const FMAX_HZ = 850;
function hzToMel(hz) {
  return 2595 * Math.log10(1 + hz / 700);
}
function melToHz(mel) {
  return 700 * (Math.pow(10, mel / 2595) - 1);
}
const melMin = hzToMel(FMIN_HZ);
const melMax = hzToMel(FMAX_HZ);
const melEdges = Array.from({ length: N_MELS + 1 }, (_, i) => melMin + ((melMax - melMin) * i) / N_MELS);
const hzEdges = melEdges.map(melToHz);
const melCenterHz = Array.from({ length: N_MELS }, (_, m) => melToHz((melEdges[m] + melEdges[m + 1]) / 2));

// --- Short-time energy at each mel center via the Goertzel algorithm --------
// (avoids computing a full FFT per frame — only the frequencies we need)
// N_FFT=1024 gives a ~62.5 Hz main-lobe width (vs ~125 Hz at 512), narrower
// relative to the mel-bin spacing at low frequencies, while staying short
// enough that note onsets still land cleanly within a handful of frames.
const N_FFT = 1024;
const HOP = 384;
const N_FRAMES = Math.floor((N_SAMPLES - N_FFT) / HOP) + 1;

function goertzelPower(samples, start, n, freq, sampleRate) {
  const omega = (2 * Math.PI * freq) / sampleRate;
  const coeff = 2 * Math.cos(omega);
  let s1 = 0;
  let s2 = 0;
  for (let i = 0; i < n; i++) {
    const hann = 0.5 - 0.5 * Math.cos((2 * Math.PI * i) / (n - 1));
    const s0 = samples[start + i] * hann + coeff * s1 - s2;
    s2 = s1;
    s1 = s0;
  }
  const real = s1 - s2 * Math.cos(omega);
  const imag = s2 * Math.sin(omega);
  return real * real + imag * imag;
}

const powerMatrix = [];
let maxPower = 0;
for (let f = 0; f < N_FRAMES; f++) {
  const start = f * HOP;
  const row = new Array(N_MELS);
  for (let m = 0; m < N_MELS; m++) {
    const p = goertzelPower(audio, start, N_FFT, melCenterHz[m], SAMPLE_RATE);
    row[m] = p;
    if (p > maxPower) maxPower = p;
  }
  powerMatrix.push(row);
}

// power -> dB, referenced to peak power, floored for display dynamic range
// (widened from -80 to -90 dB so near-floor texture spreads across more of
// the color scale instead of clumping at one end)
const DB_FLOOR = -90;
const EPS = 1e-12;
const dbMatrix = powerMatrix.map((row) =>
  row.map((p) => Math.max(DB_FLOOR, 10 * Math.log10((p + EPS) / (maxPower + EPS))))
);
const normMatrix = dbMatrix.map((row) => row.map((db) => (db - DB_FLOOR) / -DB_FLOOR));

const timeEdges = Array.from({ length: N_FRAMES + 1 }, (_, f) => (f * HOP) / SAMPLE_RATE);

// --- Imprint sequential colormap (green -> blue), no other cmap allowed -----
function hexToRgb(hex) {
  const n = parseInt(hex.slice(1), 16);
  return [(n >> 16) & 255, (n >> 8) & 255, n & 255];
}
function rgbToHex(r, g, b) {
  return (
    "#" +
    [r, g, b]
      .map((v) => Math.max(0, Math.min(255, Math.round(v))).toString(16).padStart(2, "0"))
      .join("")
  );
}
// Gamma > 1 compresses the color response near the noise floor (small dB
// differences there barely shift hue, reading as a calm, quiet background)
// while expanding it near the loud peaks, so real note energy stands out
// instead of the whole grid looking like uniform colorful speckle.
const COLOR_GAMMA = 2.4;
function imprintSeq(frac) {
  const shaped = Math.pow(Math.max(0, Math.min(1, frac)), COLOR_GAMMA);
  const a = hexToRgb(t.seq[0]);
  const b = hexToRgb(t.seq[1]);
  return rgbToHex(
    a[0] + (b[0] - a[0]) * shaped,
    a[1] + (b[1] - a[1]) * shaped,
    a[2] + (b[2] - a[2]) * shaped
  );
}

// --- Chart: axes + chrome only, the mel grid is drawn as native SVG rects ---
// (the vendored core bundle has no heatmap module — chart.renderer.rect +
// axis.toPixels() is the idiomatic core-only substitute)
Highcharts.chart(
  "container",
  {
    chart: {
      type: "scatter",
      backgroundColor: "transparent",
      animation: false,
      style: { fontFamily: "inherit" },
      marginLeft: 110,
      marginRight: 170,
      marginTop: 90,
      marginBottom: 100,
    },
    credits: { enabled: false },
    title: {
      text: "spectrogram-mel · javascript · highcharts · anyplot.ai",
      style: { color: t.ink, fontSize: "22px", fontWeight: "600" },
    },
    subtitle: {
      text: "Synthetic melody · 2.4 s at 16 kHz · 48 mel bands",
      style: { color: t.inkSoft, fontSize: "14px" },
    },
    xAxis: {
      title: { text: "Time (s)", style: { color: t.inkSoft, fontSize: "16px" } },
      min: 0,
      max: timeEdges[N_FRAMES],
      tickInterval: 0.4,
      gridLineWidth: 0,
      lineColor: t.inkSoft,
      tickColor: t.inkSoft,
      labels: {
        style: { color: t.inkSoft, fontSize: "14px" },
        formatter() {
          return this.value.toFixed(1);
        },
      },
    },
    yAxis: {
      title: { text: "Frequency (Hz, mel-scaled)", style: { color: t.inkSoft, fontSize: "16px" } },
      min: 0,
      max: N_MELS,
      tickPositions: [0, N_MELS * 0.25, N_MELS * 0.5, N_MELS * 0.75, N_MELS],
      gridLineWidth: 0,
      lineColor: t.inkSoft,
      tickColor: t.inkSoft,
      labels: {
        style: { color: t.inkSoft, fontSize: "14px" },
        formatter() {
          return `${Math.round(hzEdges[this.value])} Hz`;
        },
      },
    },
    legend: { enabled: false },
    tooltip: { enabled: false },
    plotOptions: { series: { animation: false, enableMouseTracking: false } },
    series: [{ data: [], showInLegend: false }],
  },
  function (chart) {
    const xAxis = chart.xAxis[0];
    const yAxis = chart.yAxis[0];

    // Mel-power grid, cell-exact via axis.toPixels()
    const cellsGroup = chart.renderer.g("mel-cells").add();
    cellsGroup.attr({ zIndex: 3 });
    for (let f = 0; f < N_FRAMES; f++) {
      const xLeft = xAxis.toPixels(timeEdges[f]);
      const xRight = xAxis.toPixels(timeEdges[f + 1]);
      for (let m = 0; m < N_MELS; m++) {
        const yTop = yAxis.toPixels(m + 1);
        const yBottom = yAxis.toPixels(m);
        chart.renderer
          .rect(Math.min(xLeft, xRight), Math.min(yTop, yBottom), Math.abs(xRight - xLeft) + 0.5, Math.abs(
            yBottom - yTop
          ) + 0.5)
          .attr({ fill: imprintSeq(normMatrix[f][m]) })
          .add(cellsGroup);
      }
    }

    // Frame around the grid
    chart.renderer
      .rect(chart.plotLeft, chart.plotTop, chart.plotWidth, chart.plotHeight)
      .attr({ stroke: t.inkSoft, "stroke-width": 1, fill: "none", zIndex: 4 })
      .add();

    // Manual colorbar (labeled in dB) — the substitute for a colorAxis legend
    const barLeft = chart.plotLeft + chart.plotWidth + 40;
    const barWidth = 26;
    const steps = 120;
    const barGroup = chart.renderer.g("colorbar").add();
    for (let s = 0; s < steps; s++) {
      const frac = s / (steps - 1);
      const yPos = chart.plotTop + chart.plotHeight - ((s + 1) / steps) * chart.plotHeight;
      chart.renderer
        .rect(barLeft, yPos, barWidth, chart.plotHeight / steps + 0.5)
        .attr({ fill: imprintSeq(frac) })
        .add(barGroup);
    }
    chart.renderer
      .rect(barLeft, chart.plotTop, barWidth, chart.plotHeight)
      .attr({ stroke: t.inkSoft, "stroke-width": 1, fill: "none" })
      .add(barGroup);
    [DB_FLOOR, DB_FLOOR / 2, 0].forEach((db) => {
      const frac = (db - DB_FLOOR) / -DB_FLOOR;
      const y = chart.plotTop + chart.plotHeight - frac * chart.plotHeight;
      chart.renderer
        .text(`${db} dB`, barLeft + barWidth + 10, y + 5)
        .css({ color: t.inkSoft, fontSize: "13px" })
        .add(barGroup);
    });
    chart.renderer
      .text("Power (dB)", barLeft - 6, chart.plotTop - 16)
      .css({ color: t.inkSoft, fontSize: "14px" })
      .add(barGroup);
  }
);
Runnable source as JSON, for any HTTP client: https://api.anyplot.ai/specs/spectrogram-mel/highcharts/code. Any spec id and library id listed in llms-full.txt fit the same URL shape; every URL below is complete and callable.
{
  "spec_id": "spectrogram-mel",
  "language": "javascript",
  "library": "highcharts",
  "page": "https://anyplot.ai/spectrogram-mel/javascript/highcharts",
  "hub": "https://anyplot.ai/spectrogram-mel",
  "code_json": "https://api.anyplot.ai/specs/spectrogram-mel/highcharts/code",
  "spec_json": "https://api.anyplot.ai/specs/spectrogram-mel",
  "render_light_png": "https://storage.googleapis.com/anyplot-images/plots/spectrogram-mel/javascript/highcharts/plot-light.png",
  "render_dark_png": "https://storage.googleapis.com/anyplot-images/plots/spectrogram-mel/javascript/highcharts/plot-dark.png",
  "interactive_light_html": "https://storage.googleapis.com/anyplot-images/plots/spectrogram-mel/javascript/highcharts/plot-light.html",
  "interactive_dark_html": "https://storage.googleapis.com/anyplot-images/plots/spectrogram-mel/javascript/highcharts/plot-dark.html",
  "quality_score": 82.0,
  "license": "MIT",
  "guide": "https://anyplot.ai/llms.txt"
}
Part of Mel-Spectrogram for Audio Analysis on anyplot.ai.