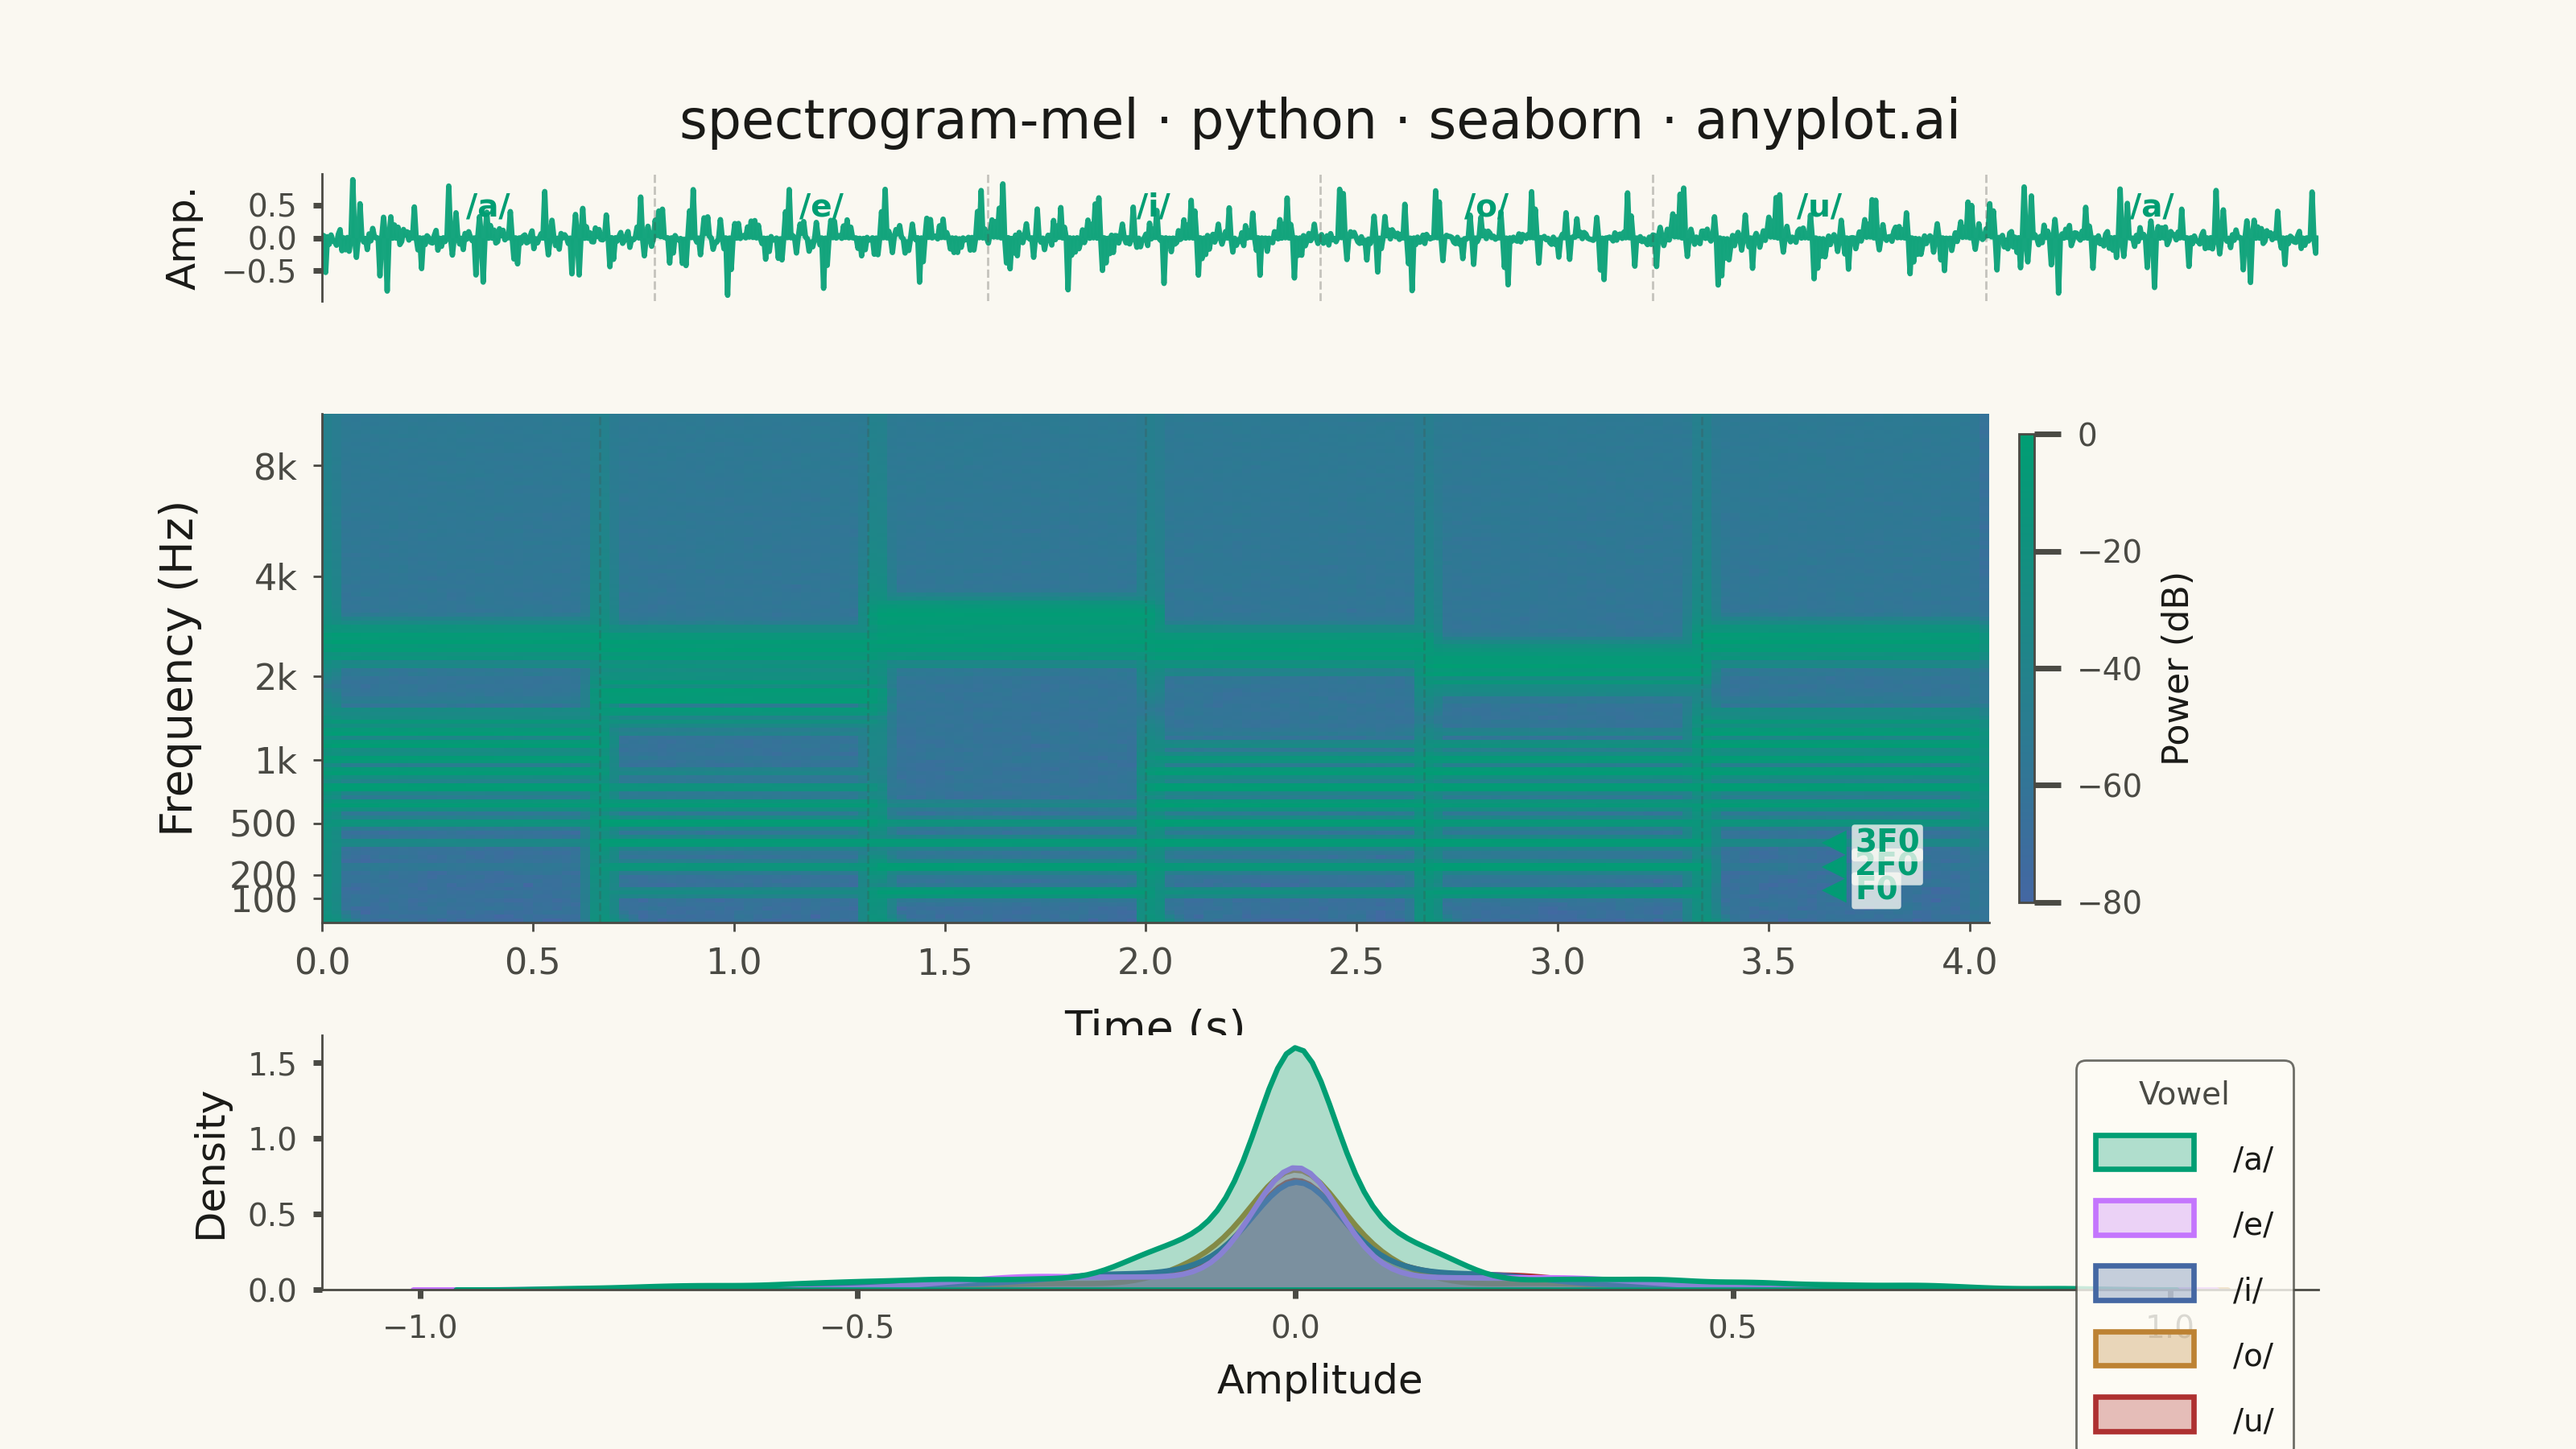
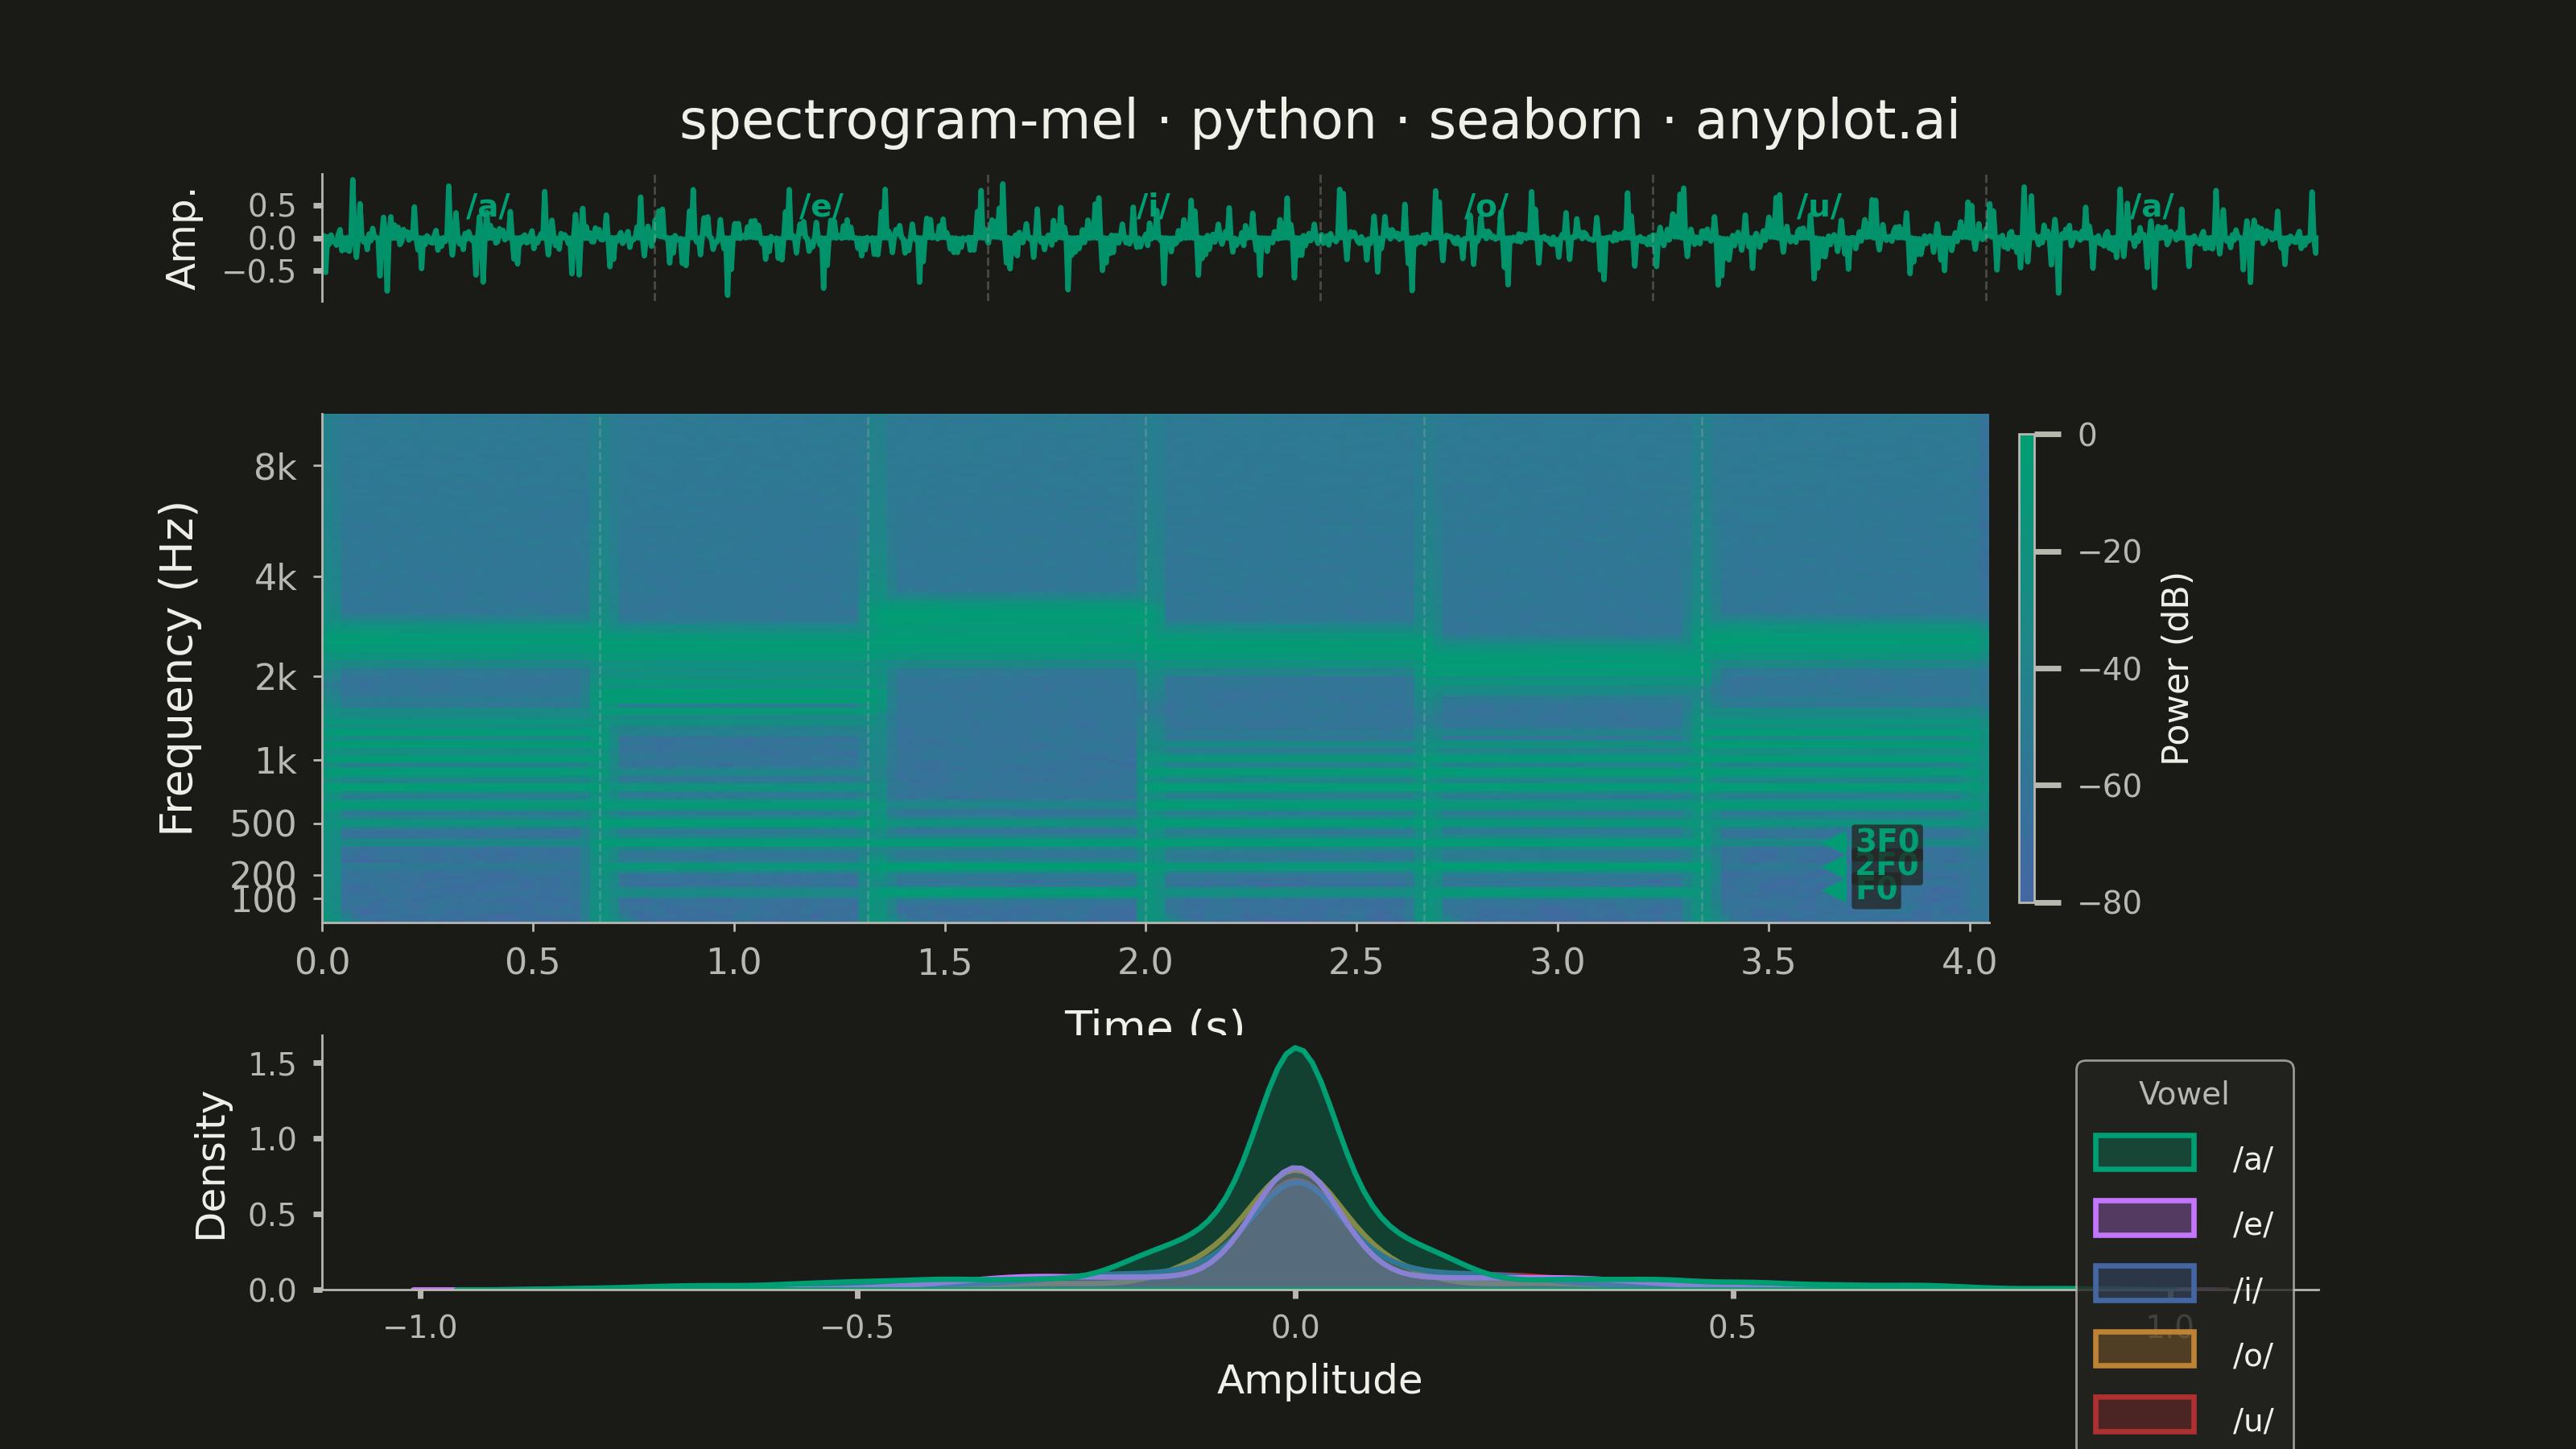
A mel-spectrogram displaying the power spectrum of an audio signal with the frequency axis warped to the mel scale, which approximates human auditory perception. Unlike a standard spectrogram with a linear frequency axis, the mel-spectrogram compresses higher frequencies and expands lower frequencies, making perceptually similar sounds visually closer together. This is the foundational input representation for modern audio machine learning pipelines including speech recognition, speaker identification, and music information retrieval.
""" anyplot.ai
spectrogram-mel: Mel-Spectrogram for Audio Analysis
Library: seaborn 0.13.2 | Python 3.13.13
Quality: 87/100 | Updated: 2026-06-03
"""

import os
import sys


# Avoid seaborn.py (this file) being imported as the seaborn package itself
_script_dir = os.path.dirname(os.path.abspath(__file__))
if _script_dir in sys.path:
    sys.path.remove(_script_dir)

import matplotlib.pyplot as plt
import numpy as np
import pandas as pd
import seaborn as sns
from matplotlib.colors import LinearSegmentedColormap
from scipy.signal import stft


sys.path.insert(0, _script_dir)

# Theme tokens — Imprint palette + theme-adaptive chrome
THEME = os.getenv("ANYPLOT_THEME", "light")
PAGE_BG = "#FAF8F1" if THEME == "light" else "#1A1A17"
ELEVATED_BG = "#FFFDF6" if THEME == "light" else "#242420"
INK = "#1A1A17" if THEME == "light" else "#F0EFE8"
INK_SOFT = "#4A4A44" if THEME == "light" else "#B8B7B0"
BRAND = "#009E73"  # Imprint palette pos 1 — first series

IMPRINT_PALETTE = ["#009E73", "#C475FD", "#4467A3", "#BD8233", "#AE3030", "#2ABCCD"]

# Reversed sequential colormap: blue (low energy) → green (high energy = brand color)
imprint_seq = LinearSegmentedColormap.from_list("imprint_seq", ["#4467A3", "#009E73"])

sns.set_theme(
    style="ticks",
    rc={
        "figure.facecolor": PAGE_BG,
        "axes.facecolor": PAGE_BG,
        "axes.edgecolor": INK_SOFT,
        "axes.labelcolor": INK,
        "text.color": INK,
        "xtick.color": INK_SOFT,
        "ytick.color": INK_SOFT,
        "grid.color": INK,
        "grid.alpha": 0.15,
        "legend.facecolor": ELEVATED_BG,
        "legend.edgecolor": INK_SOFT,
    },
)

# Data — synthesized vowel speech sounds with formant resonances (IPA vowel sequence)
np.random.seed(42)
sample_rate = 22050
duration = 4.0
n_fft = 2048
hop_length = 512
n_mels = 128
F0 = 130.0  # glottal fundamental frequency (male voice, Hz)

t = np.linspace(0, duration, int(sample_rate * duration), endpoint=False)

# IPA vowels with [F1, F2, F3] formant frequencies — each vowel has a distinct
# spectral envelope that produces characteristic formant bands in the mel-spectrogram
vowels = [
    ("/a/", [780, 1200, 2600]),  # "father" — open central vowel
    ("/e/", [500, 1750, 2500]),  # "bed"    — mid front vowel
    ("/i/", [240, 2600, 3100]),  # "beet"   — high front vowel
    ("/o/", [450, 800, 2500]),  # "coat"   — mid back vowel
    ("/u/", [310, 870, 2200]),  # "boot"   — high back vowel
    ("/a/", [780, 1200, 2600]),  # "father" — return (closes the sequence)
]
vowel_labels = [v[0] for v in vowels]
vowel_formants_list = [v[1] for v in vowels]
n_vowels = len(vowels)
segment_len = len(t) // n_vowels

audio = np.zeros_like(t)
harmonics = F0 * np.arange(1, 50)
bw = 150.0  # formant bandwidth in Hz

for i, formants in enumerate(vowel_formants_list):
    start = i * segment_len
    end = start + segment_len if i < n_vowels - 1 else len(t)
    seg_t = t[start:end] - t[start]

    # Formant amplitude envelope: sum of Gaussian peaks at F1, F2, F3
    amp_env = sum(np.exp(-((harmonics - f) ** 2) / (2 * bw**2)) for f in formants)
    amp_env /= amp_env.max() + 1e-9

    # Vectorized harmonic synthesis: shape (n_harmonics, segment_len)
    h_matrix = np.sin(2 * np.pi * harmonics[:, np.newaxis] * seg_t[np.newaxis, :])
    seg_signal = amp_env @ h_matrix  # weighted sum → shape (segment_len,)

    # Amplitude shaping: smooth decay + onset transient for natural articulation
    envelope = 0.7 + 0.3 * np.exp(-2.0 * seg_t / (seg_t[-1] + 1e-9))
    audio[start:end] = seg_signal * envelope + 0.3 * np.exp(-80.0 * seg_t)

audio += 0.01 * np.random.randn(len(audio))
audio /= np.abs(audio).max() + 1e-9  # normalize to [-1, 1]

# STFT and power spectrum
freqs_stft, times_stft, Zxx = stft(audio, fs=sample_rate, nperseg=n_fft, noverlap=n_fft - hop_length)
power_spectrum = np.abs(Zxx) ** 2

# Mel filterbank — fully vectorized with numpy broadcasting (no nested Python loops)
mel_min = 2595.0 * np.log10(1.0 + 0.0 / 700.0)
mel_max = 2595.0 * np.log10(1.0 + (sample_rate / 2.0) / 700.0)
mel_points = np.linspace(mel_min, mel_max, n_mels + 2)
hz_points = 700.0 * (10.0 ** (mel_points / 2595.0) - 1.0)
bin_indices = np.clip(np.floor((n_fft + 1) * hz_points / sample_rate).astype(int), 0, len(freqs_stft) - 1)

bin_range = np.arange(len(freqs_stft))  # shape (n_freqs,)
f_l = bin_indices[:-2, np.newaxis]  # shape (n_mels, 1)
f_c = bin_indices[1:-1, np.newaxis]  # shape (n_mels, 1)
f_r = bin_indices[2:, np.newaxis]  # shape (n_mels, 1)
rise_denom = np.where(f_c > f_l, f_c - f_l, 1)
fall_denom = np.where(f_r > f_c, f_r - f_c, 1)
filterbank = np.where((bin_range >= f_l) & (bin_range < f_c), (bin_range - f_l) / rise_denom, 0.0) + np.where(
    (bin_range >= f_c) & (bin_range < f_r), (f_r - bin_range) / fall_denom, 0.0
)

mel_spec = filterbank @ power_spectrum
mel_spec_db = 10 * np.log10(np.maximum(mel_spec, 1e-10))
mel_spec_db -= mel_spec_db.max()  # normalize to 0 dB peak

mel_center_freqs = 700.0 * (10.0 ** (mel_points[1:-1] / 2595.0) - 1.0)
mel_spec_flipped = mel_spec_db[::-1]  # flip so low frequency sits at bottom

df_spec = pd.DataFrame(mel_spec_flipped, index=np.arange(n_mels), columns=np.arange(mel_spec_flipped.shape[1]))
step = 80
wave_df = pd.DataFrame({"Time (s)": t[::step], "Amplitude": audio[::step]})

# Amplitude distribution per vowel for seaborn KDE statistical panel
kde_records = []
for i, (lbl, _) in enumerate(vowels):
    start = i * segment_len
    end = start + segment_len if i < n_vowels - 1 else len(t)
    for amp in audio[start:end:20]:  # downsample for performance
        kde_records.append({"Vowel": lbl, "Amplitude": float(amp)})
kde_df = pd.DataFrame(kde_records)

# Palette mapping for unique vowels (two /a/ segments merge automatically)
vowel_palette = {lbl: IMPRINT_PALETTE[j] for j, lbl in enumerate(["/a/", "/e/", "/i/", "/o/", "/u/"])}

# Plot — three-panel layout: waveform / mel-spectrogram / amplitude KDE distributions
fig, (ax_wave, ax_spec, ax_kde) = plt.subplots(
    3, 1, figsize=(8, 4.5), dpi=400, height_ratios=[1, 4, 2], gridspec_kw={"hspace": 0.38}
)
fig.patch.set_facecolor(PAGE_BG)

# Title on waveform panel
title = "spectrogram-mel · python · seaborn · anyplot.ai"
title_fs = round(12 * min(1.0, 67 / len(title)))
ax_wave.set_title(title, fontsize=title_fs, fontweight="medium", pad=8, color=INK)

# Top panel: waveform via seaborn lineplot
sns.lineplot(data=wave_df, x="Time (s)", y="Amplitude", ax=ax_wave, color=BRAND, linewidth=1.2, alpha=0.9)
ax_wave.fill_between(wave_df["Time (s)"], wave_df["Amplitude"], alpha=0.12, color=BRAND)
ax_wave.set_xlim(0, duration)
ax_wave.set_ylabel("Amp.", fontsize=9, labelpad=4, color=INK)
ax_wave.set_xlabel("")
ax_wave.tick_params(axis="y", labelsize=7, length=2, colors=INK_SOFT)
ax_wave.tick_params(axis="x", labelbottom=False, length=0)

# Vowel IPA labels and segment boundaries on waveform
y_min, y_max = ax_wave.get_ylim()
for i in range(n_vowels):
    mid_time = (i + 0.5) * segment_len / sample_rate
    ax_wave.text(
        mid_time, y_max * 0.72, vowel_labels[i], ha="center", va="top", fontsize=7, color=BRAND, fontweight="bold"
    )
for i in range(1, n_vowels):
    bnd_time = i * segment_len / sample_rate
    ax_wave.axvline(x=bnd_time, color=INK_SOFT, alpha=0.3, linewidth=0.5, linestyle="--")

sns.despine(ax=ax_wave, bottom=True)
for sp in ax_wave.spines.values():
    sp.set_edgecolor(INK_SOFT)
    sp.set_linewidth(0.5)

# Middle panel: mel-spectrogram heatmap (seaborn-native)
sns.heatmap(
    df_spec,
    ax=ax_spec,
    cmap=imprint_seq,
    vmin=-80,
    vmax=0,
    cbar_kws={"label": "Power (dB)", "pad": 0.015, "aspect": 30, "shrink": 0.92},
    xticklabels=False,
    yticklabels=False,
    rasterized=True,
)

# Time axis ticks
x_tick_seconds = np.arange(0, 4.5, 0.5)
x_tick_positions = [np.argmin(np.abs(times_stft - s)) for s in x_tick_seconds]
ax_spec.set_xticks(x_tick_positions)
ax_spec.set_xticklabels([f"{s:.1f}" for s in x_tick_seconds], fontsize=8, color=INK_SOFT)

# Mel frequency axis ticks with Hz labels at perceptually relevant positions
tick_freqs = [100, 200, 500, 1000, 2000, 4000, 8000]
y_ticks, y_labels = [], []
for freq in tick_freqs:
    idx = np.argmin(np.abs(mel_center_freqs - freq))
    y_ticks.append(n_mels - 1 - idx)
    y_labels.append(f"{freq // 1000}k" if freq >= 1000 else str(freq))

ax_spec.set_yticks(y_ticks)
ax_spec.set_yticklabels(y_labels, fontsize=8, color=INK_SOFT)

# Colorbar styling
cbar = ax_spec.collections[0].colorbar
cbar.ax.tick_params(labelsize=7, colors=INK_SOFT)
cbar.set_label("Power (dB)", fontsize=8, color=INK)
cbar.outline.set_edgecolor(INK_SOFT)
cbar.outline.set_linewidth(0.5)

# Harmonic annotations on the final /a/ segment — show F0 overtone series
last_seg_mid = (n_vowels - 0.5) * segment_len / sample_rate
x_anno = np.argmin(np.abs(times_stft - last_seg_mid))
for h, label in [(1, "F0"), (2, "2F0"), (3, "3F0")]:
    freq_h = F0 * h
    mel_idx = np.argmin(np.abs(mel_center_freqs - freq_h))
    y_pos = n_mels - 1 - mel_idx
    ax_spec.plot(x_anno, y_pos, marker="<", color=BRAND, markersize=4, alpha=0.9)
    ax_spec.text(
        x_anno + 2,
        y_pos,
        label,
        fontsize=7,
        color=BRAND,
        fontweight="bold",
        va="center",
        ha="left",
        bbox={"boxstyle": "round,pad=0.1", "facecolor": ELEVATED_BG, "edgecolor": "none", "alpha": 0.75},
    )

# Vowel boundaries on spectrogram
for i in range(1, n_vowels):
    bnd_time = i * segment_len / sample_rate
    x_pos = np.argmin(np.abs(times_stft - bnd_time))
    ax_spec.axvline(x=x_pos, color=INK_SOFT, alpha=0.25, linewidth=0.5, linestyle="--")

ax_spec.set_xlabel("Time (s)", fontsize=10, labelpad=6, color=INK)
ax_spec.set_ylabel("Frequency (Hz)", fontsize=10, labelpad=6, color=INK)
ax_spec.tick_params(axis="both", length=2, width=0.5)

sns.despine(ax=ax_spec, top=True, right=True)
for sp in ax_spec.spines.values():
    sp.set_edgecolor(INK_SOFT)
    sp.set_linewidth(0.5)

# Bottom panel: amplitude distribution per vowel — seaborn KDE statistical visualization
sns.kdeplot(
    data=kde_df,
    x="Amplitude",
    hue="Vowel",
    ax=ax_kde,
    fill=True,
    alpha=0.3,
    linewidth=1.2,
    palette=vowel_palette,
    hue_order=["/a/", "/e/", "/i/", "/o/", "/u/"],
    bw_adjust=0.8,
)
ax_kde.set_xlabel("Amplitude", fontsize=9, labelpad=4, color=INK)
ax_kde.set_ylabel("Density", fontsize=9, labelpad=4, color=INK)
ax_kde.tick_params(axis="both", labelsize=7, length=2, colors=INK_SOFT)

# Style the KDE legend — placed upper-right to avoid overlap with waveform area
legend = ax_kde.get_legend()
if legend:
    legend.set_bbox_to_anchor((1.0, 1.0))
    legend.set_loc("upper right")
    legend.get_frame().set_facecolor(ELEVATED_BG)
    legend.get_frame().set_edgecolor(INK_SOFT)
    legend.get_frame().set_linewidth(0.5)
    for text in legend.get_texts():
        text.set_color(INK)
        text.set_fontsize(7)
    legend.get_title().set_color(INK_SOFT)
    legend.get_title().set_fontsize(7)

sns.despine(ax=ax_kde, top=True, right=True)
for sp in ax_kde.spines.values():
    sp.set_edgecolor(INK_SOFT)
    sp.set_linewidth(0.5)

# Save — bbox_inches must stay default (None) to preserve exact 3200×1800 canvas
plt.savefig(f"plot-{THEME}.png", dpi=400, facecolor=PAGE_BG)
Runnable source as JSON, for any HTTP client: https://api.anyplot.ai/specs/spectrogram-mel/seaborn/code. Any spec id and library id listed in llms-full.txt fit the same URL shape; every URL below is complete and callable.
{
  "spec_id": "spectrogram-mel",
  "language": "python",
  "library": "seaborn",
  "page": "https://anyplot.ai/spectrogram-mel/python/seaborn",
  "hub": "https://anyplot.ai/spectrogram-mel",
  "code_json": "https://api.anyplot.ai/specs/spectrogram-mel/seaborn/code",
  "spec_json": "https://api.anyplot.ai/specs/spectrogram-mel",
  "render_light_png": "https://storage.googleapis.com/anyplot-images/plots/spectrogram-mel/python/seaborn/plot-light.png",
  "render_dark_png": "https://storage.googleapis.com/anyplot-images/plots/spectrogram-mel/python/seaborn/plot-dark.png",
  "quality_score": 87.0,
  "license": "MIT",
  "guide": "https://anyplot.ai/llms.txt"
}
Part of Mel-Spectrogram for Audio Analysis on anyplot.ai.