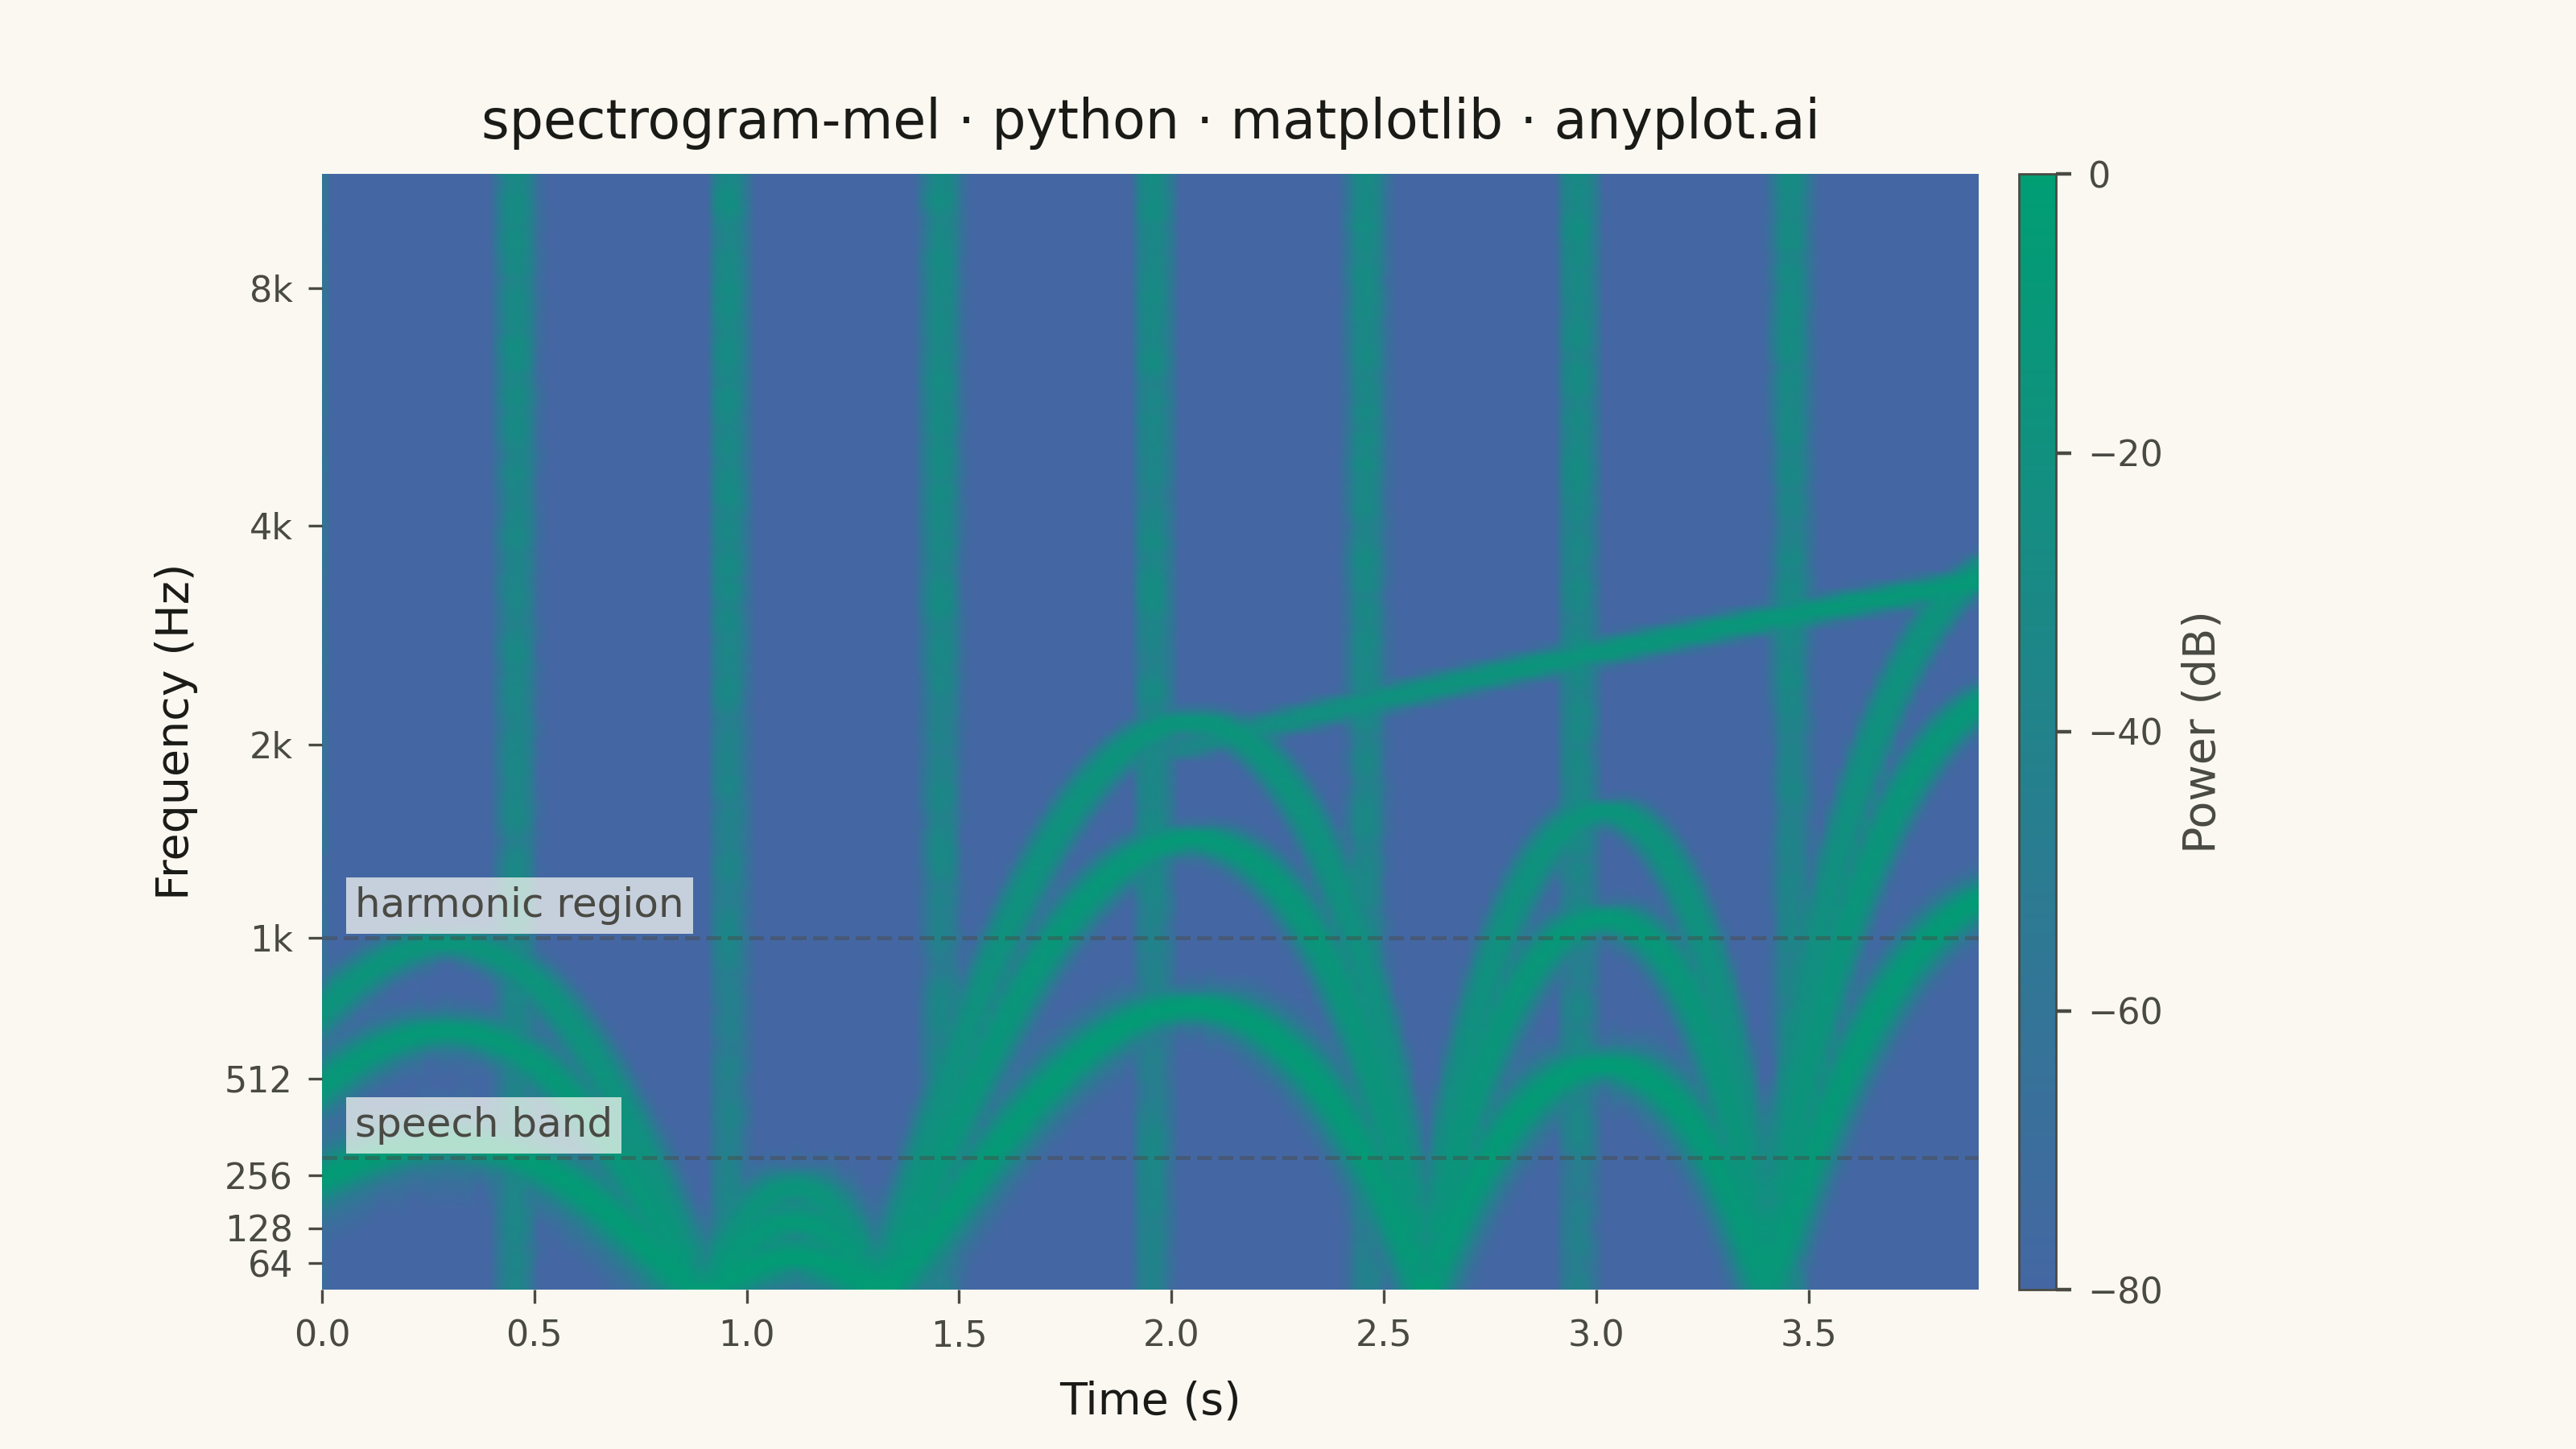
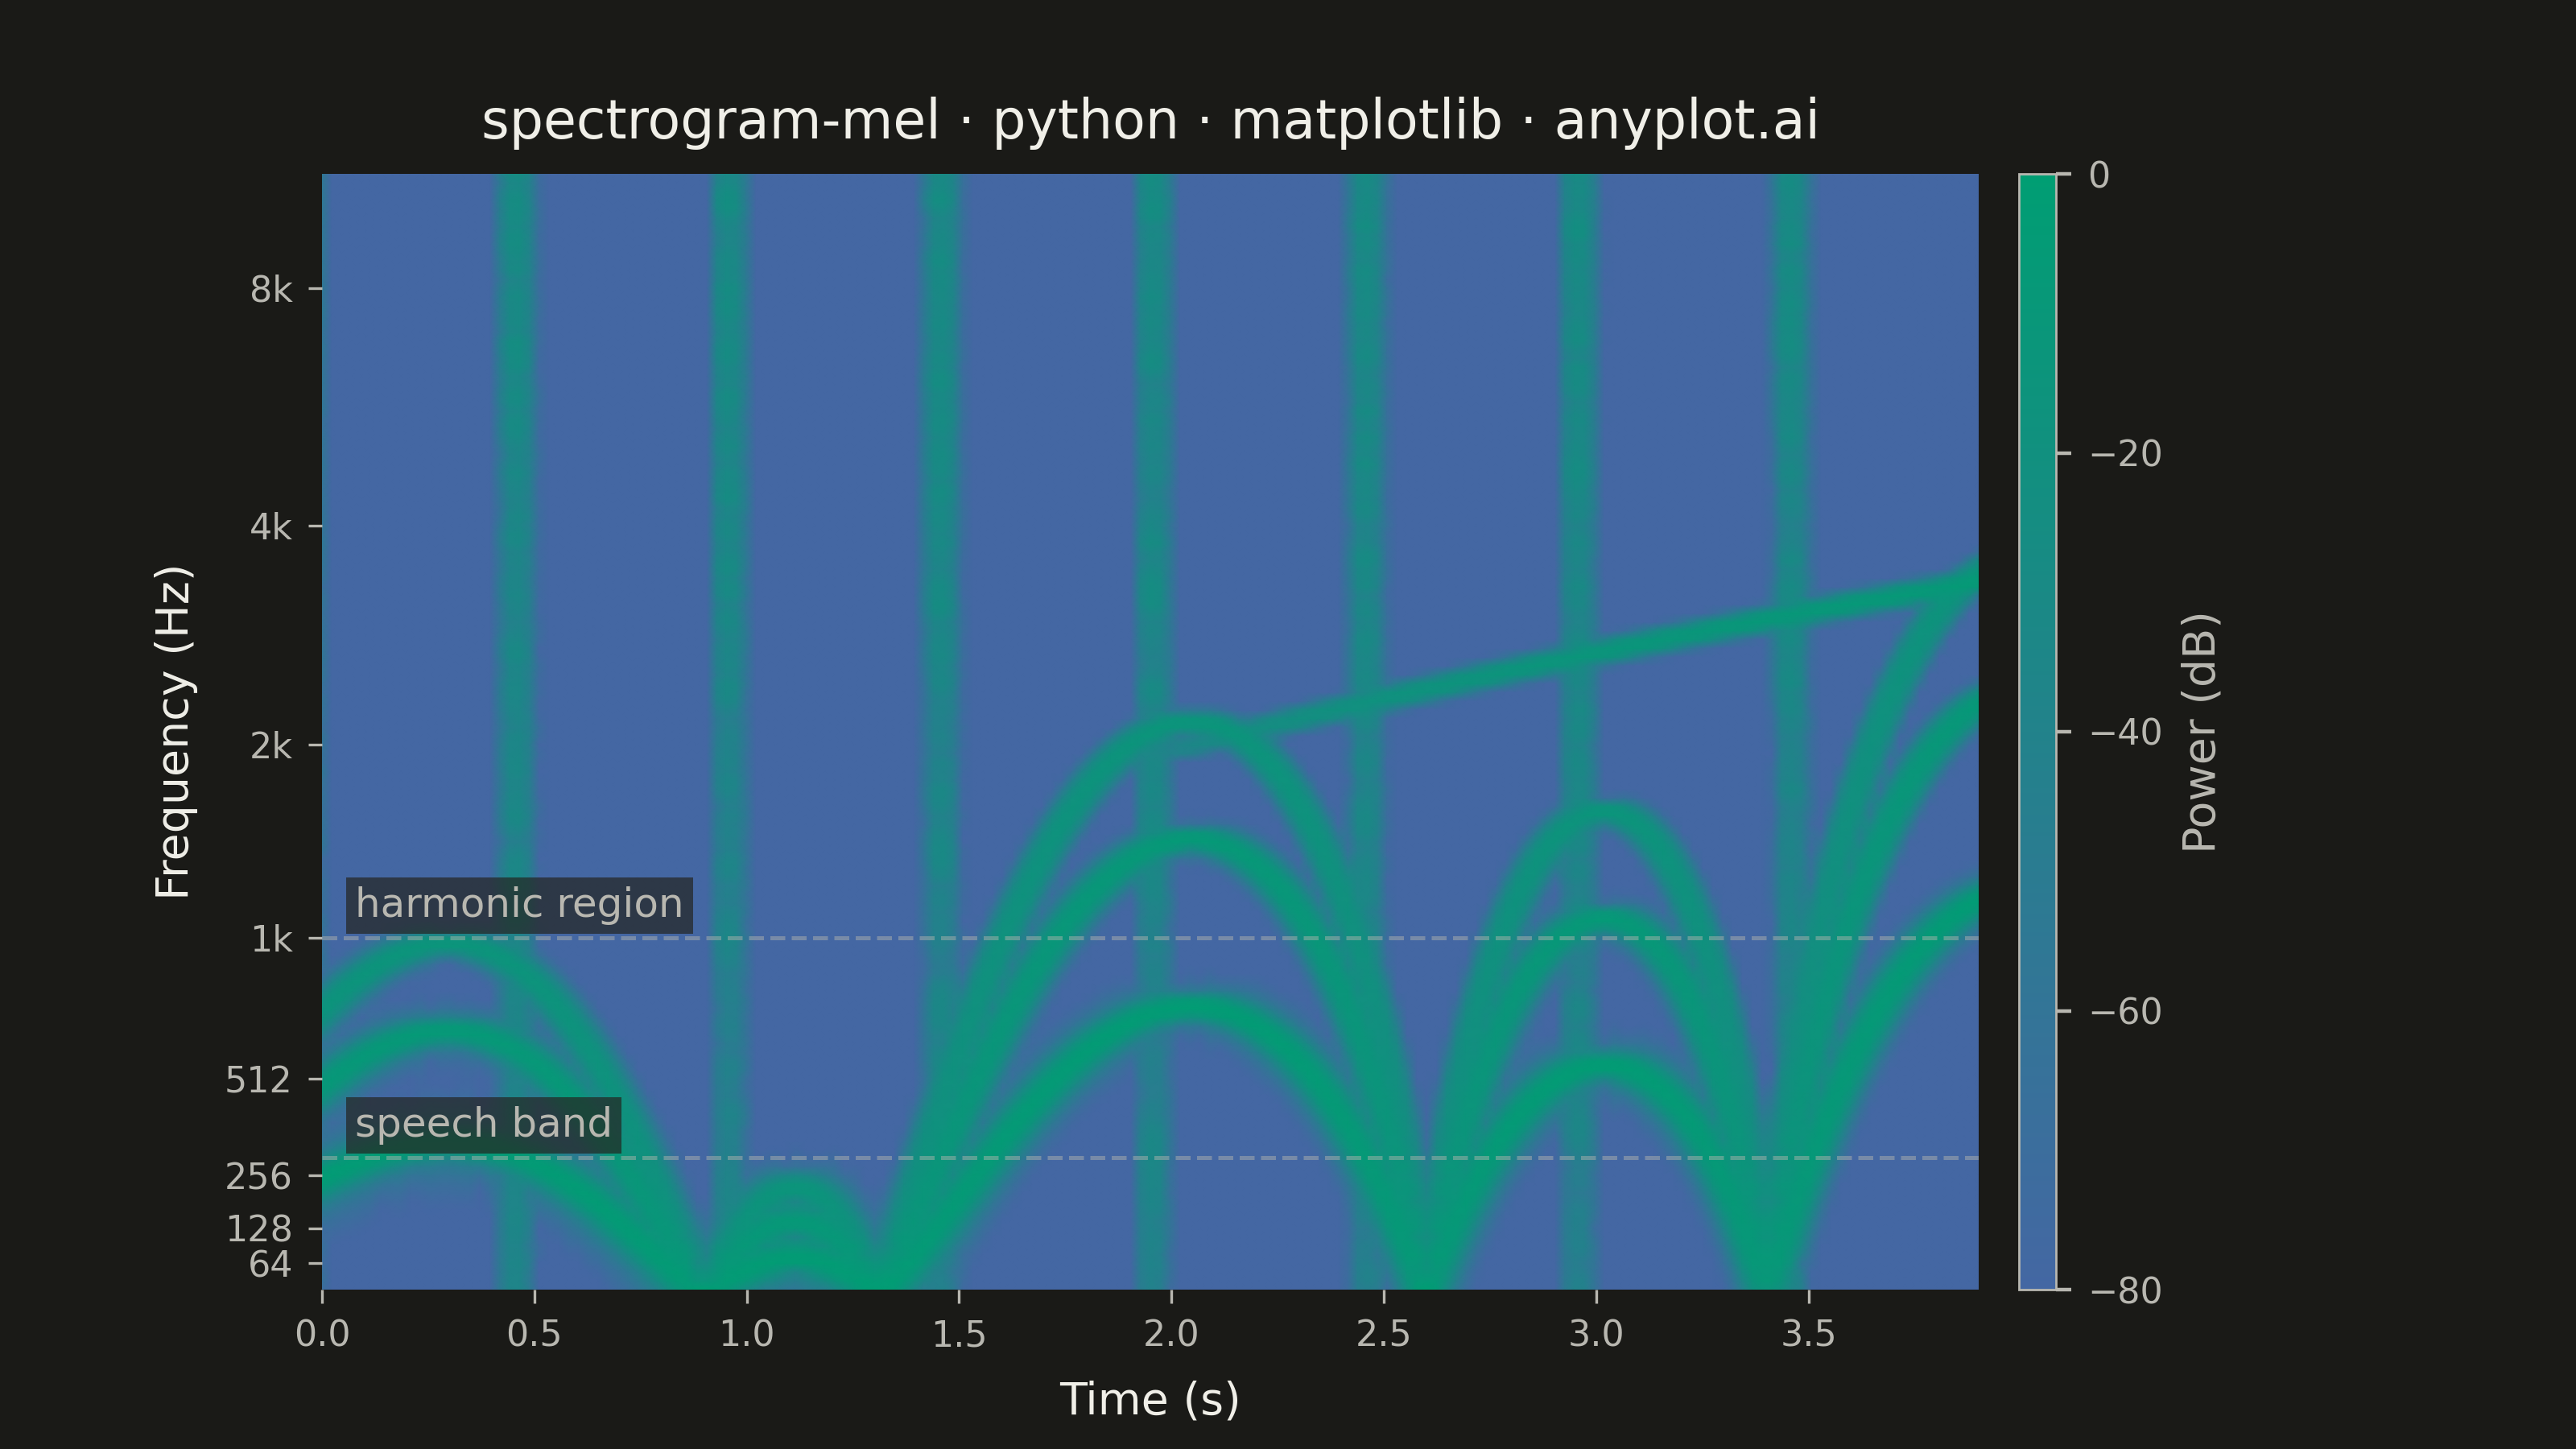
A mel-spectrogram displaying the power spectrum of an audio signal with the frequency axis warped to the mel scale, which approximates human auditory perception. Unlike a standard spectrogram with a linear frequency axis, the mel-spectrogram compresses higher frequencies and expands lower frequencies, making perceptually similar sounds visually closer together. This is the foundational input representation for modern audio machine learning pipelines including speech recognition, speaker identification, and music information retrieval.
""" anyplot.ai
spectrogram-mel: Mel-Spectrogram for Audio Analysis
Library: matplotlib 3.10.9 | Python 3.13.13
Quality: 90/100 | Updated: 2026-06-03
"""

import os
import sys


# This file is named matplotlib.py — remove its directory from sys.path so
# "import matplotlib" resolves to the installed package, not this file.
_here = os.path.abspath(os.path.dirname(__file__))
sys.path = [p for p in sys.path if os.path.abspath(p or ".") != _here]

import matplotlib.pyplot as plt
import numpy as np
from matplotlib.colors import LinearSegmentedColormap, Normalize
from matplotlib.ticker import FuncFormatter


THEME = os.getenv("ANYPLOT_THEME", "light")

# Theme-adaptive chrome tokens — Imprint palette
PAGE_BG = "#FAF8F1" if THEME == "light" else "#1A1A17"
ELEVATED_BG = "#FFFDF6" if THEME == "light" else "#242420"
INK = "#1A1A17" if THEME == "light" else "#F0EFE8"
INK_SOFT = "#4A4A44" if THEME == "light" else "#B8B7B0"
INK_MUTED = "#6B6A63" if THEME == "light" else "#A8A79F"

# Imprint sequential colormap — reversed so high energy (signal) maps to brand green,
# low energy (noise floor) maps to blue; makes signal features stand out clearly.
imprint_seq = LinearSegmentedColormap.from_list("imprint_seq", ["#4467A3", "#009E73"])

# --- Data: synthesize a rich audio signal with melody-like frequency components ---
np.random.seed(42)
sample_rate = 22050
duration = 4.0
n_samples = int(sample_rate * duration)
t = np.linspace(0, duration, n_samples, endpoint=False)

# Melody: frequency sweeps and harmonics simulating speech-like signal
melody_freq = 220 + 80 * np.sin(2 * np.pi * 0.5 * t)
audio_signal = 0.5 * np.sin(2 * np.pi * melody_freq * t)
audio_signal += 0.3 * np.sin(2 * np.pi * 2 * melody_freq * t)
audio_signal += 0.15 * np.sin(2 * np.pi * 3 * melody_freq * t)

# Percussive bursts at regular intervals
for onset in np.arange(0.0, duration, 0.5):
    onset_idx = int(onset * sample_rate)
    burst_len = int(0.05 * sample_rate)
    end_idx = min(onset_idx + burst_len, n_samples)
    envelope = np.exp(-np.linspace(0, 8, end_idx - onset_idx))
    audio_signal[onset_idx:end_idx] += 0.4 * envelope * np.random.randn(end_idx - onset_idx)

# Rising tone in the second half
rising_freq = np.linspace(500, 2000, n_samples)
rising_mask = np.zeros(n_samples)
rising_mask[n_samples // 2 :] = np.linspace(0, 0.3, n_samples - n_samples // 2)
audio_signal += rising_mask * np.sin(2 * np.pi * rising_freq * t)

audio_signal = audio_signal / np.max(np.abs(audio_signal))

# STFT (n_fft=2048, hop_length=512, n_mels=128 per spec)
n_fft = 2048
hop_length = 512
n_mels = 128

n_frames = 1 + (n_samples - n_fft) // hop_length
window = np.hanning(n_fft)
stft_matrix = np.zeros((n_fft // 2 + 1, n_frames))
for i in range(n_frames):
    start = i * hop_length
    frame = audio_signal[start : start + n_fft] * window
    spectrum = np.fft.rfft(frame)
    stft_matrix[:, i] = np.abs(spectrum) ** 2

# Mel filter bank (vectorized)
f_min = 0.0
f_max = sample_rate / 2.0
mel_min = 2595.0 * np.log10(1.0 + f_min / 700.0)
mel_max = 2595.0 * np.log10(1.0 + f_max / 700.0)
mel_points = np.linspace(mel_min, mel_max, n_mels + 2)
hz_points = 700.0 * (10.0 ** (mel_points / 2595.0) - 1.0)
fft_freqs = np.fft.rfftfreq(n_fft, 1.0 / sample_rate)

mel_filterbank = np.zeros((n_mels, len(fft_freqs)))
for m in range(n_mels):
    f_left, f_center, f_right = hz_points[m], hz_points[m + 1], hz_points[m + 2]
    up_slope = np.where(
        (fft_freqs >= f_left) & (fft_freqs <= f_center) & (f_center > f_left),
        (fft_freqs - f_left) / (f_center - f_left),
        0.0,
    )
    down_slope = np.where(
        (fft_freqs > f_center) & (fft_freqs <= f_right) & (f_right > f_center),
        (f_right - fft_freqs) / (f_right - f_center),
        0.0,
    )
    mel_filterbank[m] = up_slope + down_slope

# Apply mel filter bank and convert to dB scale
mel_spectrogram = mel_filterbank @ stft_matrix
mel_spectrogram = np.maximum(mel_spectrogram, 1e-10)
mel_spectrogram_db = 10.0 * np.log10(mel_spectrogram)
mel_spectrogram_db -= mel_spectrogram_db.max()

time_axis = np.arange(n_frames) * hop_length / sample_rate
mel_freqs = hz_points[1:-1]

# --- Plot ---
fig, ax = plt.subplots(figsize=(8, 4.5), dpi=400, facecolor=PAGE_BG)
ax.set_facecolor(PAGE_BG)

img = ax.pcolormesh(
    time_axis,
    np.arange(n_mels),
    mel_spectrogram_db,
    cmap=imprint_seq,
    shading="gouraud",
    norm=Normalize(vmin=-80, vmax=0),
    rasterized=True,
)

# Y-axis: Hz labels at key mel band edges
tick_hz_values = [64, 128, 256, 512, 1024, 2048, 4096, 8000]
tick_mel_indices = []
tick_labels = []
for hz in tick_hz_values:
    if hz <= f_max:
        idx = np.argmin(np.abs(mel_freqs - hz))
        tick_mel_indices.append(idx)
        tick_labels.append(f"{hz // 1000}k" if hz >= 1000 else str(hz))
ax.set_yticks(tick_mel_indices)
ax.set_yticklabels(tick_labels)

ax.xaxis.set_major_formatter(FuncFormatter(lambda x, _: f"{x:.1f}"))

# Colorbar with dB scale
cbar = fig.colorbar(img, ax=ax, pad=0.02, aspect=30)
cbar.set_label("Power (dB)", fontsize=10, color=INK_SOFT)
cbar.set_ticks([0, -20, -40, -60, -80])
cbar.set_ticklabels(["0", "−20", "−40", "−60", "−80"])
cbar.ax.tick_params(labelsize=8, colors=INK_SOFT)
cbar.outline.set_edgecolor(INK_SOFT)
cbar.outline.set_linewidth(0.5)

# Reference lines with text labels — more visible than before, guides the viewer
speech_idx = np.argmin(np.abs(mel_freqs - 300))
harmonic_idx = np.argmin(np.abs(mel_freqs - 1000))
ax.axhline(y=speech_idx, color=INK_SOFT, alpha=0.45, linewidth=0.9, linestyle="--")
ax.axhline(y=harmonic_idx, color=INK_SOFT, alpha=0.45, linewidth=0.9, linestyle="--")
ax.text(
    time_axis[-1] * 0.02,
    speech_idx + 1.5,
    "speech band",
    fontsize=9,
    color=INK_SOFT,
    va="bottom",
    ha="left",
    bbox={"facecolor": ELEVATED_BG, "edgecolor": "none", "alpha": 0.7, "pad": 2},
)
ax.text(
    time_axis[-1] * 0.02,
    harmonic_idx + 1.5,
    "harmonic region",
    fontsize=9,
    color=INK_SOFT,
    va="bottom",
    ha="left",
    bbox={"facecolor": ELEVATED_BG, "edgecolor": "none", "alpha": 0.7, "pad": 2},
)

# Chrome — theme-adaptive
title = "spectrogram-mel · python · matplotlib · anyplot.ai"
ax.set_title(title, fontsize=12, fontweight="medium", color=INK, pad=8)
ax.set_xlabel("Time (s)", fontsize=10, color=INK, labelpad=6)
ax.set_ylabel("Frequency (Hz)", fontsize=10, color=INK, labelpad=6)
ax.tick_params(axis="both", labelsize=8, colors=INK_SOFT, labelcolor=INK_SOFT)
ax.tick_params(axis="x", which="both", length=3, width=0.6, color=INK_SOFT)
ax.tick_params(axis="y", which="both", length=3, width=0.6, color=INK_SOFT)

for spine in ax.spines.values():
    spine.set_visible(False)

plt.savefig(f"plot-{THEME}.png", dpi=400, facecolor=PAGE_BG)
plt.close()
Runnable source as JSON, for any HTTP client: https://api.anyplot.ai/specs/spectrogram-mel/matplotlib/code. Any spec id and library id listed in llms-full.txt fit the same URL shape; every URL below is complete and callable.
{
  "spec_id": "spectrogram-mel",
  "language": "python",
  "library": "matplotlib",
  "page": "https://anyplot.ai/spectrogram-mel/python/matplotlib",
  "hub": "https://anyplot.ai/spectrogram-mel",
  "code_json": "https://api.anyplot.ai/specs/spectrogram-mel/matplotlib/code",
  "spec_json": "https://api.anyplot.ai/specs/spectrogram-mel",
  "render_light_png": "https://storage.googleapis.com/anyplot-images/plots/spectrogram-mel/python/matplotlib/plot-light.png",
  "render_dark_png": "https://storage.googleapis.com/anyplot-images/plots/spectrogram-mel/python/matplotlib/plot-dark.png",
  "quality_score": 90.0,
  "license": "MIT",
  "guide": "https://anyplot.ai/llms.txt"
}
Part of Mel-Spectrogram for Audio Analysis on anyplot.ai.